- 金币:
-
- 奖励:
-
- 热心:
-
- 注册时间:
- 2006-7-3
|
|

楼主 |
发表于 2009-5-8 11:32
|
显示全部楼层
Thursday, October 05, 2006What Does It Mean?
Another new high on the Dow today. I'm as confused as you are.
I was amused to see the cover story on Newsweek. For contrary thinkers out there, maybe this is another sign that oil's recent plunge is done for now and you should go bullish. I certainly have.

The recent breakout in the Dow leaves us thinking: what does it mean? Two possibilities are (1) a sustained, meaningful breakout, past 12,000 and beyond; or (2) a fake breakout.
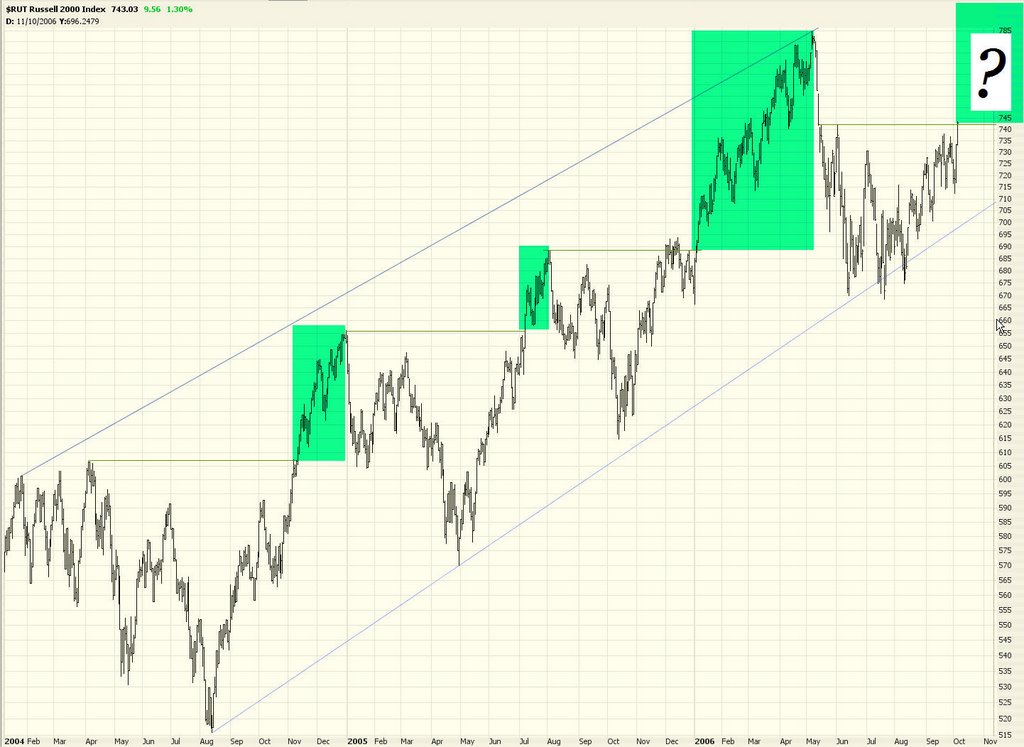
I was looking at a century-looking chart of the Dow 30, and I saw something fascinating. Check this out (clicking on the image for a bigger version):
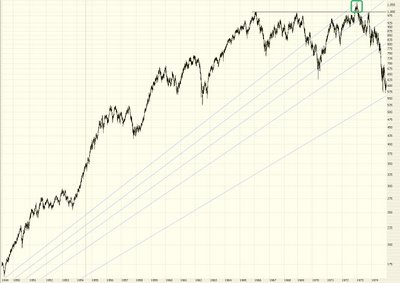
As you can see by the circle, there was a breakout in 1972. The pattern is similar to what we're seeing today. A long struggle to get past a major milestone (back then, it was Dow 1,000 as opposed to Dow 11,750). It broke out in Autumn - just like now - and it pushed the Dow up another 4% or so until January. Then, voom, it started plunging hard.
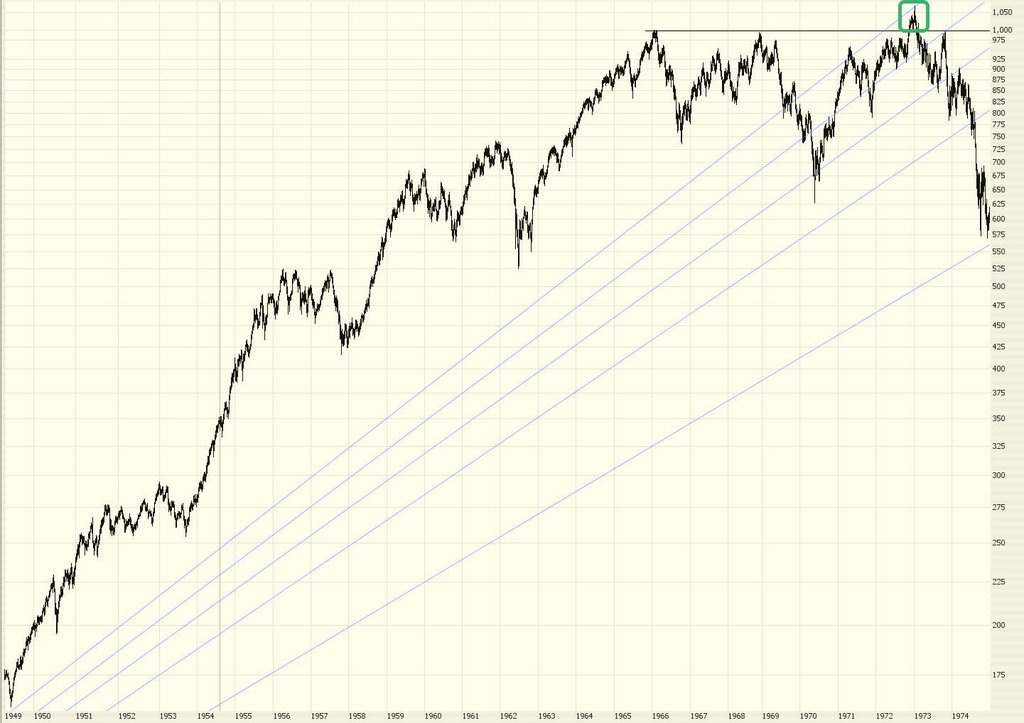
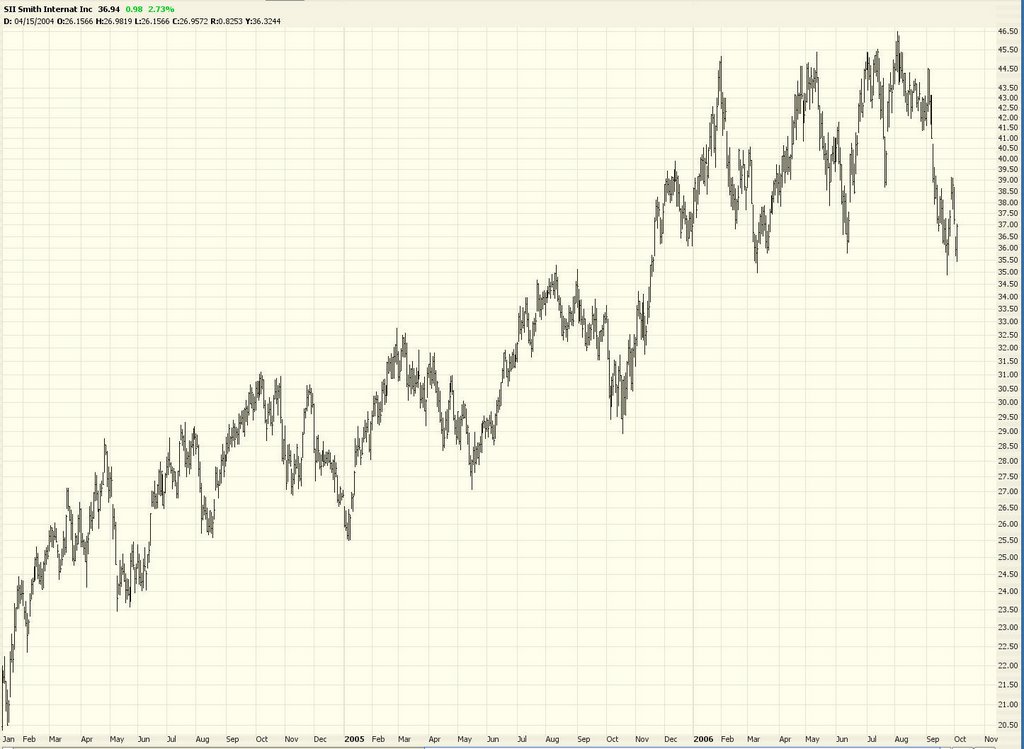
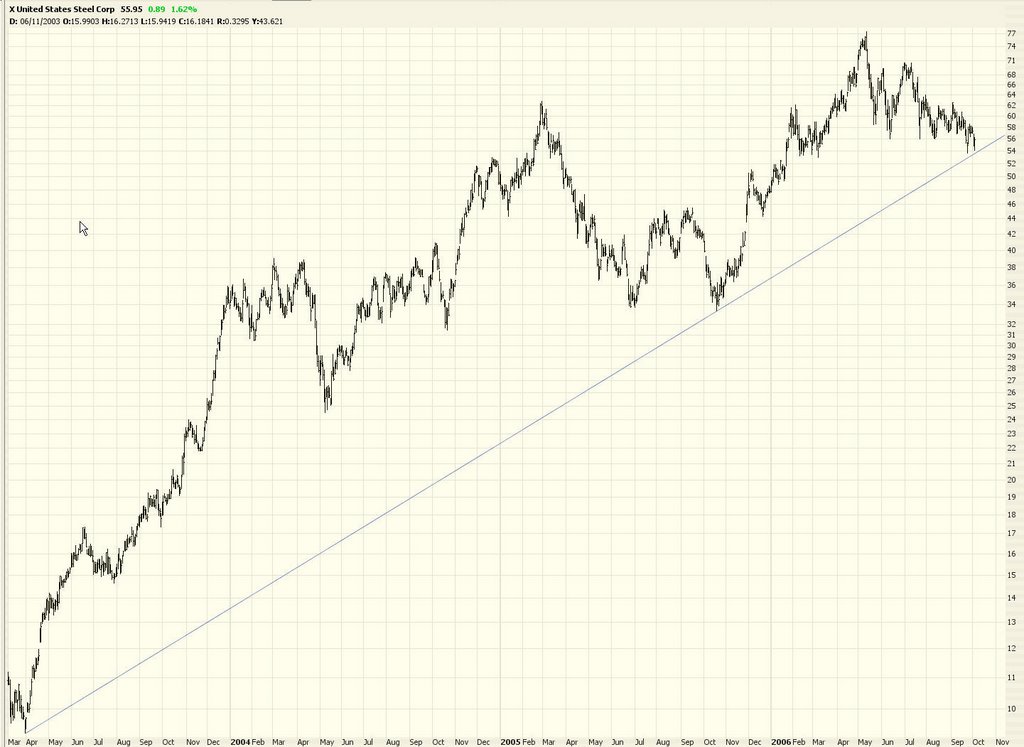
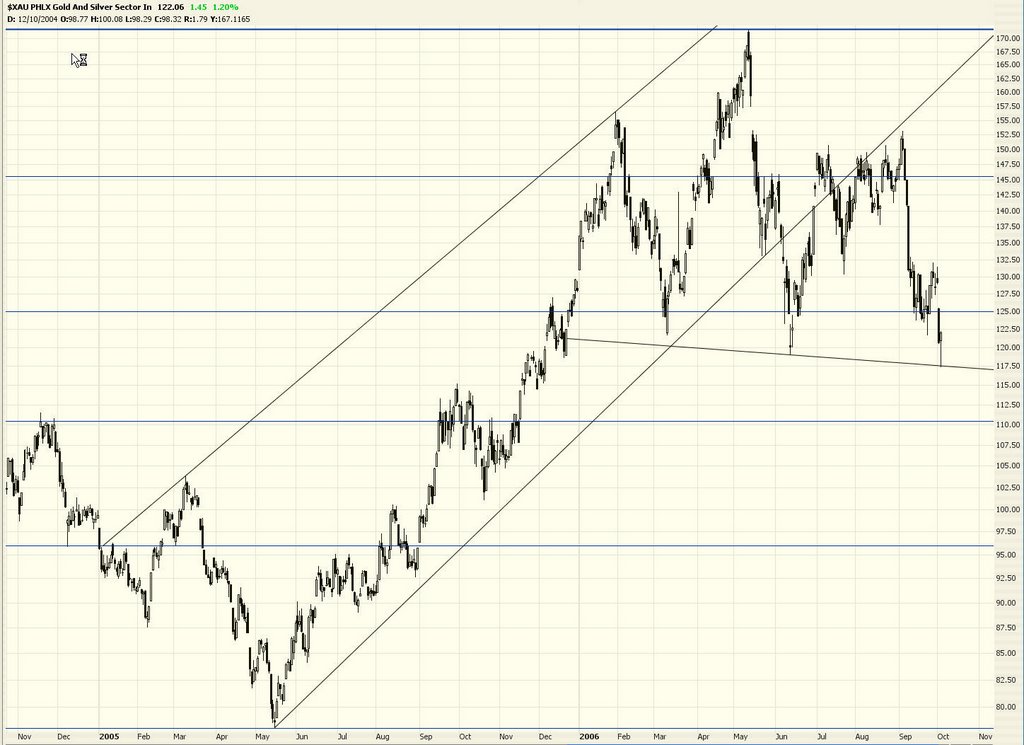
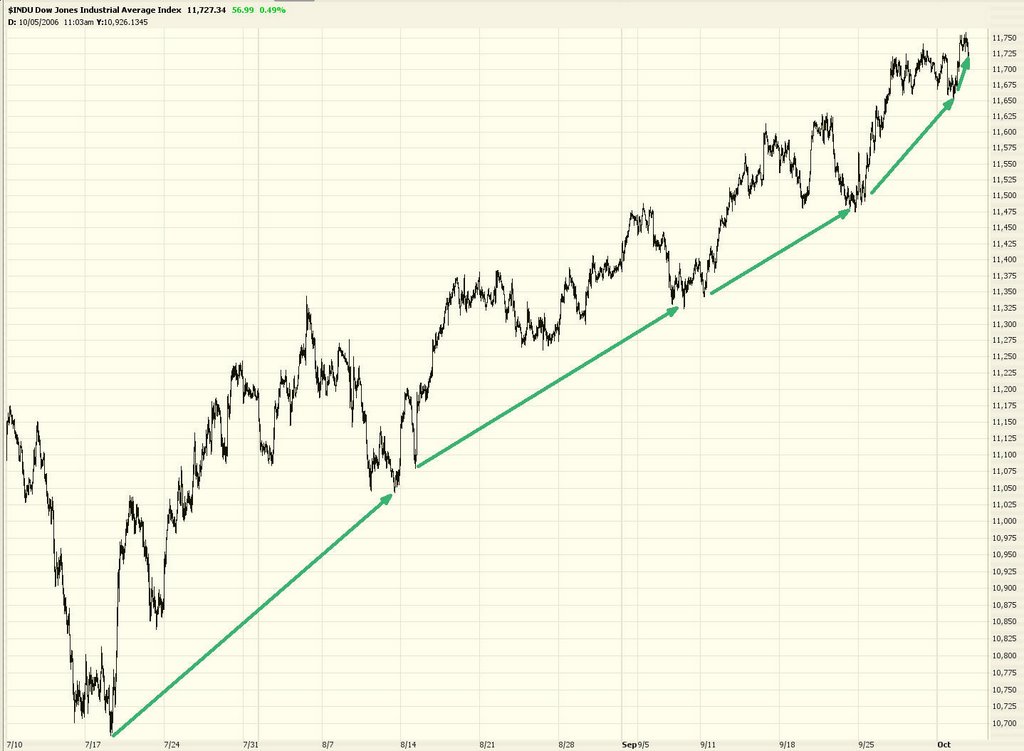
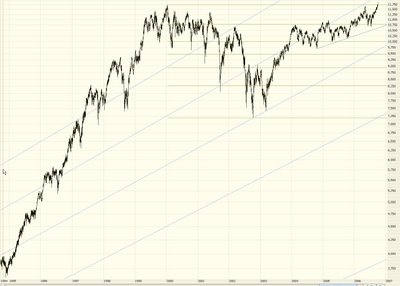
Does that mean this is what will happen this time? I don't know. Maybe. But it at least proves that a new breakout, even on a major index, doesn't guarantee a sustained movement to the upside. Here's what our own market looks like in the present day:
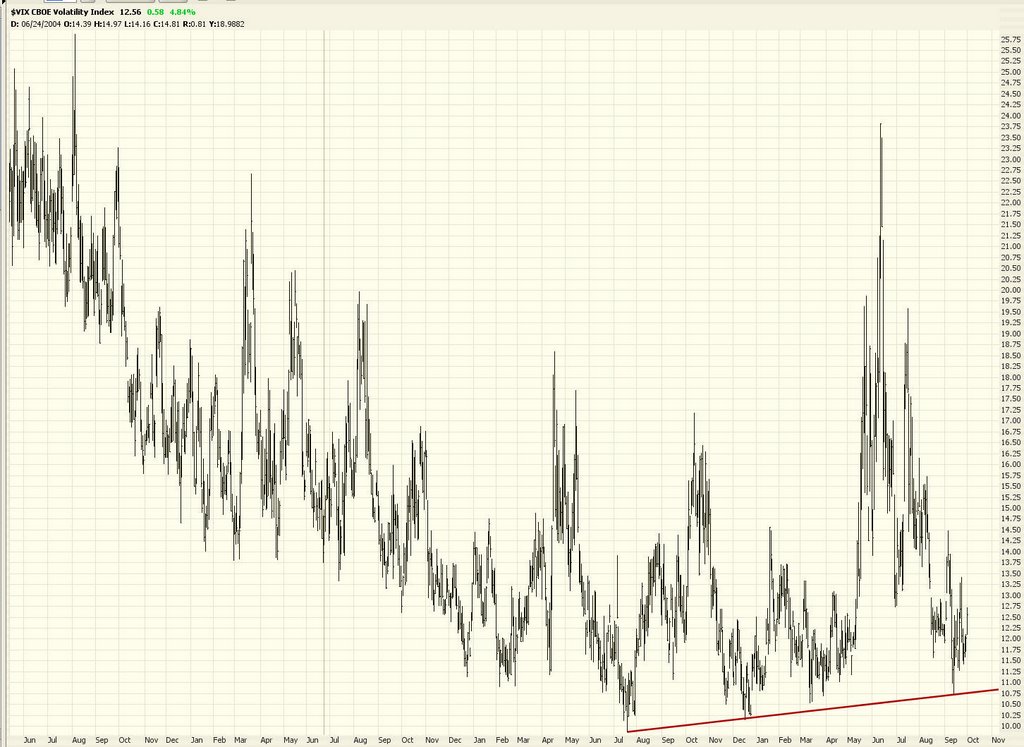
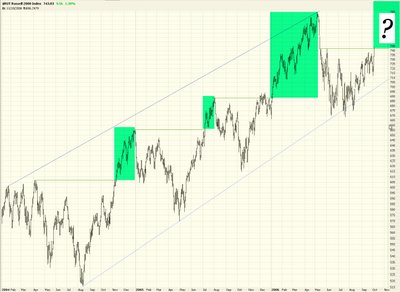
I was disappointed - very - that one of my last holdouts, Russell 2000, pushed through resistance today. As prior breakouts indicate, this could be very bullish for this index. I've shaded in green the movement following similar breakouts. I'm no longer in this position and currently am holding a mixed bag of puts and calls (the latter being mostly in energy).
at 10/05/2006 33 insightful comments
 Links to this post Links to this post
Labels: $rut, breakout, fibonacci fans, new high, oil |
|
|
 [复制链接]