- 金币:
-
- 奖励:
-
- 热心:
-
- 注册时间:
- 2006-7-3
|
|

楼主 |
发表于 2009-3-25 15:49
|
显示全部楼层
Posted by bonddad at 1/05/2009 06:58:00 AM
1 comments Links to this post 
Market Monday's
Welcome back to the first full week of the new year. I hope everybody had a happy and safe holiday season. Let's jump right into the fray because there are some good things happening in the market.
Click for a larger image
Notice the following on the three month daily chart:
-- Prices have broken through the downward sloping trend line that started in early October.
-- Prices are above all the SMAs
BUT:
-- The SMAS are bunched together, indicating a lack of overall direction, and
-- The break-through happened on low volume (which is to be expected in end-of-the-year trading.

Click for a larger image
-- On the P&F chart, note the market formed a triple top at the end of the year and has now broken out of that top.
Also consider the following points from this week's Barron's:
Stocks kicked off 2009 with a sprightly rally, but the longevity of that start will ultimately depend on stocks' ability to attract that record dry powder.
And it's quite a cache of capital. The amount of money stashed in money-market mutual funds had surpassed that in stock mutual funds as of the end of November, according to the Investment Company Institute, a national association of investment companies. In contrast, money-market funds were just 48% of stock funds when 2008 began. "If all the money currently sitting in U.S. money-market funds left and went into buying shares of the Standard & Poor's 500 index, it would absorb 42%" of that benchmark's market value -- the highest in at least 25 years, says Jason Goepfert of sentimentrader.com.
That's not all. Stocks' 38.5% pummeling in 2008, their third worst year ever and the biggest annual loss since the Great Depression, had sent investors scurrying. Today, Americans are setting aside just 42% of their investment money for stocks, says the American Association of Individual Investors. At the same time, 42% of their portfolio is in cash, the highest ever. "Never before have these investors allocated as much or more to cash as they have to stocks," Goepfert says.
Individuals aren't alone, and even professional money managers are hiding in short-term Treasuries that yield next to nothing. A time will come when earning zero interest starts to get old.
And consider the following points from an interview with Laszlo Birinyi:
An indicator that we developed is the number of stocks that are down 50% from their highs. At the market bottom recently, 322 of the S&P 500 stocks were down 50% from a year ago; that's an extremely oversold condition. The previous record, which was set in July of 2002, was 130 stocks. To us, that's a very useful measure of whether the market is oversold or overbought.
.....
You published a note last month titled "S&P 750: The Bottom." What led to that conclusion?
A few things caught our eye. One was that we started to have some very bad days in November but the market still recovered. On Dec. 5, the unemployment news was really terrible and yet the market recovered that day, with the S&P closing up 3.7%. To us, those are signs of a positive market where people are starting to look beyond the bad news.
It seems traders are looking at current economic news as occurring at or near the absolute bottom in the economic cycle. Assuming that to be the case, people are trying to get in early on a perceived rally that will occur in the first half of the year.
What else caught your eye in calling a market bottom?
We did an analysis that came out of our cycle study, and it showed that the greatest amount of decline in a bear market is always at the very end of the bear market. As we saw it, if indeed the market did bottom in November, as we suggested, a total of 70% of the decline occurred in the last quartile of the bear market. We also noticed that financial stocks were starting to show some stability, as well as large-cap stocks.
Consider the from September to mid-October the market (the SPYs) fell from 120 to 84, or a drop of 30%. That's a big drop and could easily fall into the point made above.
Bottom line: there are a lot of bullish elements lining up for the year. Whether they play out is a different story.
Posted by bonddad at 1/05/2009 05:00:00 AM
1 comments Links to this post
Labels: market analysis
Wednesday, December 31, 2008Happy New Year
It's new years eve. Being a self-employed person I have learned I have an incredibly understanding boss who is giving me the rest of the week off (actually, practically the whole world is treating this week as a vacation week). To that end, I am signing off until next Monday -- the first full trading week of the year.
Below is a picture of three dogs. You may not be able to see them, but they are there. On cold nights, Mr$s. Bonddad and I cover the pups with a blanket because, well, we're dog nuts.
So have a happy -- and safe -- holiday and I will see everybody bright and early on Monday morning.

Posted by bonddad at 12/31/2008 09:44:00 AM
2 comments Links to this post
Wednesday Commodity Round-Up

Click for a larger image
Notice the following on the weekly chart:
-- All the SMAs are moving lower
-- The shorter SMAs are below the longer SMAs
-- Prices are below all the SMAs
BUT
-- The MACD is oversold
-- The RSI is oversold
-- Prices are forming a triangle consolidation pattern

Click for a larger image
Notice the following on the daily chart:
-- Prices have been dropping for the last 6 months
-- All the SMAs are moving lower
-- The shorter SMAs are below the longer SMAs
-- Prices are below all the SMAs
BUT
-- The MACD has been rising for the last two months
Bottom line: technically, this chart wants to rally. But there are no fundamental reasons to commit to the commodities market right now.
Posted by bonddad at 12/31/2008 07:01:00 AM
1 comments Links to this post
Labels: commodities
Tuesday, December 30, 2008Today's Markets

Click for a larger image
The SPYs are still in a questionable position.
-- Prices are below the downward sloping trend line
-- The SMAs and prices are in a very tight range with little indication about where to go.
My guess is the markets are waiting for the beginning of the year before they make a move in any direction.
Posted by bonddad at 12/30/2008 03:48:00 PM
1 comments Links to this post
We're Nowhere Near a Bottom in Housing
From Bloomberg:
Home prices in 20 U.S. cities declined at the fastest rate on record, depressed by mounting foreclosures and slumping sales.
The S&P/Case-Shiller index declined 18 percent in the 12 months to October, more than forecast, after dropping 17.4 percent in September. The gauge has fallen every month since January 2007, and year-over-year records began in 2001.
The financial market meltdown that’s reverberated around the globe has prompted banks to curb lending, signaling the housing slump will persist for a fourth year in 2009. Falling property values have eroded household wealth, causing consumers to pare spending and deepening what is projected to be the longest recession in the postwar period.
“As 2008 comes to an end, the housing market is left in a weaker state than at the beginning of the year,” Michelle Meyer, an economist at Barclays Capital Inc. in New York, said before the report. “Uncertainty remains high given the unprecedented nature of the recession.”
The central issue with the housing market now is price. As long as we see these massive drops in home prices we can say supply and demand are way out of sync.
Posted by bonddad at 12/30/2008 01:00:00 PM
2 comments Links to this post
Labels: housing
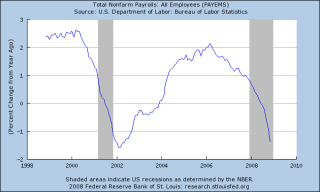
Employment is Looking Grim
Wherein I argue with myself ....
One of my central ideas of the current downturn is employment will experience about 6-9 months of terrible news and then get better -- or at least be less bad than before. There are several reasons for this theory:
1.) The worse rate of job losses over the last 60 years occurred in a recession in the 1950s when the economy lost 50% of the jobs it created in the previous expansion.
2.) Over the last few months we have seen an acceleration of job losses. I think what is happening is companies are "ripping the bank-aid off" -- getting the pain out at the end of a terrible year. Essentially, management is sitting in a board room and saying, "this year already sucks, let's just get the pain over with."
Here is something else to consider. Starting with the expansion of the 1980s the total number of establishment jobs created has decreased with each expansion. In other words, the expansion of the 1990s created fewer jobs than the expansion of the 198os and the expansion of the 2000s created fewer jobs than the expansion of the 1990s. I think what is happening is companies have learned to cope with less -- that it, they have continually whittled down their employment needs, hiring people only when absolutely necessary. A big boost to this theory is the mammoth increase in productivity we've seen over the same time, largely as a result of technology. People can simply do a whole lot more work; companies don't need armies of employees to perform a host of jobs. All this means that each person companies hire are that much more valuable to the company, making lay-offs that much harder. So when we do have lay-offs, times are really bad.
If both of these are true we have at most 6 months left of horrible employment/job market related news to go through.
However, the economy likes to make an ass out of economists whenever possible. So let's argue the contrary position.
The official jobless rate climbed to a 15-year high of 6.7% in November from 4.7% a year earlier. But that doesn't include people who have given up looking for work or those forced to work fewer hours as business conditions soured.
By adding underemployed and disaffected workers to the total, the so-called alternative unemployment rate stood at 12.5% in November, the highest since the Labor Department began tracking the series in January 1994. That's up from 11.8% in October and 8.4% a year earlier.
"We have obviously seen a very rapid deterioration in the employment situation," said Sophia Koropeckyj, an economist at Moody's Economy.com. "There are fewer people working and the people who are working are working fewer hours."
She said the alternative jobless rate could eventually hit 15%. The U.S. will release its December employment report on Jan. 9.
"Our expectation is that the recession could go on for another year and the unemployment rate will not reach a peak until 2010," she said.
Here is the accompanying graphic:

Click for a larger image
There are several indicators from the BLS that confirm the difficulty in the labor market. Here is a chart of the number of people who are working part-time for economic reasons:

Click for a larger image
The BLS defines these people thusly:
Over the month, the number of persons who worked part time for economic reasons (sometimes referred to as involuntary part-time workers) continued to increase, reaching 7.3 million. The number of such workers rose by 2.8 million over the past 12 months. This category includes persons who would like to work full time but were working part time because their hours had been cut back or because they were unable to find full-time jobs.
This number has been climbing sharply over the last year and is looking to get worse. This number tells us the jobs just aren't out there.
Here is a chart of people who aren't in the labor force although they searched for work and are available to work:

Click for a larger image
Again - this number is spiking and is near its highest level in 15 years.
And the length of time people are unemployed is increasing. Here is a chart for the number of people who were unemployed for 5-14 weeks:

Here is a chart for people who were unemployed for 15 weeks and longer:

And here is the chart for people who are unemployed for 27 weeks and longer:

All three of the above charts are near multi0decade highs.
So, on my side I have history and a theory about employment trends in my lifetime. The graphs above indicate times are already bad and could get worse.
Frankly -- who the hell knows what is going to happen at this point.
Posted by bonddad at 12/30/2008 09:45:00 AM
1 comments Links to this post
Labels: employment
Treasury Tuesdays
Click for a larger image
Let's start with the long end of the curve. From September through December, the TLTs were trading in a slightly compressing triangle. Then they went parabolic, rising from 98 to 120 -- a gain of 22.44%. That type of gain is literally unheard of in the fixed income world and indicates the Treasury market is in a bubble.

Click for a larger image
The IEF (7-10 years) also rose through important technical resistance right around the 92.50 level and is now 7.5% above the high points of its 9 month trading range.
With both of these charts, notice the extremely sharp increase in prices that's happening right now; these are large jumps for a fixed income security. Also note the SMAs -- they are all sharply up indicating traders are bidding these securities up sharply.

Click for a larger image
On the short end of the curve, first notice the rise since the end of June. The rally has been strong and continuous.
On the three month chart notice the following:
-- Prices used the 10 and 20 day SMAs as technical support for the last three months. Now prices have moved below that level.
-- The 10 day SMA is about to cross below the 20 day SMA
These are all initial moves, and could easily be reversed with a week or so on contrary action, so don't bet the farm on these moves. However, they do indicate times might be gearing up for a change.
Posted by bonddad at 12/30/2008 06:39:00 AM
1 comments Links to this post
Labels: Treasury Market
Monday, December 29, 2008Today's Markets
Click for a larger image
Notice the following:
-- Prices have not moved above the downward sloping trend line that started in October
-- The SMA picture is still very cloudy. The SMAs are bunched together in a very tight range and aren't showing strong direction either way
-- Prices are slightly below the SMAs, but that's just not saying much right now.
Bottom line: this is a very indecisive picture.
Posted by bonddad at 12/29/2008 03:30:00 PM
1 comments Links to this post
Labels: market analysis
Retail Will Get Worse Before it Gets Better
From Bloomberg:
U.S. retailers face a wave of store closings, bankruptcies and takeovers starting next month as holiday sales are shaping up to be the worst in 40 years.
Retailers will close 12,000 stores in 2009, according to Howard Davidowitz, chairman of retail consulting and investment- banking firm Davidowitz & Associates Inc. in New York. AnnTaylor Stores Corp., Talbots Inc. and Sears Holdings Corp. are among chains shuttering underperforming locations.
More than a dozen retailers, including Circuit City Stores Inc., Linens ‘n Things Inc., Sharper Image Corp. and Steve & Barry’s LLC, have sought bankruptcy protection this year as the credit squeeze and recession drained sales. Investors will start seeing a wide variety of chains seeking bankruptcy protection in February when they file financial reports, said Burt Flickinger.
“You’ll see department stores, specialty stores, discount stores, grocery stores, drugstores, major chains either multi- regionally or nationally go out,” Flickinger, managing director of Strategic Resource Group, a retail-industry consulting firm in New York, said today in a Bloomberg Radio interview. “There are a number that are real causes for concern.”
This shouldn't be surprising considering retail sales are off for the holiday season:
Price-slashing failed to rescue a bleak holiday season for beleaguered retailers, as sales plunged across most categories on shrinking consumer spending. Total retail sales, excluding automobiles, fell over the year-earlier period by 5.5% in November and 8% in December through Christmas Eve, according to MasterCard Inc.’s SpendingPulse unit. WSJ
Customer visits to U.S. retailers fell 24 percent last weekend compared with a year earlier, the biggest drop on record, as deepened discounts failed to attract consumers. Foot traffic was hurt by the economy, unfavorable weather and a calendar shift, research firm ShopperTrak RCT Corp. said.
Barron's ran a story on the retailers a few weeks ago. Here are some snippets from the article:
Among cash-rich retailers, Nike and Coach look especially attractive. They sport moderate price/earnings multiples, have little debt and are expected to report higher earnings in fiscal 2009. Bob Drbul, a retail analyst at Barclays Capital, has an Overweight rating on both, and notes that "retailers become more dependent on established brands" in uncertain times.
.....
The equity markets already have sniffed out retailers that could have big problems in coming quarters. Bon-Ton Stores , a regional department-store chain, trades for 1.16 a share, down from a high of 57 in March 2007. Talbots , a women's apparel chain, fetches 2.30; Dillard's , 3.78, and Charming Shoppes , another women's-wear retailer, 2.88. All are expected to report losses this year, and have borrowed heavily relative to their operating performance. Bottom fishing among these stocks looks unwise for now.
.....
THE NATION'S LARGER department stores also face a tough 2009, but they are in better financial shape. J.C. Penney , the mall-based retailer, has $3.5 billion of debt but $1.6 billion of cash. It should have little trouble funding its first debt maturity of $506 million in 2010, and a subsequent payment of $230 million in 2012. Kohl's has a similar customer base and a strong balance sheet. But its shares are cheaper, at 13.9 times 2009 earnings estimates, than Penney's, at 15.1.
Posted by bonddad at 12/29/2008 11:48:00 AM
2 comments Links to this post
We're Nowhere Near a Bottom in Housing
You'd think I'd get tired of writing that headline. But not with the current information we have on the market. Let's start with the charts (courtesy of Calculated Risk)

Click for a larger image
Sales were pretty even for most of 2008. But they dropped big time last month. Some of that might be end of the year backing away -- no one wants to buy a house in December unless they absolutely have to. But it's also important to remember there has been no good news for awhile now. The US is formally in a recession; the financial sector is tightening credit standards. The stock market is down 40% for the year. It's a pretty bleak time.

Click for a larger image
Notice total homes available for sale has fluctuated between 4 and 4.5 million for the last year and a half. In other words -- we haven't made a dent in the homes on the market. There are several reasons for this. Sales were dropping for most of 2007, letting inventory build. While sales evened out in 2008 they did so at a much slower pace than 2007, thereby allowing inventory to continue to build. Then you have a rash of foreclosures adding to inventory for 2008 in addition to a credit crunch which is restricting borrowers. Bottom line: this is not an environment where inventory gets cleared.
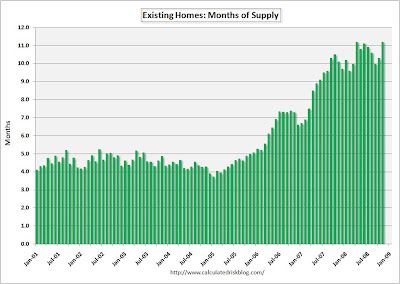
Click for a larger image
The months of inventory available has been floating around 9.5 to 11 months for the last year and a half. Simply put -- inventory isn't moving.
And now it appears people are waiting for lower prices before they commit:
As the ads say, "more than just a privileged few" can call the brand-new Opera Tower home.
Thanks to the tattered housing market, renters are welcome at this marbled luxury condo soaring over Biscayne Bay — billed as the "jewel of Miami's Cultural District."
.....
Lease-to-own programs are also cropping up in other places such as New York — specifically, in some overbuilt parts of Brooklyn.
Homebuilder Toll Bros. (TOL) is pushing rent-to-own units in its new luxury condo tower on the Brooklyn waterfront in the borough's trendy Williamsburg section, an area with a glut of new projects.
.....
In economically hard-hit Lansing, Mich., the Gillespie Group recently offered several lease-to-own units in a new condo it built in the Stadium District.
"In mid-September we seemed to have just hit a wall as far as customers' desire (or ability) to close or buy," said President Pat Gillespie.
But just one person has signed a contract. So Gillespie plans to push straight rentals after the holidays.
Indeed, pure rentals seem to be trumping rent-to-own deals.
"People think prices are going to continue dropping so they're renting and waiting out the market," said Steve Anderson, an agent with Carson Realty Group in Miami Beach.
People are getting smart and builders are getting desperate. Builders are treading water, trying to hold-on the best they can through one of the worst markets in generations. Buyers are getting hip, realizing they can wait for awhile longer before they commit.
Posted by bonddad at 12/29/2008 09:30:00 AM
1 comments Links to this post
Labels: housing
Market Monday's
Like last week, this week is a short week. There is new years eve on Wednesday and New Year's day on Thursday, meaning Friday is all but gone as well.
Let's start the week with a few charts:
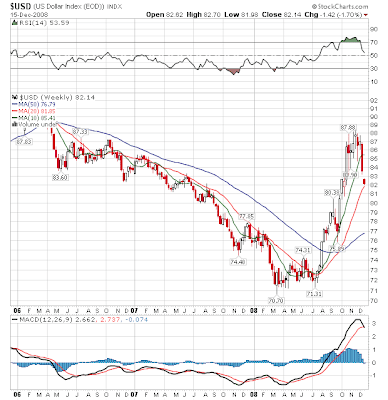
Click for a larger image
The really big dip at the end of November (when prices dropped to the 74-76 range) really crimps the read of this chart. Without that dip I would call this a consolidation triangle. However even with that we have a declining trend line at the top of the formation and a declining average volume count at the bottom.
Click for a larger image
On this chart, simply notice the rally that started in late November is over.

Click for a larger image
On this chart, notice there is a lot of technical support in the 82-84 area.
Click for a larger image
Let's look at the SMA picture
-- Notice the 10, 20 and 50 day SMAs are all bunched up. This indicates a lack of conviction from either the bulls or the bears.
-- Prices are below the SMAs, but not by much
-- Volume has been decreasing for most of December
-- There is no firm direction either way from the SMAs
Posted by bonddad at 12/29/2008 05:00:00 AM
3 comments Links to this post
Labels: market analysis
Tuesday, December 23, 2008Merry Christmas
Tomorrow is Christmas Eve. I and Mr$. Bonddad have a ton of work to do before we have our first Christmas dinner with family at our house. Daddy Bonddad is in town along with a lot of other family. Needless to say, my list of honey do's is long. To that end, I am going to sign off the blog until next Monday. On behalf of me, Mr$. Bonndad and our our extended family I want to wish all the readers of this blog a Merry Christmas.

Posted by bonddad at 12/23/2008 10:26:00 AM
6 comments Links to this post
Treasury Tuesdays

Click for a larger image
Notice the prices are way above the trend channel that lasted for most of nine months. That's a big deal

Click for a larger image
Notice the following on the daily chart:
-- Prices are 7% above the upper trend line of 9 month trend channel mentioned above
-- All the SMAs are moving higher
-- The shorter SMAs are above the longer SMAs
-- Prices are above all the SMAs
The 10-year treasury is currently yielding 2.15%. Who would have thought that was even possible? A county that is about to balloon its existing debt can do so at 2.15%? Go figure.
Posted by bonddad at 12/23/2008 09:00:00 AM
0 comments Links to this post
Labels: Treasury Market
Newer Posts Older Posts Home |
|
|
 [复制链接]