- 金币:
-
- 奖励:
-
- 热心:
-
- 注册时间:
- 2006-7-3
|
|

楼主 |
发表于 2009-3-25 15:30
|
显示全部楼层
Labels: housing
Asia Taking It Hard
From the WSJ:
South Korea's economy shrank a more-than-forceast 5.6% in the fourth quarter, its worst performance in a decade, showing how hard the global downturn is hammering Asia's exporters. "It's far worse than expected," said Standard Chartered economist Chun Chong-woo. "Today's data will spur the central bank to move to cut (interest) rates further to 1.5% by the end of the first half."
The seasonally adjusted gross domestic product figure for the October-December period compares to 0.5% growth in the third quarter, according to preliminary data issued by the Bank of Korea on Thursday.
And Singapore is not looking so hot:
Singapore, a bellwether for Asia's export industry, sharply reduced its economic outlook for 2009, prompting concerns that the region's slowdown is intensifying and putting additional scrutiny on a slew of economic figures expected in coming days.
The city-state said Wednesday it expects its economy to shrink by 2% to 5% this year. The forecast marks a downward revision from just three weeks ago, when officials at Singapore's Ministry of Trade and Industry predicted a worst-case decline of 2% and possible growth of 1%. The ministry blamed increasingly pessimistic signals of weakening global demand for key products such as electronics and chemicals.
Let's take a look at the respective indexes via ETFs. As always, click on each image for a larger image:
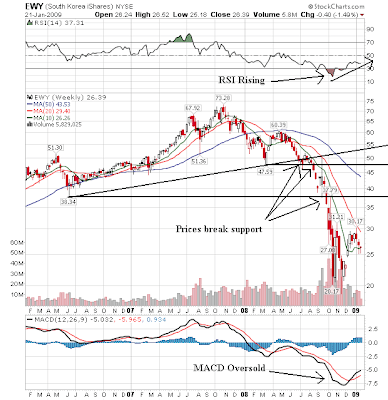
Notice the following on the South Korean ETF
-- Like the US, prices plunged in the second half of last year; the market lost about 50% of it's value
-- The 20 and 50 week SMA are both moving lower
-- The 10 week SMA is moving sideways
-- Prices have rallied from lows into the 20 week SMA only to fall back to the 10 week SMA which is currently a support level
-- The RIS is rising
-- The MACD is oversold
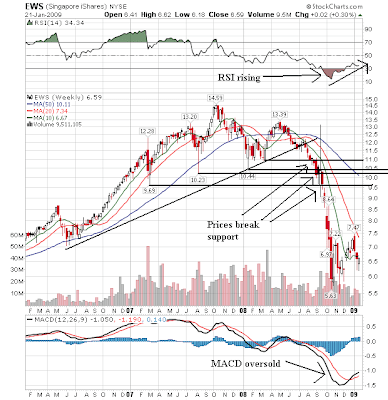
Notice the following on Singapore's chart:
-- Prices dropped hard in the second half of last year, losing about half their value
-- The 20 and 50 week SMA are both moving lower
-- The 10 week SMA is moving sideways
-- Prices are gravitating abound the 10 week SMA
-- The MACD is oversold
-- The RSI is rising
Posted by bonddad at 1/22/2009 12:30:00 PM
0 comments Links to this post 
More Bad Employment News
From the WSJ:
Intel Corp. said it will close several older factories, displacing 5,000 to 6,000 workers, as the company reacts to a sharp drop in demand for its computer chips.
The Silicon Valley giant had previously expressed optimism that prior job cuts would be sufficient to cope with the recession's impact on its business. But with a 90% drop in fourth-quarter earnings and a downbeat outlook from computer makers, pressures increased to cut costs further and improve the sagging utilization of its factories.
Intel said not all the affected employees, about 6% to 7% of its work force of 84,000, will lose their jobs. Some may be offered positions at other factories, the company said.
The cuts come on the heels of similar moves across the technology industry. Advanced Micro Devices Inc. last week said it was cutting 1,100 jobs and imposing temporary pay cuts in response to the economic slowdown.
Last week, Intel Chief Executive Paul Otellini told employees in an internal Webcast that profitability in the first quarter was too close to call. Intel hasn't reported a net loss since 1986. An account of Mr. Otellini's remarks was reported by Bloomberg.
And even the mighty IBM is feeling the pain:
International Business Machines Corp. employees have informed Alliance@IBM, an affiliate of the Communication Workers of America, that workers at a number of locations have been told their jobs are being eliminated.
Lee Conrad, national coordinator for Alliance, said that he has received a number of reports of people being informed that they are subject to what IBM calls a "resource action." He said that the reports are coming from people who work for the software group in applications development and marketing, among other functions.
Let's tie this information in with the mass-layoff series from the BLS: Here is a graph of seasonally adjusted mass-layoffs:
Not a pretty picture, is it?
Posted by bonddad at 1/22/2009 10:00:00 AM
0 comments Links to this post
Labels: employment
Click on all images for a larger image
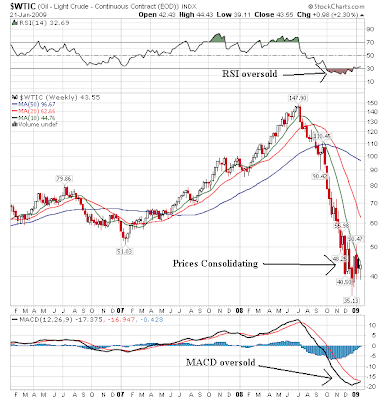
Notice the following on the weekly chart:
-- Prices are consolidating between the 40 and 45 dollar area
-- All the SMAs are moving lower
-- Prices are below all the SMAs
-- The shorter SMAs are below the longer SMAs
-- The RSI is oversold
-- The MACD is oversold
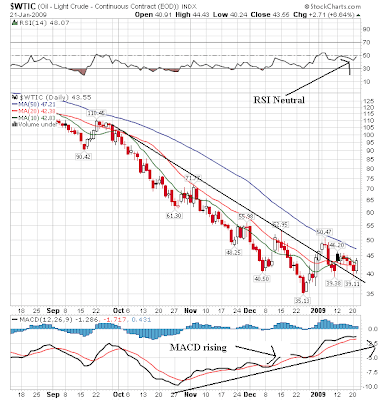
Notice the following on the daily chart:
-- Prices broke through the downward sloping trend line, but haven't been able to maintain the upward momentum.
-- Prices and the 10 and 20 day SMA are in a tight range
-- The MACD has been rising
-- The RSI is at an OK level but not great
While the weekly chart wants to rally, the daily chart is meandering right now. The main reason is inventories of various oil products are high:
 US crude oil inventory is the highest its been in a year US crude oil inventory is the highest its been in a year
 Gasoline stocks have been increasing since the latter part of last year, and Gasoline stocks have been increasing since the latter part of last year, and
Distillate inventories are also at yearly highs. As a result of all this:
Gas prices have been dropping like a stone, although they have rebounded over the last few weeks.
As a result of oil's malaise, the oil related areas of the market are also treading water:

On the XLE weekly chart, notice the following
-- The 20 and 200 week SMA are falling
-- The 10 week SMA is moving sideways
-- Prices are tied-up with the 10 week SMA
-- Prices are consolidating between the 42 and 50 level
-- The MACD is oversold
-- The RSI is increasing
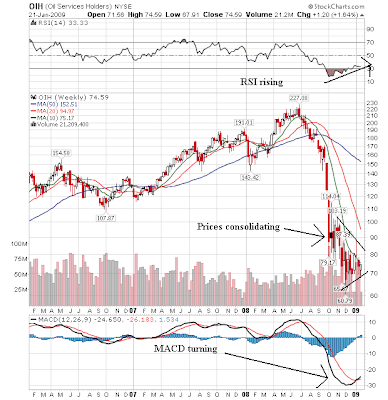
Notice the following on the oil holder's weekly ETF
-- All the SMAs are moving lower
-- The shorter SMAs are below the longer SMAs
-- Prices are below all the SMAs
-- Prices are consolidating
-- The MACD is oversold
-- the RSI is rising
Posted by bonddad at 1/22/2009 06:32:00 AM
0 comments Links to this post
Labels: oil
Wednesday, January 21, 2009Today's Markets
Click on all pictures for a larger image

One heck of a rally today. Once prices got near yesterday's lows the rally started. After lunch the whole market went long aggressively bidding the market higher. Note that prices moved higher until the close and ended with strong volume. Also note prices regained a fair amount of ground lost yesterday.
Notice that prices have crossed over a downward sloping trend line that started over a week ago.

But on the daily chart, we're still in bearish mode -- prices are below all the SMAs, all the SMAs are moving lower and the shorter SMAs are moving lower.
Posted by bonddad at 1/21/2009 04:10:00 PM
0 comments Links to this post
So -- How Good Was the Bush Economy?
See the results here
Posted by bonddad at 1/21/2009 02:27:00 PM
1 comments Links to this post
The Detroit Death March Continues
From the AP:
General Motors sold fewer cars globally than Toyota last year, as the Japanese automaker passed the Detroit company for the first time.
GM says it sold 8.356 million cars and trucks in 2008, falling about 616,000 vehicles short of Toyota's total of 8.972 million.
General Motors Corp. posted an 11 percent drop for the year, while Toyota's sales fell 4 percent.
Posted by bonddad at 1/21/2009 11:30:00 AM
1 comments Links to this post
Financials Still Collapsing
From IBD:
Financial shares crashed to new lows after top asset management firm State Street and a regional bank reported huge losses, putting pressure on President Obama to come up with quick solutions to a rising tide of red ink.
State Street (STT) said it may need to raise capital following huge unrealized losses in its commercial paper program and investment portfolio. Meanwhile, Regions Financial (RF), a big Southern bank, lost $6.22 billion in the fourth quarter on massive write-downs.
The bad news sent the SPDR Financial ETF tumbling 16.5%, its fourth straight drop and a record low. It's down 35% in 2009 alone.
Bank of America (BAC) lost 29% and Citigroup (C) 20% after both reported big losses last week. JPMorgan Chase (JPM) dived 21% and Wells Fargo (WFC) 24%.
All the banks cited above hit long-time lows.
As we enter earnings season expect more of this to happen. The bottom line is there is still a ton of bad debt out there which is deteriorating in quality. As that happens, banks will continue to take hits.
Here is a chart of the XLF -- the financial sector ETF:

Click for a larger image
Notice the following:
-- Prices have been dropping for a year and a half
-- Prices have continually moved through previously established lows
-- All the SMAs are moving lower
-- The shorter SMAs are below the longer SMAs
-- Prices are below all the SMAs
-- The MACD is moving lower
-- The RSI indicates prices are weak and have been for a long time.
Posted by bonddad at 1/21/2009 09:30:00 AM
0 comments Links to this post
Wednesday Commodities Round-Up
Today I'm going to look at Copper. Copper is used in many different industrial settings, so the price of copper is a good indicator of future economic activity. Please click on all images for a larger image
Notice the following on the monthly chart:
At the end of 2003, prices broke out in a big way, increasing from 1.00 to 1.50 by the end of 2004. By the end of 2005 prices more than doubled, closing near over 2.000. In 2006 prices really took off, but then they consolidated in a triangle pattern until mid-2008. Then prices dropped like a stone -- moving lower by 50% plus in roughly 6 months time.
On the weekly chart, notice the prices had some really big gaps down starting at the end of the second quarter. Also note the prices moved through key technical support levels as well.
This chart shows a massive move out of the copper market over the last 6-9 months. My guess is some of this is speculators getting out. However, I also think there is a great deal of bearishness out there regarding the economy which makes copper unattractive.
Consider the following points from the latest ISM manufacturing report:
"Manufacturing activity continued to decline at a rapid rate during the month of December. The decline covers the full breadth of manufacturing industries, as none of the industries in the sector report growth at this time. New orders have contracted for 13 consecutive months, and are at the lowest level on record going back to January 1948. Order backlogs have fallen to the lowest level since ISM began tracking the Backlog of Orders Index in January 1993. Manufacturers are reducing inventories and shutting down capacity to offset the slower rate of activity." PERFORMANCE BY INDUSTRYIn December, none of the manufacturing industries reported growth. The industries reporting contraction in December — listed in order — are: Nonmetallic Mineral Products; Wood Products; Fabricated Metal Products; Printing & Related Support Activities; Textile Mills; Plastics & Rubber Products; Paper Products; Transportation Equipment; Machinery; Primary Metals; Electrical Equipment, Appliances & Components; Chemical Products; Computer & Electronic Products; Miscellaneous Manufacturing; Food, Beverage & Tobacco Products; and Furniture & Related Products. Two industries reported no change in activity compared to last month: Apparel, Leather & Allied Products; and Petroleum & Coal Products.
And this is from the latest industrial production numbers from the Federal Reserve:
Industrial production fell 2.0 percent in December, and declines were again widespread. Output was revised up in October, but it was revised down in November; for the fourth quarter as a whole, total industrial production decreased 11.5 percent at an annual rate. At 103.6 percent of its 2002 average, output in December was 7.8 percent below its year-earlier level. In December, manufacturing production dropped 2.3 percent. The output of mines moved down 1.6 percent, and the output of electric and gas utilities was little changed. Capacity utilization for total industry fell to 73.6 percent in December, a level 7.4 percentage points below its average level from 1972 to 2007.
Simply put, this is not an environment where copper is widely used.
Posted by bonddad at 1/21/2009 06:51:00 AM
0 comments Links to this post
Labels: commodities |
|
|
 [复制链接]


