- 金币:
-
- 奖励:
-
- 热心:
-
- 注册时间:
- 2006-7-3
|
|

楼主 |
发表于 2009-3-25 15:32
|
显示全部楼层
Tuesday, January 20, 2009Today's Markets

Click for a larger image
Prices dropped below key levels today -- levels established last Thursday.
Also note the following:
-- All the SMAs are moving lower
-- The shorter SMAs are before longer SMAs
-- Prices are below all the SMAs
Click for a larger image
Notice the following on the daily chart:
-- Prices are below all the SMAs
-- All the SMAs are moving lower
-- The shorter SMAs are below the longer SMAs
Also note the extremely important downward bar today; prices took a major move lower.
Posted by bonddad at 1/20/2009 06:09:00 PM
1 comments Links to this post 
Labels: market analysis
About the Whole "Making Banks Lend" Thing....
From the blog Information Arbitrage:
Forcing banks to lend couldn't be a more intellectually bankrupt idea. The business of commercial banks is to lend money when the risk-adjusted returns exceed its cost of capital. Just lend money, because we said so? We've seen this movie before - it's called Fannie Mae and Freddie Mac - and it doesn't end well. The right way to approach the problem is to create truly healthy banks, either out of currently sick institutions or de novo, and to let them make rational lending decisions. If the Government sees a particular constituency that requires funding, don't force a bank to do it if it doesn't make economic sense. Either create a discrete program or use tax incentives to generate the necessary resources. The worst possible outcome of TARP is to create another generation of sick institutions by forcing them to make irrational loans to satisfy the moral (or public relations) objectives of our Government representatives. Obama needs to fight this urge with a vengance.
While I respectfully disagree with his statement about Fannie and Freddie, I agree wholeheartedly with everything else stated. You can't force banks to lend. Doing so will only lead to a host of other new problems.
Posted by bonddad at 1/20/2009 01:30:00 PM
4 comments Links to this post
A Closer Look At Lending
Below are charts from the St. Louis Federal Reserve of various components of lending. All charts show a year over year percentage change. Please click on all images for a bigger image.

Above is a chart for total credit outstanding. While the number is still positive it has taken a bit hit over the last year or so.
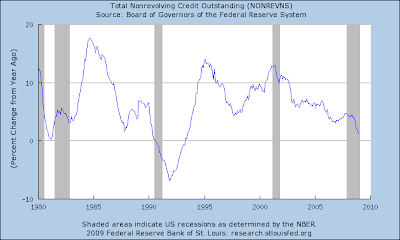
Total non-revolving credit outstanding is dropping. As is

Total non-revolving

Real estate loans outstanding are dropping as are
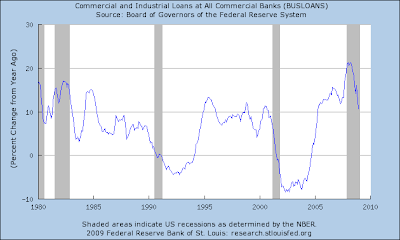
Commercial and industrial loans

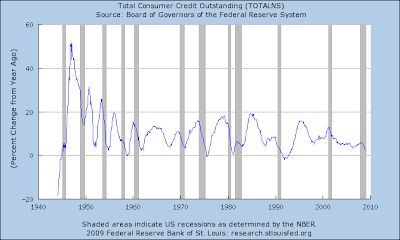
However, total consumer loans have leveled off.
What does this tell us? While the rate of change is still positive for all areas, the rate of change is decreasing. In some cases, the rate of change is very large and sudden. This is consistent with the anecdotal information from the Beige Book at the Senior Loan Survey mentioned below.
Posted by bonddad at 1/20/2009 11:30:00 AM
1 comments Links to this post
It's Not About Lending
From the WSJ:
The previous version of the U.K. rescue plan has failed to stem economic erosion or to revive lending. How much worse it will get for banks remains largely unknown. That was made plain on Monday when RBS said it expects to report a 2008 loss of £22 billion to £28 billion ($31.8 billion to $40.5 billion). Under the latest rescue provisions, the government's share of RBS will increase to 70% from 58%. RBS shares fell 67% on Monday.
In the US, we are in the middle of a recession that has gone on for over a year. According to the FDIC's latest Quarterly Banking survey, banks are in extremely bad shape:
Troubled assets continued to mount at insured commercial banks and savings institutions in the third quarter of 2008, placing a growing burden on industry earnings. Expenses for credit losses topped $50 billion for a second consecutive quarter, absorbing one-third of the industry's net operating revenue (net interest income plus total noninterest income). Third quarter net income totaled $1.7 billion, a decline of $27.0 billion (94.0 percent) from the third quarter of 2007. The industry's quarterly return on assets (ROA) fell to 0.05 percent, compared to 0.92 percent a year earlier. This is the second-lowest quarterly ROA reported by the industry in the past 18 years. Evidence of a deteriorating operating environment was widespread. A majority of institutions (58.4 percent) reported year-over-year declines in quarterly net income, and an even larger proportion (64.0 percent) had lower quarterly ROAs. The erosion in profitability has thus far been greater for larger institutions. The median ROA at institutions with assets greater than $1 billion has fallen from 1.03 percent to 0.56 percent since the third quarter of 2007, while at community banks (institutions with assets less than $1 billion) the median ROA has declined from 0.97 percent to 0.72 percent. Almost one in every four institutions (24.1 percent) reported a net loss for the quarter, the highest percentage in any quarter since the fourth quarter of 1990, and the highest percentage in a third quarter in the 24 years that all insured institutions have reported quarterly earnings.
In Every Beige book issued in 2008 has indicated credit conditions were tightening and loan demand was decreasing.
January 16, 2008:
Reports from banks and other financial institutions noted further declines in residential real estate lending, and lending to the commercial real estate sector was generally described as mixed. Some Districts reported lower consumer loan volumes, whereas the volume of commercial and industrial lending varied. Most Districts cited tighter credit standards.
March 4, 2008:
Most Districts reporting on banking cite tight or tightening credit standards and stable or weaker loan demand.
April 16, 2008:
Financial institutions in many Districts indicated some deceleration in consumer loan demand, tightening in lending standards, and deterioration in asset quality
June 11, 2008:
Lending activity also varied across Districts and market segments, though tighter credit standards were reported for most loan categories.
July 23, 2008
In banking, loan growth was generally reported to be restrained, with residential real estate lending and consumer lending showing more weakness than commercial lending.
September 3, 2008
Most Districts reported easing loan demand, especially for residential mortgages and consumer loans; lending to businesses was mixed.
October 15, 2008:
Credit conditions were characterized as being tight across the twelve Districts, with several reporting reduced credit availability for both financial and nonfinancial institutions
December 3, 2008:
Lending contracted, with many Districts reporting reductions in residential, commercial and industrial lending and tightening lending standards.
In addition to the Beige Book, the Federal Reserve issues a Senior Loan Officer Survey every three months. These reports stated the following:
January 2008:
In the January survey, domestic and foreign institutions reported having tightened their lending standards and terms for a broad range of loan types over the past three months. Demand for bank loans reportedly had weakened, on net, for both businesses and households over the same period.
April 2008:
Compared with the January survey, the net fractions of banks that tightened lending standards increased significantly for consumer and commercial and industrial (C&I) loans. Demand for bank loans from both businesses and households reportedly weakened further, on net, over the past three months, although by less than had been the case over the previous survey period.
July 2008:
In the current survey, large net fractions of domestic institutions reported having tightened their lending standards and terms on all major loan categories over the previous three months. In particular, the net fractions of banks that had tightened credit standards on consumer loans increased notably relative to the April survey.
October 2008:
In the current survey, large net fractions of domestic institutions reported having continued to tighten their lending standards and terms on all major loan categories over the previous three months. The net percentages of respondents that reported tightening standards increased relative to the July survey for both C&I and commercial real estate loans, as did the fractions reporting tightening for all price and nonprice terms on C&I loans.

Total credit is dropping on a year over year basis,
As is consumer credit.
And then we have this from the incoming administration:
The new team will manage the TARP “in a much different way,” David Axelrod, Obama's chief political adviser, said Jan. 18 on ABC's “This Week” program.
“He is going to have a strong message for the bankers,” Axelrod said. “We want to see credit flowing again.”
Another aide went further, criticizing the results of TARP under Paulson.
“Anyone who looks at it has got to be disappointed when they look at what's happened to lending, have got to think the results have been unsatisfactory,” Lawrence Summers, director-designate of the National Economic Council, said on CBS's “Face the Nation” program Jan. 18.
Simply put, we are not in a credit expansion friendly environment. That is not the point of what is happening. The government is attempting to prevent a broad-based financial meltdown. That's the metric for judging the current action.
They are making things up as they go along in this process -- that is incredibly obvious. But it's also important to remember, the last time we were here was 1929. It's been awhile. And while there has been a lot of debate about how to prevent a wide scale financial meltdown, there has been little practice at it.
Posted by bonddad at 1/20/2009 09:30:00 AM
0 comments Links to this post
Treasury Tuesdays
Click for a larger image
On the year long chart notice we're still in bubble territory; investors are still looking for safety and are finding it in the Treasury market

Click for a larger image
Notice the following on the daily chart
-- Prices have not yet rebounded to the 38.2% fibonacci level
-- The SMAs are sending a mixed signal; the 10 is below the 20, but the 20 has just turned lower.
-- Meanwhile the 50 and 200 are moving higher
-- After prices sold off, they did not reach the previous highs
Posted by bonddad at 1/20/2009 04:39:00 AM
0 comments Links to this post
Labels: Treasury Market
Monday, January 19, 2009Deflation ... Or The Effect of a Commodity Bear Market?
There has been increased talk of deflation over the last few weeks. What people are concerned about is a deflationary spiral:
A deflationary spiral is a situation where decreases in price lead to lower production, which in turn leads to lower wages and demand, which leads to further decreases in price. Since reductions in general price level are called deflation, a deflationary spiral is when reductions in price lead to a vicious circle, where a problem exacerbates its own cause. The Great Depression was regarded as a deflationary spiral.
However, I'm not sure this is an issue. From a look at the following charts, it looks as though we're feeling the effect of a commodity price bubble popping.
First, consider these three charts:
 Click for a larger image Click for a larger image
While industrial metals probably weren't in a bubble, prices have collapsed over the last six months. Given the major drop in industrial production this is to be expected.
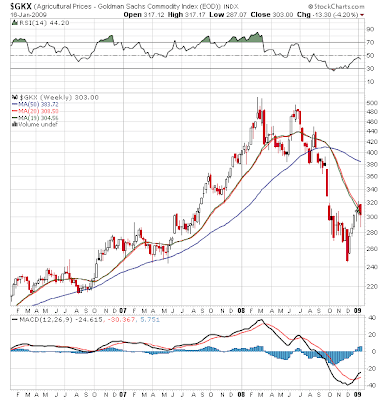
Click for a larger image
There is a higher possibility agricultural prices were in a price bubble of sorts. They formed a double top in 2008 and have since fallen approximately 50% since their second top at the end of the second quarter 2008.

Click for a larger image
The CRB index is heavily influenced by oil, which hit the 140+ level at the end of last summer. Now this index has also dropped about 50%.
So, two groups of commodities (agriculture and energy) were at really high prices. Some would argue these commodities were in a price bubble. I'm not sure if that was true or not -- there were strong reasons for a fundamental bull market. However, the rapid descent of the respective prices does give strong ammunition to the people who argue there was a bubble.
That being said... consider these charts.
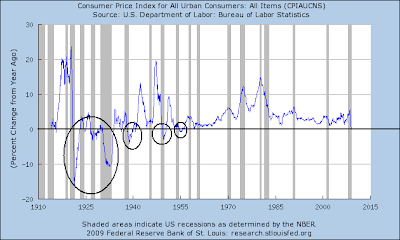
Click for a larger image
Above is a chart of the year over year change in CPI for all goods. Notice we are approaching the 0% level. That is something we haven't done for over 50 years. This is one of the primary problems of the Great Depression -- a deflationary spiral. Now prices are moving into that direction which has everybody understandably concerned.
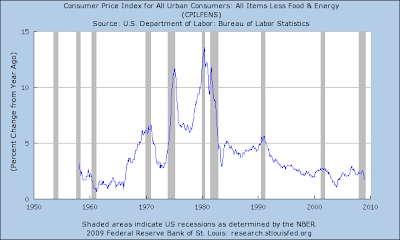
Click for a larger image
However, notice that the year over year rate of change for core CPI is still high. This tells us that the deflationary problems are commodity based. As does this chart of CPI's energy component

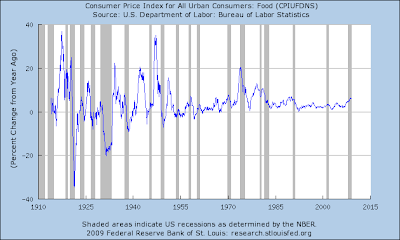
But note that food prices are still increasing year over year. In other words, from a CPI perspective, the drop in energy prices is a big reason for the big overall year over year drop.
Let's go a bit farther back in the product life cycle:

Above is the PPI for all commodities. Notice this has taken a nose dive. But:

Core producer prices prices still have a healthy year over year price gain. That's because

Click for a larger image
Producer prices for all commodities are dropping like a stone.
In other words, assuming the commodity prices were in a trading bubble, does that mean this isn't really deflation but instead a commodity based correction?
Posted by bonddad at 1/19/2009 11:30:00 AM
4 comments Links to this post |
|
|
 [复制链接]


