搜索
楼主: hefeiddd

一个笨蛋的股指交易记录-------地狱级炒手

  [复制链接]
 楼主| 发表于 2009-3-25 06:53 | 显示全部楼层
Wednesday, March 05, 200830 Minute Charts Wednesday


Posted by Brian


When Gasparino Speaks


Posted by Brian at 3/04/2008 03:10:00 PM


30 Minute Charts
The purple horizontal line is the VWAP from the date of the 75 basis point rate cut through trading mid day today.


Posted by Brian at 3/04/2008 12:30:00 PM


When Bernanke Speaks


Posted by Brian at 3/04/2008 09:34:00 AM


More Pressure
from financials (Citigroup) this morning. News and surprises follow the trend. No stabilization and definitely no bounce for now.

Here is the only response I received about the 13 week t-bill index.

that's a chart of the yield of the 13-week t-bill (16.40 being 1.64%) just like the TNX is a chart of the yield on the 10-year treasury. a falling yield on that thing would be evidence of continued strains and dislocations in the credit market and money continuing to pour into the short end of the curve and out of riskier fixed income securities; obviously driving up the price and driving bond yields down. breaking to a new low yield is not a good sign for the health of the credit market. there are still panicked people out there looking for a safe place to put cash. thanks Matt

Posted by Brian at 3/04/2008 08:54:00 AM


Newer Posts Older Posts Home
金币:
奖励:
热心:
注册时间:
2006-7-3

回复 使用道具 举报

 楼主| 发表于 2009-3-25 06:54 | 显示全部楼层
Monday, March 03, 200830 Minute Charts
Let's hope the Fed doesn't try to save the day. Let it bleed! Don't be blinded by greed though, always have stops!


Posted by Brian at 3/03/2008 02:18:00 PM


13 Week T Bill Index
seems to be a downside leader in this market and it just broke lower. I am not suggesting a trade based on that, it is just another piece of information which may be important.


Posted by Brian at 3/03/2008 01:22:00 PM


WMS Industries (WMS)
is the stock on WALLSTRIP today.


Posted by Brian at 3/03/2008 07:19:00 AM


Sunday, March 02, 2008Bet Against Gold?
I get emails from people telling me that Gold is a short, I would never step in front of a trend as strong as this with a short sale but if you wanted to HERE'S HOW


Posted by Brian at 3/02/2008 03:24:00 PM


Friday, February 29, 2008Video Stock Market Technical Analysis 2/29/08


Posted by Brian at 2/29/2008 04:26:00 PM


30 Minute Charts
The charts below have

a 5 day moving average- orange
VWAP since 75 bp rate cut- purple horizontal
key support- green
key resistance- red

The financials appear to be flirting with a more serious break down below support which could lead to a test of the lows in that sector. If such a break were to come it would likely lead the rest of the market. As I pointed out with resistance on the Qs yesterday, it is not the break of a key level that matters most, but the subsequent action. Risk management is job #1!

click to enlarge


Posted by Brian at 2/29/2008 11:28:00 AM


Boeing Company (BA)
is the stock on WALLSTRIP today.


Posted by Brian at 2/29/2008 07:11:00 AM


Thursday, February 28, 2008Video Stock Market Technical Analysis 2/28/08


I added links to some of the other video hosting sites just under the AMZN box on the right. If Youtube is having problems, I would suggest you try one of them. iTunes seems to get it posted pretty quick too.


Posted by Brian at 2/28/2008 04:12:00 PM


44.50 Holds For Another Day


Posted by Brian at 2/28/2008 03:32:00 PM


Newer Posts Older Posts Home
金币:
奖励:
热心:
注册时间:
2006-7-3

回复 使用道具 举报

 楼主| 发表于 2009-3-25 06:55 | 显示全部楼层
Thursday, February 28, 2008The Battle at 44.50
continues and the buyers persistance is impressive. Remember, it is not the break that matters as much as the subsequent action. If you are long or contemplating a buy past resistance be sure to have an exit strategy in mind if the break out materializes and then fails to hold.


Posted by Brian at 2/28/2008 02:52:00 PM


I Just Spoke
to a friend who is skiing today, I am jealous. Look at all the snow, 130% of average snowpack! The good news is that the snowpack doesn't peak for another 6 weeks on average.


Posted by Brian at 2/28/2008 02:08:00 PM


Brigham Exploration (BEXP)
I mentioned this stock in yesterdays video as one which looked poised for a move past resistance. I also suggested that the worst case stop should be placed just under 7.20 If you are involved in the stock I would sell at least half the position near curent levels and move the stop to breakeven on the balance.

EPS due Monday 3/3/08 After the CLOSE thanks Tom


Posted by Brian at 2/28/2008 12:21:00 PM


The Rangebound Market
has left a lot of traders with losses and a feeling of DEPRESSION

Do not force trades. If the market isn't providing you with good trading opportunities it is sending you a message to go slow. Cash is a a position which give you clarity for when easier trading conditions reveal themselves.

Posted by Brian at 2/28/2008 08:57:00 AM


Wednesday, February 27, 2008Stock Market Video Technical Analysis 2/27/08


I have no control of when the videos are available for viewing. Youtube is generally the first available, which is why I embed that one most often, but if it says "unavailable" you can always search the other sites I upload to; google, putfile, vsocial, vimeo, sumo, scilpo, yahoo, revver, itunes, etc.

* Facebook: http://www.facebook.com/video/video.php?v=10801522812
* Putfile: http://media.putfile.com/Stock-Market-TEchnical-Analysis-22708
* Sclipo: http://sclipo.com/stock-market-technical-analysis-2-27-08
* Sevenload: http://en.sevenload.com/videos/P ... al-Analysis-2-27-08
* Sumo: http://www.sumo.tv/video/3580184
* Vimeo: http://vimeo.com/734831
* Vsocial: http://www.vsocial.com/video/?d=203199


Posted by Brian at 2/27/2008 04:20:00 PM


More Mixed Messages
SPY and IWM are battling at the DECLINING 50 Day MA
SPY and IWM are holding above RISING 5 DMA

If the Qs break 44.50 it could lead to a short term squeeze driven rally

I'm going slow here, too much uncertainty.


Posted by Brian at 2/27/2008 12:06:00 PM


Coinstar Inc . (CSTR)
is the stock on WALLSTRIP today.


Posted by Brian at 2/27/2008 07:10:00 AM


Tuesday, February 26, 2008Stock Market Closing Numbers
No video tonight.


Posted by Brian at 2/26/2008 10:04:00 PM


Current Market Mood


Posted by Brian at 2/26/2008 10:30:00 AM


Newer Posts Older Posts Home
金币:
奖励:
热心:
注册时间:
2006-7-3

回复 使用道具 举报

 楼主| 发表于 2009-3-25 06:56 | 显示全部楼层
Guilty Until Proven Innocent


Don't forget stops. Complacency is the enemy.

Posted by Brian at 2/22/2008 10:42:00 AM


The Noose is Tightening


The development of the triangle patterns I have been mentioning in the videos since last week, are getting closer to their completion. Triangle patterns are considered "continuation patterns" which means they are typically resolved in the direction of the primary trend, which is obviously lower. The patterns are usually broken when they have reached 60-80% of the way to the apex of the formation. A price objective is established by subtracting the height of the pattern (approximately 46.00-42.50 = 3.50) from the break down level (near 43.00, 43.00-3.50 = 39.50). As with all technical patterns, they give us an idea of a potential market scenario and should not be traded blindly, have your stops in place on all trades. Defense wins the game!

Posted by Brian at 2/21/2008 01:18:00 PM


Newer Posts Older Posts Home


A Breakout Is To All Time Highs
is getting closer for THIS STOCK

Posted by Brian at 2/20/2008 01:18:00 PM


Posted by Brian at 2/20/2008 12:51:00 PM


Volatility continued after the close as strong earnings from HPQ motivated futures buyers, let's see if this strength can be built on tomorrow. BTW, the HPQ strength brings the stock very close to the declining 50 DMA at 46.70


I don't know what Youtube's problem is, the video works for a while then it doesn't.
you can try iTunes


GOLD


Newer Posts Older Posts Home
金币:
奖励:
热心:
注册时间:
2006-7-3

回复 使用道具 举报

 楼主| 发表于 2009-3-25 06:59 | 显示全部楼层
Market Vector Russia ETF (RSX)
is the Exchange Traded Fund Julie discusses on today's WALLSTRIP

The stock is stuck below a declining 50 day moving average and below prior support near 48.00.


Posted by Brian at 2/13/2008 08:33:00 AM


Tuesday, February 12, 2008Stock Market Technical Analysis Video 2/12/08


Posted by Brian at 2/12/2008 04:18:00 PM


Proshares SP 500 (SDS) Trade
I took this trade about 30 minutes after closing out the trade in the video below. The second mouse gets the cheese!


Qs Battle at Resistance
The volume on this mornings strength isn't very impressive which, combined with a declining 5 dma, makes it seem unlikely the market will be able to overcome the 43.65-43.75 supply.


Posted by Brian at 2/08/2008 11:21:00 AM


Breakdown On the Way?
What holds it up here?


Posted by Brian at 2/06/2008 01:39:00 PM
金币:
奖励:
热心:
注册时间:
2006-7-3

回复 使用道具 举报

 楼主| 发表于 2009-3-25 07:02 | 显示全部楼层
Thursday, January 31, 2008It Would Be
quite an accomplishment if Google Inc (GOOG) is able to reverse the initial response to earnings (it closed the regular session at 564.30 and is trading near 520 right now). It continues to be a short term trading environment with all this volatility.


Posted by Brian at 1/31/2008 04:40:00 PM


Tuesday, January 29, 2008After Hours Trading
is bringing a test of the lows in Yahoo Inc (YHOO). News and surprises tend to follow the direction of the trend.


Posted by Brian at 1/29/2008 04:25:00 PM


Tuesday, January 22, 2008Earnings
from Apple Inc (AAPL) came after the close today. The stock closed the regular session at 155.64 and is trading just under 140 right now.


Posted by Brian at 1/22/2008 04:58:00 PM


Monday, January 21, 2008"Worst Selloff Since 9/11"
"Fed Emergency Cuts Expected"

those are a couple of the headlines I have read today. So how about a look at the intraday action from September of 2001 and the Fed actions during that selloff.


These charts are not meant to be a call for direction tomorrow. They are simply historical perspective of a panic situation in the markets like we are seeing unfold. Trading tomorrow will be extremely treacherous. If you cannot be flexible in your opinions and be even quicker to cut losses you should stand aside and just watch the spectacle. I am 100% cash and will be looking for aggressive trading opportunities using leveraged index products such as QID, QLD, etc. Be careful.

Posted by Brian at 1/21/2008 10:13:00 PM


Fear
On Friday, the S&P 500 Futures closed at 1325.25, this morning they are trading at 1282.50 down 42.75 points or 3.2% lower. The Nasdaq 100 Futures closed at 1849.50 and are currently trading at 1796.00 which is a loss of 53.50 points or 2.9%. This is why it does not make sense to buy in a downtrend which show no signs of bottoming. Rest up for Tuesday, it looks like it will be a busy day.


The 1 minute charts of the ES and NQ show the extent of selling.


Posted by Brian at 1/21/2008 09:57:00 AM


Newer Posts Older Posts Home
金币:
奖励:
热心:
注册时间:
2006-7-3

回复 使用道具 举报

 楼主| 发表于 2009-3-25 07:03 | 显示全部楼层
Tuesday, January 22, 2008Earnings
from Apple Inc (AAPL) came after the close today. The stock closed the regular session at 155.64 and is trading just under 140 right now.


Posted by Brian at 1/22/2008 04:58:00 PM


Monday, January 21, 2008
"Worst Selloff Since 9/11"
"Fed Emergency Cuts Expected"

those are a couple of the headlines I have read today. So how about a look at the intraday action from September of 2001 and the Fed actions during that selloff.


These charts are not meant to be a call for direction tomorrow. They are simply historical perspective of a panic situation in the markets like we are seeing unfold. Trading tomorrow will be extremely treacherous. If you cannot be flexible in your opinions and be even quicker to cut losses you should stand aside and just watch the spectacle. I am 100% cash and will be looking for aggressive trading opportunities using leveraged index products such as QID, QLD, etc. Be careful.

Posted by Brian at 1/21/2008 10:13:00 PM


Fear
On Friday, the S&P 500 Futures closed at 1325.25, this morning they are trading at 1282.50 down 42.75 points or 3.2% lower. The Nasdaq 100 Futures closed at 1849.50 and are currently trading at 1796.00 which is a loss of 53.50 points or 2.9%. This is why it does not make sense to buy in a downtrend which show no signs of bottoming. Rest up for Tuesday, it looks like it will be a busy day.


The 1 minute charts of the ES and NQ show the extent of selling.


Posted by Brian at 1/21/2008 09:57:00 AM


Newer Posts Older Posts Home
金币:
奖励:
热心:
注册时间:
2006-7-3

回复 使用道具 举报

 楼主| 发表于 2009-3-25 07:03 | 显示全部楼层
Tuesday, January 22, 2008
from Apple Inc (AAPL) came after the close today. The stock closed the regular session at 155.64 and is trading just under 140 right now.


those are a couple of the headlines I have read today. So how about a look at the intraday action from September of 2001 and the Fed actions during that selloff.


These charts are not meant to be a call for direction tomorrow. They are simply historical perspective of a panic situation in the markets like we are seeing unfold. Trading tomorrow will be extremely treacherous. If you cannot be flexible in your opinions and be even quicker to cut losses you should stand aside and just watch the spectacle. I am 100% cash and will be looking for aggressive trading opportunities using leveraged index


The 1 minute charts of the ES and NQ show the extent of selling.


Posted by Brian at 1/21/2008 09:57:00 AM


Newer Posts Older Posts Home
金币:
奖励:
热心:
注册时间:
2006-7-3

回复 使用道具 举报

 楼主| 发表于 2009-3-25 07:04 | 显示全部楼层
金币:
奖励:
热心:
注册时间:
2006-7-3

回复 使用道具 举报

 楼主| 发表于 2009-3-25 07:05 | 显示全部楼层
Tuesday, January 22, 2008Earnings
from Apple Inc (AAPL) came after the close today. The stock closed the regular session at 155.64 and is trading just under 140 right now.


Posted by Brian at 1/22/2008 04:58:00 PM


Stock Market Video Technical Analysis 1/22/08


Posted by Brian at 1/22/2008 04:15:00 PM


Class This Friday
I will be conducting an online class this Friday, January 25. The subject will be understanding market structure on multiple timefames. It is based on how I view the markets and includes specific entry and exit strategies with an emphasis on understanding and anticipating market psychology.


You can find more information and SIGNUP HERE. The class size will be limited to the first ten registrants.

Type "class feedback" in the search function above the Alpha Trends header to view previous atendees comments about the class.

Posted by Brian at 1/22/2008 01:31:00 PM


Monday, January 21, 2008"Worst Selloff Since 9/11"
"Fed Emergency Cuts Expected"

those are a couple of the headlines I have read today. So how about a look at the intraday action from September of 2001 and the Fed actions during that selloff.


These charts are not meant to be a call for direction tomorrow. They are simply historical perspective of a panic situation in the markets like we are seeing unfold. Trading tomorrow will be extremely treacherous. If you cannot be flexible in your opinions and be even quicker to cut losses you should stand aside and just watch the spectacle. I am 100% cash and will be looking for aggressive trading opportunities using leveraged index products such as QID, QLD, etc. Be careful.

Posted by Brian at 1/21/2008 10:13:00 PM


金币:
奖励:
热心:
注册时间:
2006-7-3

回复 使用道具 举报

 楼主| 发表于 2009-3-25 07:05 | 显示全部楼层
金币:
奖励:
热心:
注册时间:
2006-7-3

回复 使用道具 举报

 楼主| 发表于 2009-3-25 07:06 | 显示全部楼层
金币:
奖励:
热心:
注册时间:
2006-7-3

回复 使用道具 举报

 楼主| 发表于 2009-3-25 07:06 | 显示全部楼层
Tuesday, January 22, 2008Earnings
from Apple Inc (AAPL) came after the close today. The stock closed the regular session at 155.64 and is trading just under 140 right now.


Posted by Brian at 1/22/2008 04:58:00 PM


Stock Market Video Technical Analysis 1/22/08


Posted by Brian at 1/22/2008 04:15:00 PM


Class This Friday
I will be conducting an online class this Friday, January 25. The subject will be understanding market structure on multiple timefames. It is based on how I view the markets and includes specific entry and exit strategies with an emphasis on understanding and anticipating market psychology.


class size will be limited to the first ten registrants.

Type "class feedback" in the search function above the Alpha Trends header to view previous atendees comments about the class.

Posted by Brian at 1/22/2008 01:31:00 PM


Fear
On Friday, the S&P 500 Futures closed at 1325.25, this morning they are trading at 1282.50 down 42.75 points or 3.2% lower. The Nasdaq 100 Futures closed at 1849.50 and are currently trading at 1796.00 which is a loss of 53.50 points or 2.9%. This is why it does not make sense to buy in a downtrend which show no signs of bottoming. Rest up for Tuesday, it looks like it will be a busy day.


The 1 minute charts of the ES and NQ show the extent of selling.


Posted by Brian at 1/21/2008 09:57:00 AM


Newer Posts Older Posts Home
金币:
奖励:
热心:
注册时间:
2006-7-3

回复 使用道具 举报

 楼主| 发表于 2009-3-25 07:07 | 显示全部楼层
The S&P 500
has dropped to the level where there "should be" support and this morning's action is showing some buyers....so far. The market is in a downtrend and any bounces which materialize from here should viewed suspiciously. Some of the sharpest rallies occur in downtrends as shorts cover and sidelined cash gets sucked in, but markets take TIME TO HEAL after this much technical damage has been done.


Posted by Brian at 1/18/2008 09:20:00 AM


Silicon Alley Insider
is "digital business, live from New York", the managing editor Peter Kafka, sits down with Julie on today's WALLSTRIP

Posted by Brian at 1/18/2008 06:56:00 AM


Thursday, January 17, 2008Stock Market Video Technical Analysis Review 1/17/08


Posted by Brian at 1/17/2008 03:29:00 PM


Longer Term SPY Chart


Posted by Brian at 1/17/2008 12:47:00 PM


Julie Does Her
man on the street interview on is the company on WALLSTRIP to find out who New Yorkers think will be our next President.

Posted by Brian at 1/17/2008 08:28:00 AM


Wednesday, January 16, 2008Stock Market Video Technical Analysis Review 1/16/08


Posted by Brian at 1/16/2008 03:58:00 PM


Key Level in Qs


Posted by Brian at 1/16/2008 01:28:00 PM


New Oriental Education (EDU)
is the company on WALLSTRIP today.

The company reported earnings yesterday and the stock sold off hard. I would stay away from this one.


Posted by Brian at 1/16/2008 07:17:00 AM


Newer Posts Older Posts Home
金币:
奖励:
热心:
注册时间:
2006-7-3

回复 使用道具 举报

 楼主| 发表于 2009-3-25 07:08 | 显示全部楼层
Tuesday, January 15, 2008News & Surprises
tend to follow the direction of the trend. Intel (INTC) is trading more than 3 points lower in after hours.


Posted by Brian at 1/15/2008 04:31:00 PM


Newer Posts Older Posts Home
金币:
奖励:
热心:
注册时间:
2006-7-3

回复 使用道具 举报

 楼主| 发表于 2009-3-25 07:09 | 显示全部楼层
It's Early
to call for inverted head and shoulder patterns but they could be developing on the 30 minute timeframes in the SPY and QQQQ. The key resistance elvels are 142.50-142.75 and 48.50. If the market can take those levels out there could be some decent upside follow through.


Notice how the sellers showed up at the declining 5 DMA.

BTW, I like Shane's NEW SITE

Posted by Brian at 1/10/2008 01:58:00 PM


Good To See
that the market is pulling back this morning. I will be watching for long opportunities once the market has stabilized a bit. I am not interested in any of the financial/ brokerage stocks, they scare me. Those stocks are moving lower because of a fundamental problem and the magnitude of the problem is not fully understood by anyone. When trading the high risk, short term reversals, I prefer to look at the stocks with stronger fundamentals which are being dragged down because of market weakness. These stocks tend to experience stronger bounces as shorts wonder why they are short (besides momentum) Risks remain high so be careful.

Posted by Brian at 1/10/2008 09:09:00 AM


Digg
is the featured company on WALLSTRIP today.

Posted by Brian at 1/10/2008 08:30:00 AM


Wednesday, January 09, 2008Stock Market Video Technical Analysis 1/9/08


2008


Posted by Brian at 1/09/2008 04:14:00 PM


Long Here
stop under VWAP

HIGH RISK TRADE!


Posted by Brian at 1/09/2008 02:46:00 PM


Risk Management
The market seemed as though it may be able to bounce...
I traded the optios with a loss of $.13, that is what stops are for!


Posted by Brian at 1/08/2008 03:09:00 PM


The Trend
Is still lower, but I am buying Jan 49 calls FOR A TRADE


Posted by Brian at 1/08/2008 02:23:00 PM


There Goes
Capstone (CPST)


Posted by Brian at 1/08/2008 09:58:00 AM


Higher Highs
117% of average and headed for 2006 numbers.


Posted by Brian at 1/08/2008 09:06:00 AM


Newer Posts Older Posts Home
金币:
奖励:
热心:
注册时间:
2006-7-3

回复 使用道具 举报

 楼主| 发表于 2009-3-25 07:10 | 显示全部楼层
Sunday, January 06, 2008Colorado Skiing
got off to a slow start this year, but December first the mountains got pounded and the snowpack is now 103% of average.


The snow forecast for the next three days is very bullish and should add to the recent uptrend. I'm starting to jones for the slopes.


This information was taken from POWDERBUZZ

Posted by Brian at 1/06/2008 09:11:00 PM


Futures & Options Trader
Magazine for the month of January is AVAILABLE FOR DOWNLOAD

Posted by Brian at 1/06/2008 06:45:00 PM


Remember This Video?
It was originally posted at the end of November. The chart below the video is an updated look at the weekly SPY chart. The eventual downward target for this market is looking like 133-136, how fast it gets there is anyones guess. Will the Fed take action to delay this inevitable decline? Or will there be some huge unforseen bullish event which reverses this decline? Once a longer term trend takes hold they are very difficult to reverse.


Posted by Brian at 1/06/2008 10:35:00 AM


Friday, January 04, 2008Performance
Some joker has been making comments (see comment in post below from Andrew "can IWM turn here") that I am not a "real trader" and that my performance sucks and that I am a fraud. I know I shouldn't respond but I'm hoping this will shut him up. In March of 2006, I started a long only stocks under $25/share account at a firm which independantly tracks the accounts performance (for business reasons, I closed the account at the end of 2007), the Nasdaq 100 was at approximately 42 when I started trading that account and at the end of 2007 the Qs were at 52, so the market rallied approximately 23%. The account I traded at this firm was a small one ($30,000) and the NET profit during that time was $16,435.64 or approximately 55%. I placed 435 trades in that account and made money on 210 of them, that's right...I lost money more often than I made it in that account but still more than doubled the strongest market benchmark. If that sucks then I am guilty. This clown also mentions a futures account I traded there briefly. I lost approximately $1,400 on a $15,000 account in a month of trading futures and prudently closed the account after realizing that futures do not suit my style.

I trade several other larger accounts and the performance of those accounts is no ones business. If you read my blog because you expect me to be right all the time then stop reading. If you want to criticize me I do not mind, just do it like a man and stop hiding behind bogus login names. I find it funny that this person hangs on my every word and then tells me I suck...quit reading dude!


Posted by Brian at 1/04/2008 04:28:00 PM


Stock Market Technical Analysis 1/4/08 Review
Always be prepared for anything. The warning signs have been present and it took a fundamental catalyst for the market to crack hard, now there is major damage done to this market and it is difficult to see what can turn it around for more than a short term bounce.


Posted by Brian at 1/04/2008 03:46:00 PM


Posted by Brian at 1/04/2008 02:15:00 PM


Can IWM Turn Here?
Very risky if considering for a long trade.


Posted by Brian at 1/04/2008 11:40:00 AM


NO Evidence
of any buying yet, the markets remain in a downtrend below the declining VWAP


Posted by Brian at 1/04/2008 10:53:00 AM


Russell 2000 (IWM)
is trading right at the key 73.00 level. Be careful.


Posted by Brian at 1/04/2008 09:05:00 AM


Newer Posts Older Posts Home
金币:
奖励:
热心:
注册时间:
2006-7-3

回复 使用道具 举报

 楼主| 发表于 2009-3-25 07:11 | 显示全部楼层
TXCO Resources Inc. (Public, NASDAQ:TXCO)
Looks like it could get going here, particularly if it moves above 12.80 I bought a little anticipating such a move and will take a small loss if it drops below 12.55.


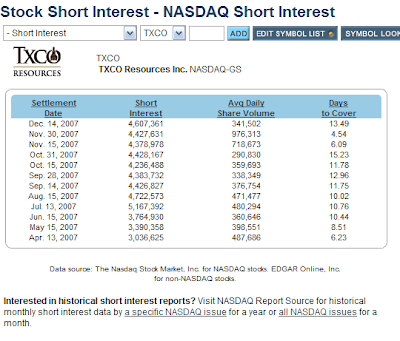
TXCO Resources Inc., formerly The Exploration Company of Delaware, Inc., is engaged in the exploration, exploitation, development, production and acquisition of onshore domestic oil and gas reserves. The Company's oil and gas enterprise interests are located in the Maverick Basin in Southwest Texas, and the Marfa Basin of West Texas. The Company's principal products are crude oil and natural gas. Generally, the Company sells all of its oil and gas under short-term contracts that can be terminated with 30 days notice, or less. The Company operates and directs the drilling of oil and gas wells and also participates in non-operated wells. As operator, the Company contracts service companies, such as drilling contractors, cementing contractors, for specific tasks. In some non-operated wells, the Company participates as an overriding royalty interest owner. In April 2007, the Company completed the acquisition of Output Exploration LLC, a privately held exploration and production firm

Posted by Brian at 1/03/2008 01:48:00 PM


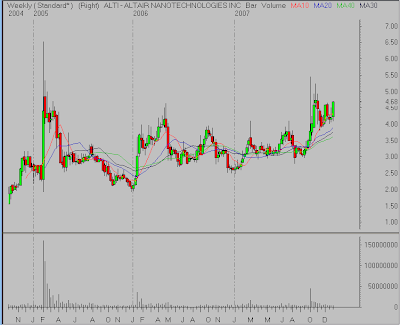
Altair Nanotech (ALTI)
Six million shares short in a stock with a chart like this? I'm long **UPDATE*** Stop at 4.58


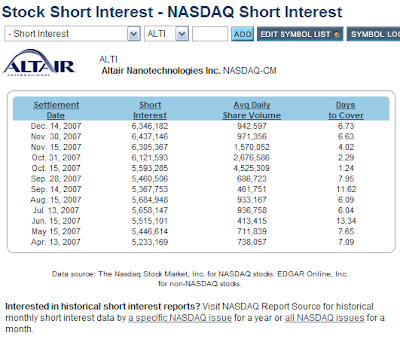
Posted by Brian at 1/03/2008 12:18:00 PM


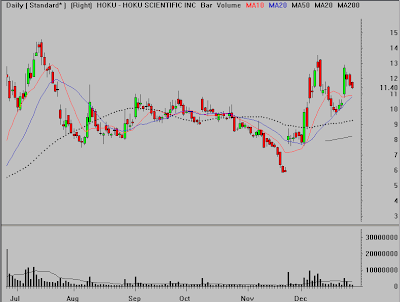
Wednesday, January 02, 2008Solar Stocks
are getting pre market action again today as AKNS is the lastset one to soar. I still like HOKU here.


Clever "mashup" on WALLSTRIP today.

Posted by Brian at 1/02/2008 08:43:00 AM


Tuesday, January 01, 2008


Posted by Brian at 1/01/2008 06:56:00 AM


Monday, December 31, 2007Happy New Year!!


these numbers will likely be adjusted to reperesent the actual settlement figures.

Posted by Brian at 12/31/2007 04:03:00 PM
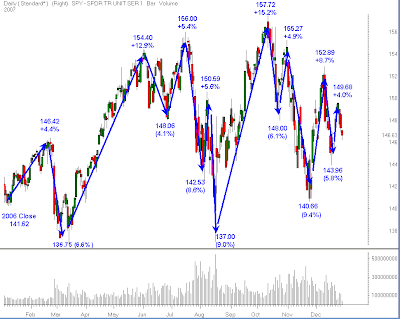


No Predictions
Making trading profits is not about forcing your opinion on the market, but to listen objectively to the message of the market in order to uncover and exploit low risk, high potential opportunities as they are presented. I do not have a grand theme for 2008, to me a guess as to where the market will finish one year from today is irrelevent. My goal each day is to seek out the low risk opportunities and cut losses quickly if the market does not agree with my analysis, or ride the winner for the bulk of the short term move. Is anyone who predicted the SPY would be up 4% in 2007 actually claiming they were smart? There were at least fifteen occasions where the market showed a rally or decline of at least 4% in 2007. The volatility rewarded disciplined traders the most this year and next year is anyones guess again. I choose to focus on finding the trades where I can make money and that will be my game plan for 2008. It is the same approach which has served me well for the last fifteen years of trading. I hope that 2008 is a great year for you in everything that is important to you, not just your trading success.


Posted by Brian at 12/31/2007 12:23:00 PM


Since Coming Public
four days ago, NetSuite Inc.(NYSE:N) had an excellent run. Now the stock is experiencing a little profit taking and the best level of support for the stock appears to be near 32.75-33.25 which is the location of the 61.8% retracement level of the rally. That level is also where the Volume Weighted Average Price (VWAP) is found, meaning that it is the average price paid for the stock in the after market. With little else to base an analysis on, the combination of these price and volume based indicators suggest we look for the stock to find support in that area.


Posted by Brian at 12/27/2007 09:20:00 AM


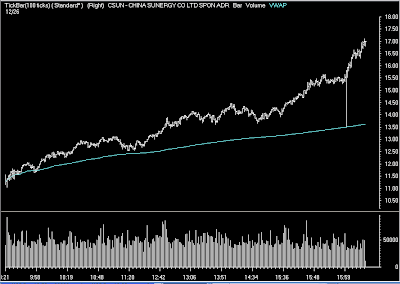
Wednesday, December 26, 2007CSUN
is getting a little more after hours action. Can't feel too good to be short there.


Posted by Brian at 12/26/2007 06:24:00 PM


Newer Posts Older Posts Home
金币:
奖励:
热心:
注册时间:
2006-7-3

回复 使用道具 举报

 楼主| 发表于 2009-3-25 08:06 | 显示全部楼层
A Bullish Scenario
may be setting up in the S&P 500 (SPY), the key words here are "may be". I still believe that the daily picture is still a mess, which favors shorter term trades, but we always have to be aware of all potential scenarios. One potentially bullish outcome would be for the SPY to make a run for trendline resistance near 152, back off to about 150 and then to blast through the 152 level to complete an inverted head and shoulders pattern. If such a move were to unfold, it would imply an upward target near 165 which would be all time highs again.


Posted by Brian at 12/26/2007 08:32:00 AM


On Tuesday
I wrote "Inverted H&S Forming on the 10 minute Qs and other markets, but with the 5 dma still declining I would be careful on the long side. Call options seem like a good idea if you are bullish here for a trade, it limits the downside." It was a small postion for me, but I bot the December 50s, now I'm out.


Posted by Brian at 12/21/2007 09:56:00 AM


Newer Posts Older Posts Home


Impressive Response
to earnings for Research in Motion (RIMM) Tomorrow the stock will open significantly above today's regular session close, but as you can see from the chart, there really is no "gap", the stock traded at every level up.


Qs Finding A Bid


But the 5 DMA is still declining.


Posted by Brian at 12/19/2007 02:14:00 PM


Newer Posts Older Posts Home
金币:
奖励:
热心:
注册时间:
2006-7-3

回复 使用道具 举报

 楼主| 发表于 2009-3-25 08:07 | 显示全部楼层
Inverted H&S Forming On
the 10 minute Qs and other markets, but with the 5 dma still declining I would be careful on the long side. Call options seem like a good idea if you are bullish here for a trade, it limits the downside.


Posted by Brian at 12/18/2007 03:36:00 PM


Not Today
The buyers have regained control of the trend for the day and after the severity of the recent selling a further bounce would not come as a surprise. Remember that long trades are still high risk and should be treated as trades only.


Posted by Brian at 12/18/2007 01:35:00 PM


Qs Headed for The 200DMA?
maybe not today, but it looks like it will eventually get to that widely watched technical level.


Posted by Brian at 12/18/2007 12:17:00 PM


Sigma-Aldrich Corp (SIAL)
is the company on WALLSTRIP this morning.

Here's a video look at the stock


Posted by Brian at 12/18/2007 08:45:00 AM


Monday, December 17, 2007Stock Market Video Technical Review 12/17/07


Posted by Brian at 12/17/2007 04:14:00 PM


Santa Rally?


Posted by Brian at 12/17/2007 01:55:00 PM


Facebook
is the company on WALLSTRIP this morning. I recently joined facebook and I relly don't understand the appeal. I suppose it is good for getting in touch with an old friend but otherwise I find it distracting.

Can bullish seasonal biases prevent further selling this week?

Posted by Brian at 12/17/2007 07:59:00 AM


Newer Posts Older Posts Home
金币:
奖励:
热心:
注册时间:
2006-7-3

回复 使用道具 举报

您需要登录后才可以回帖 登录 | 立即注册

本版积分规则

本站声明:MACD仅提供交流平台,请交流人员遵守法律法规。
值班电话:18209240771   微信:35550268

举报|意见反馈|手机版|MACD俱乐部

GMT+8, 2025-7-23 12:32 , Processed in 0.053978 second(s), 9 queries , MemCached On.

Powered by Discuz! X3.4

© 2001-2017 Comsenz Inc.

快速回复 返回顶部 返回列表