- 金币:
-
- 奖励:
-
- 热心:
-
- 注册时间:
- 2006-7-3
|
|

楼主 |
发表于 2009-3-25 16:18
|
显示全部楼层
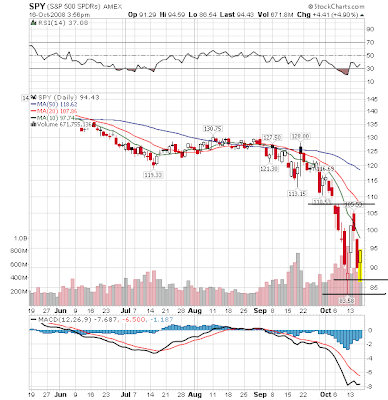
Wednesday, October 22, 2008Today's Markets
Despite the large move today (SPYs down 5.61%), we're still within my range which is roughly 90-108. However, the overall tenor of the chart is still negative -- all the SMAs are moving lower, the shorter SMAs are below the longer SMAs and prices are still below all the SMAs.
Both Trader Mike and Afraid to Trade are looking at the SPYs as a triangle consolidation pattern. I don't disagree with this read. The chart above demonstrates a triangle is very clear.
However, given the high volatility of the market right now along with the wide-open nature of the economy and overall situation, I'm more comfortable looking at this solely from a trading range pattern. I'm also more concerned with the chart's lows. I still think 90 is the most important low -- if we move through that level I don't think the lower points near 84 are nearly as strong. That means the market really needs to hold at the 90 level.
Posted by bonddad at 10/22/2008 04:22:00 PM
0 comments Links to this post 
In the "Very Responsible For This Current Mess" Department...
From Bloomberg:
Former executives from Standard & Poor's and Moody's Investors Service told lawmakers today that credit raters relied on outdated models in a ``race to the bottom'' to maximize profits.
Jerome Fons, a former managing director of credit policy at New York-based Moody's, told the House Oversight and Government Reform Committee today that originators of structured securities ``typically chose the agency with the lowest standards, engendering a race to the bottom in terms of rating quality.''
Representative Henry Waxman, the committee chairman, said that the recent history of the credit rating companies ``is a story of colossal failure.'' ``The result is that our entire financial system is now at risk,'' Waxman said.
The House panel is reviewing the role played by S&P, Moody's, and Fitch Ratings in the global credit freeze. The Securities and Exchange Commission in a July report found the firms improperly managed conflicts of interest and violated internal procedures in granting top rankings to mortgage bonds.
The top executives of the credit-rating companies said in written testimony that they were unprepared for the sharp drop in home prices and that their systems failed.
``Events have demonstrated that the historical data we used and the assumptions we made significantly underestimated the severity of what has actually occurred,'' said Devan Sharma, president of New York-based S&P.
And there's more from a different article:
Employees at Moody's Investors Service told executives that issuing dubious creditworthy ratings to mortgage-backed securities made it appear they were incompetent or ``sold our soul to the devil for revenue,'' according to e-mails obtained by U.S. House investigators.
The e-mail was one of several documents made public today at a hearing of the House Oversight and Government Reform Committee in Washington, which is reviewing the role played by Moody's, Standard & Poor's and Fitch Ratings in the global credit freeze.
I place a great deal of the blame for the current mess at the feet of the ratings agencies. They gave crap paper great ratings thereby insuring the largest number of investors would buy the paper. That's one of the primary reasons for the current mess: so long as bonds had an "investment grade" rating everyone was happy. And the testimony above indicates the people/companies seeking a rating knew how to game the system.
If the paper had been properly rated only more speculative investors would have purchased it, thereby limiting the number of people who were exposed to credit issues to people who knew what they were doing (or at least had a better possibility of knowing the real risks they were getting).
Posted by bonddad at 10/22/2008 01:30:00 PM
2 comments Links to this post
A New Addition -- The Donation Button
You will note the addition of a donation button on the right side of the blog. These are entirely voluntary; I will keep blogging no matter what. But, hey, a few extra bucks would be nice if you can afford it and you think the analysis is worth it.
Posted by bonddad at 10/22/2008 12:15:00 PM
3 comments Links to this post
We're Nowhere Near A Bottom in Housing
From CNBC:
About 12 million U.S. homeowners owe more than their homes are worth, compared with 6.6 million at the end of last year and slightly more than 3 million at the close of 2006, said Mark Zandi, chief economist at Moody's Economy.com.
Will this end anytime soon? Not likely. The following charts are from Calculated Risk. Click on the image for a larger image.
Inventories are still sky in in absolute numbers:
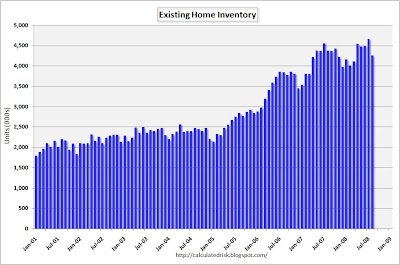
And in months of available supply:
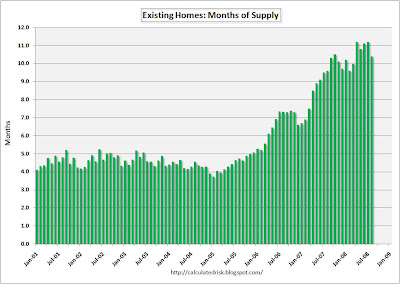
As a result, prices are dropping like a stone:
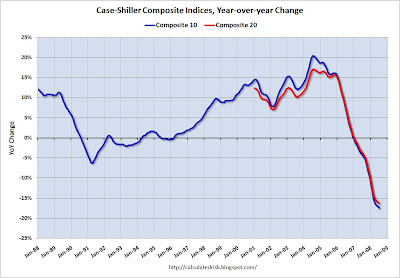
Now ask yourself this question: are people going to buy more or fewer homes right now? The job market has been tanking all year (and has been dropping year over year for far longer):
And unemployment has been rising:
Oh yeah -- the credit markets are in complete turmoil making it really hard to get a loan right now.
Posted by bonddad at 10/22/2008 10:00:00 AM
4 comments Links to this post
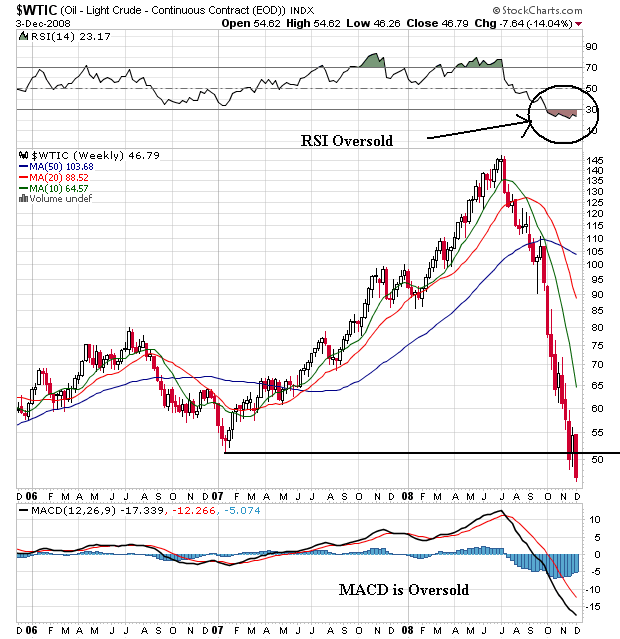
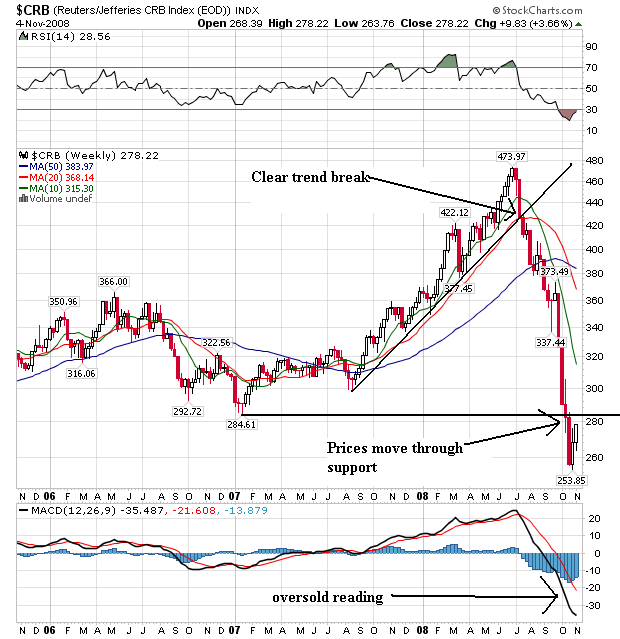
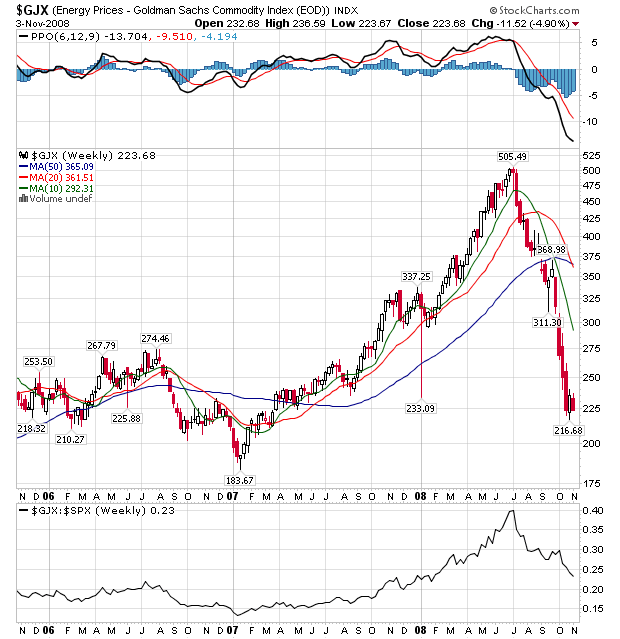
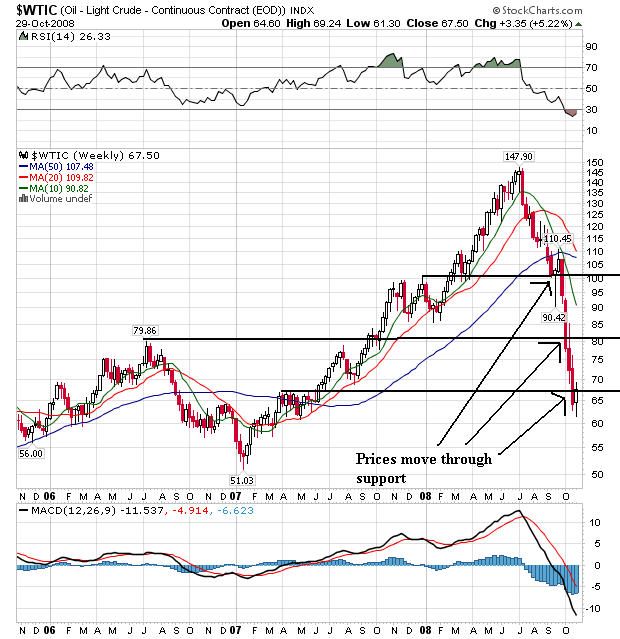
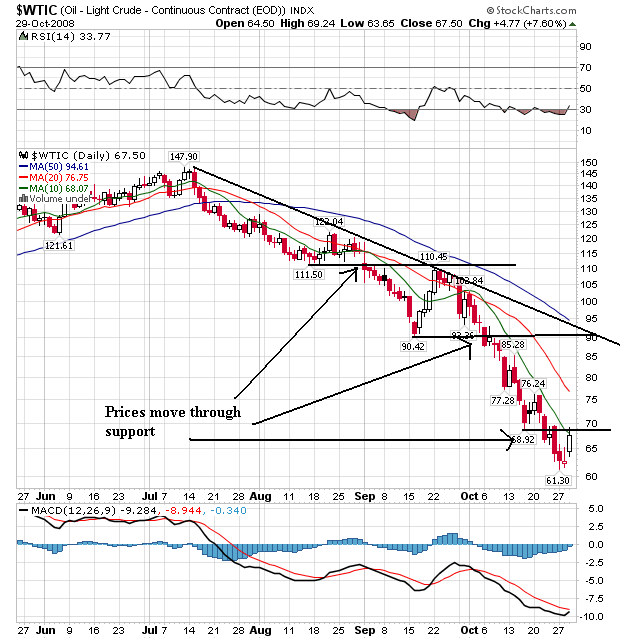
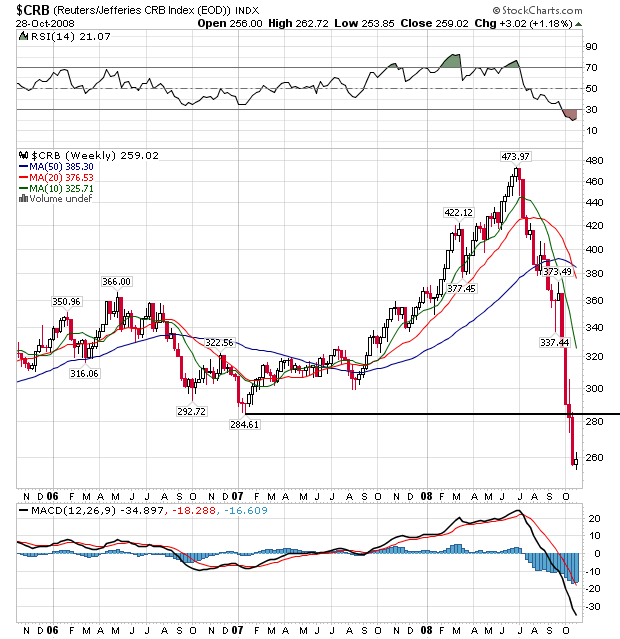
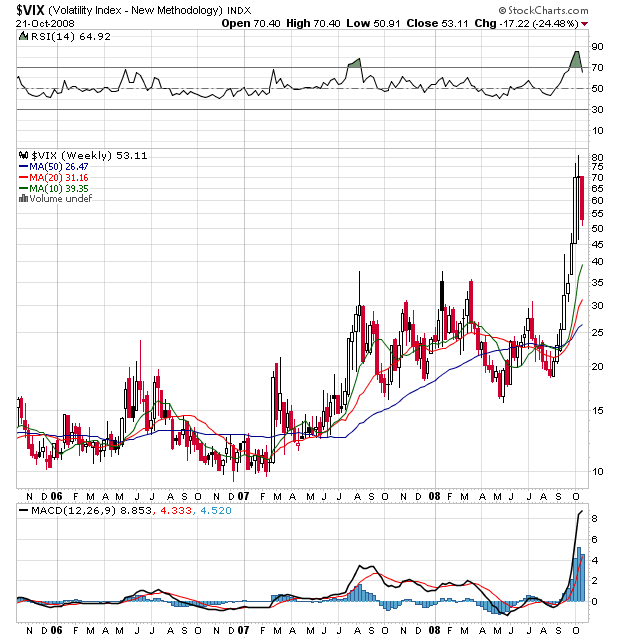
Wednesday Commodities Round-Up
Wow -- just wow. A few months ago I was extremely worried about spiking inflation levels. Now those fears have gone completely by the wayside.
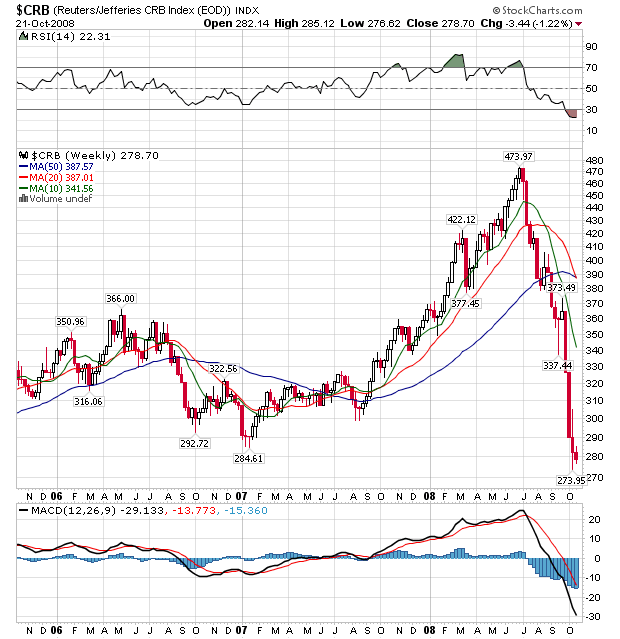
Commodity prices are now at or near their lowest levels in over three years. Also note the following:
-- Prices are below all the SMAs
-- the 20 day SMA is about to move through the 50 day SMA
-- All the SMAs are now moving lower
BUT
Note the CRB is very oversold right now.
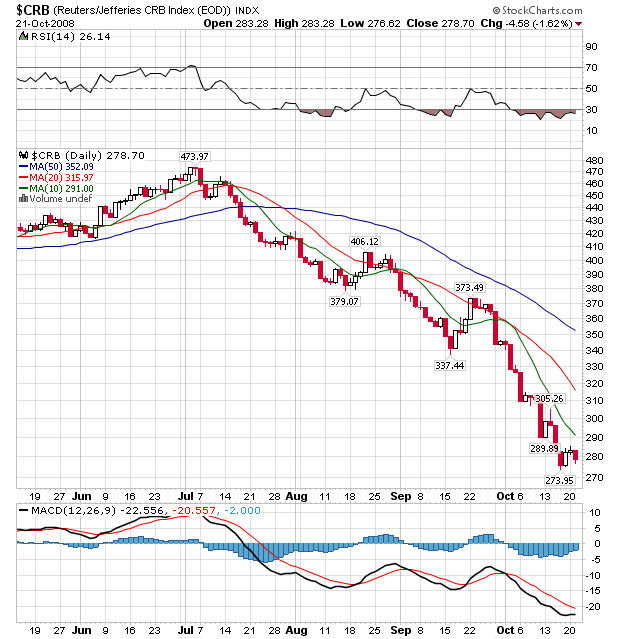
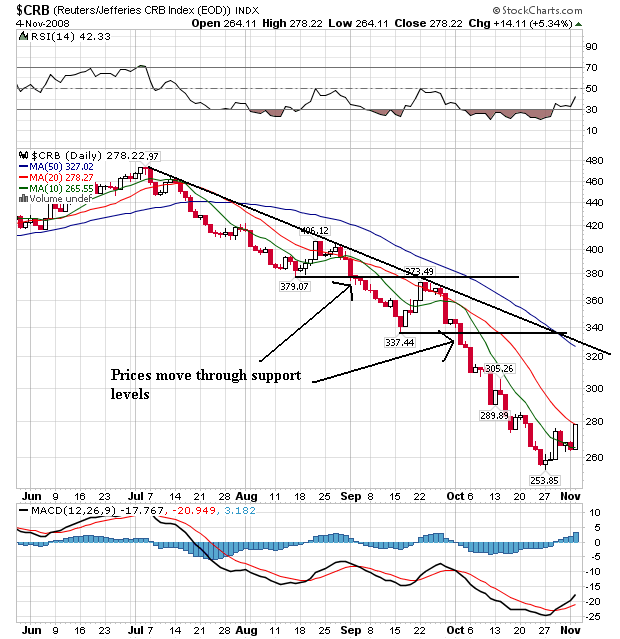
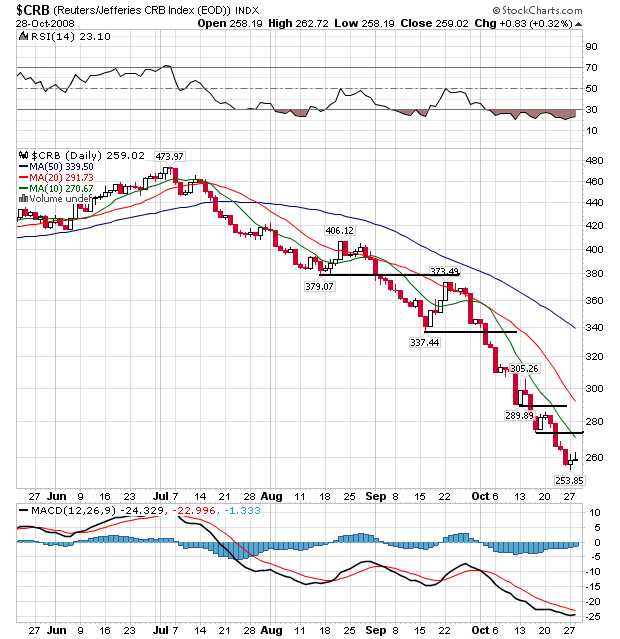
On the daily chart, notice the following:
-- Prices are below all the SMAs
-- All the SMAs are moving lower
-- The shorter SMAs are below the longer SMAs
-- Prices have been dropping for three months
This chart looks a great deal like the dollar chart from the last few years.
Bottom line: this is now a very bearish index.
Posted by bonddad at 10/22/2008 06:43:00 AM
2 comments Links to this post
Labels: commodities
Tuesday, October 21, 2008Today's Markets
Remember -- I'm looking for the market to consolidate between (roughly) 90 and 108. While that is still a wide range (roughly 20%) it makes sense given the high level of volatility:
Bottom line: so long as we're between those two levels I'm still thinking we're consolidating from a massive sell-off.
Posted by bonddad at 10/21/2008 03:15:00 PM
1 comments Links to this post
Corporate Earnings Looking Poor
From FT:
The technology sector led the declines, down 3.8 per cent overall. Texas Instruments fell 7.7 per cent to $16.60 after the technology company disclosed worse-than-expected results after the bell on Monday.
Sun Microsystems and Logitech sustained some of the heaviest losses, down 14 per cent to $4.97 and 14.5 per cent to $15.63, respectively, after their updates both indicated a downbeat outlook.
.....
AK Steel retreated 3.3 per cent to $14.61 after the group said prices would be down about 10 per cent towards the end of the year while DuPont lost 2.8 per cent to $35.20 after the chemicals company cut its full-year forecast.
Lockheed Martin fell 3.2 per cent to $90.20 after the defence group reduced its guidance for next year on concerns of reduced military spending by the next administration.
.....
Fifth Third, which said it may ask to be included in the Treasury’s plan to buy stakes in U.S. banks, fell 11 per cent to $10.88 on the back of poorly received results.
Regions Financial lost 2.7 per cent to $11.90 after its earnings from continuing operations fell 76 percent in the third quarter, which was below analyst forecasts.
National City, hurt by increased mortgage reserves and losses from construction loans, fell 5.5 per cent to $3.08 after posting its fifth straight quarterly loss.
Keycorp, also dented by an increase in reserves for bad loans, added 8.8 per cent to $10.63 after posting its second straight quarterly loss.
If we just take out all the financial companies, we can see the problems are contained ... nevermind.
Posted by bonddad at 10/21/2008 01:00:00 PM
0 comments Links to this post
Getting Out Of The Recession
A few months ago I wrote an article titled Yes It's a Recession, No It Won't End Soon. I used the NBER's more in-depth recession determining formula and concluded we are currently in a recession. In addition, I added it would take awhile to get out of it. Several other people have commented on the recession. They have made the following observations:
Henry Blodget is arguing for a long recession because consumers are currently heavily in debt and they need to get out from under all the debt before they can start spending again:
Unfortunately, at risk of invoking the four most expensive words in the English language, "this time it's different."
Why?
Because the US consumer is finally broke. For thirty years, we piled on debt and then spent almost every new penny we got. This borrowing spree was made possible by a smorgasbord of no-money-down lending products and ever-appreciating asset prices. Unfortunately, the situation has now changed. The lenders who created those products have now been demolished, and asset prices are falling fast. And this is leaving American consumers with no choice but to cut back.
A few exhibits:
US debt has risen from 163% of GDP in 1980 to 346% in 2007. Household debt, a subset of this, has risen from 50% of GDP to 100%. (Please click here if you would like to see charts that illustrate the points I'm making here)
Mish is arguing for The Age of Frugality:
The US has been on a consumption binge of epic proportions all on the misguided belief that real estate prices would keep on rising forever, at a clip of 8% or more a year. No one ever bothered to do the math as to how anyone could possibly afford to pay the projected prices. Real wages were shrinking but somehow everyone could get rich selling houses to each other.
The "Housing Prices Always Go Up" dream has finally crashed on the rocks of reality. However, while the party was still going on, consumers were willing to go deeper and deeper in debt, buying new kitchens, taking expensive vacations, buying boats, buying SUVs "needed" to haul all the junk around they were buying, etc. And as long as home prices kept rising, everyone ignored the debt side of the balance sheet.
Now, the party has ended, and asset prices are crashing but the debt still remains. Consumers are now very concerned (finally), about the debt side of the balance sheet. It is going to take an amazing shift from consumption to savings to pay down that debt. And a secular shift from consumption to saving is now underway. "Cool To Be Frugal" is actually an understatement.
Businessweek had noticed this trend as well:
....People who overconsumed during the past decade are now rejecting extravagant lifestyles. They're spending less, and more wisely. Some are getting their finances in order. Others are fearful of losing their jobs, shocked by investment losses, or hunkering down amid the general uncertainty.
The penny-pinching is already showing up in the numbers; this quarter could mark the first fall in personal consumption in 17 years. And with credit tight and Americans loaded down with $2.6 trillion in personal debt, consumer borrowing dropped in August, the first such contraction since 1991. Menzie D. Chinn, who teaches economics at the University of Wisconsin, figures consumers won't be in a position to spend freely for five years.
Which brings us to what John Maynard Keynes called the paradox of thrift. What's good for the individual, argued the famous economist, can ignite or deepen a recession. But that won't deter the newly thrifty. "I can't help the economy," says Kim Schultz, a resident of hard-hit Avoca, Mich., who with her husband, Jon, owes $40,000 in credit-card debt. "I've got to help myself." On the other hand, this newfound austerity could—emphasis on could—rewire Americans as savers rather than spenders. And that would help put the economy on a sounder footing over the long haul.
I am hardly the only person commenting on the economy who noticed the mammoth amount of household debt reported in the Federal Reserve's Flow of Funds Report. Here's the essential problem. The US savings rate (which is gross income less all possible payments) was about 2% at the beginning of this expansion. According to the Census Bureau real median household income has been stagnant for this expansion. Yet consumer spending has increased. So where did all the new spending money come from? Debt.
So, the question now becomes this:
How will the US economy grow when
1.) 70% of its growth is based on consumer spending, yet
2.) The US consumer is more focused on paying down debt then spending money?
The simple answer is the US consumer must start to see income increases -- something he hasn't seen for over eight years. That's going to take jobs. And it's going to require a combination of two events.
First, the quality of jobs has to increase. That means we have to create high paying jobs which our workforce can perform.
Secondly, we have to create enough jobs to create a labor shortage which will drive-up wages.
However, even if we accomplish these things there is no guarantee people will start spending on things again. Instead they may use the new income to pay down debt. That means Us GDP growth will have to come a bit more from selling things to other countries than buying stuff from them. That means we have to be more export driven -- we need products we can sell to other people in large enough quantities to influence our GDP positively.
Posted by bonddad at 10/21/2008 10:00:00 AM
3 comments Links to this post
Treasury Tuesdays
On the yearly chart, notice we have a possible double top forming. The first occurred at the beginning of the second quarter of 2008 and the second occurred at the end of the third quarter of 2008.
Also note the market has had the following moves. A rally that ended in late March 2008 which was caused by the credit crisis. A sell-off that was caused by a stock market rally which ended in late June 2008. A rally that lasted from late June to late September that was caused by a credit crisis which lasted from late June to late September and finally a sell-off that is caused by the mammoth amount of debt the US government is issuing for the bail-out. On that note, let's go to the three month chart:
On the daily chart, note the following:
-- The short term SMAs are bearish. Both the 10 and 20 day SMA are moving lower and have moved below the 50 day SMA
-- The 200 day SMA is still rising, indicating the long-term trend is up.
-- The 50 day SMA has a slight downward bias right now. This will probably move lower in the next few weeks as prices are below this number
-- Prices have been moving around the 200 day SMA with little indication of what long-term trend they want to take.
Bottom line: there are a lot of contradicting signals on this chart.
Posted by bonddad at 10/21/2008 06:52:00 AM
0 comments Links to this post
Labels: Treasury Market
Monday, October 20, 2008Today's Markets
Remember that I'm looking for the market to consolidate at or near current levels. The reasons are listed in today's Market Monday's Post.
Today prices moved above the 10 day SMA. However, prices are still between the 90 and 108 levels where I think they are currently consolidating. All other pieces of the technical puzzle are still bearish:
-- The SMAs are moving lower
-- The shorter SMAs are below the longer SMAs
-- Prices are still below (way below) the 200 day SMA
Posted by bonddad at 10/20/2008 04:19:00 PM
0 comments Links to this post
Federal Spending and the Deficit
From Bloomberg:
Federal Reserve Chairman Ben S. Bernanke endorsed additional fiscal stimulus, saying the credit crunch is ``hitting home'' as Americans find it harder to get loans, threatening a prolonged economic slump.
Lawmakers ``should consider including measures to help improve access to credit by consumers, homebuyers, businesses and other borrowers,'' Bernanke said in testimony to the House Budget Committee. ``Such actions might be particularly effective at promoting economic growth and job creation,'' he said, calling consideration of a stimulus ``appropriate.''
.....
House Speaker Nancy Pelosi has proposed an initiative of as much as $150 billion after the credit crunch deepened in recent months and the effect of the first stimulus package wore off.
Budget Deficit
Wisconsin Representative Paul Ryan, the budget panel's ranking Republican, said in the hearing that the Democratic plan is ``bloated'' and may balloon the budget deficit to $1 trillion. ``Throwing more money out the door may help for a quarter, but it won't help to create jobs,'' Ryan said afterward.
Bernanke, under questioning, declined to recommend a size for the package. He said the current ``large'' deficit is ``not totally inappropriate given the nature of the emergency that we're facing and not totally avoidable given the loss of tax revenues.''
Let's reiterate a few basic facts.
1.) The Federal government has been running a budget deficit of at least $500 billion dollars/year since 2003. This is based on the total amount of debt issued per year. The debt is both publicly held and intra-governmental.
2.) The total amount of debt held by foreign investors has doubled from (roughly) $1 trillion to (roughly) $2 trillion.
3.) Total US debt outstanding is about $10.2 trillion, or roughly 70% of total US GDP.
Bottom line: there's a ton of debt out there.
My main concern with this issue was the dollar's multi-year drop. However, the dollar has rallied for the last month or so. In other words, the dollar isn't an issue right now (although the dollar is still at very low levels).
My secondary concern is the inability of the US to make difficult choices. The US government has continued to spend like it has lots of money when in fact it doesn't. In addition, there are difficult choices ahead for the US, especially when it comes to entitlement spending (read medical expenses).
javascript:void(0)
However, the US economy is in desperate need of a standard Keynsean push right now -- so long as it is the right kind of push. For example, infra-structure spending would be good on several fronts. It would provide employment for displaced construction workers hurt by the housing downturn. This would help to ameliorate foreclosures and boost consumer spending a bit. It would also provide help for businesses when the economy rebounds.
I still have mixed feelings about this, although I have to admit this seems like the worst time to be fiscally prudent. But if not now, when? Fiscal responsibility is always something we'll do tomorrow.
Posted by bonddad at 10/20/2008 01:46:00 PM
1 comments Links to this post
Bonddad Bullish?
I know -- those two words would seem to never go together. But consider the following:
1.) See my market post below. Simply from a technical perspective the market has already sold-off a ton. While it can still go lower I think the majority of the technical damage has been done.
2.) We have seen unprecedented international action to thwart the credit crisis. Europe as swept in with a massive package. The US followed suit. Now there is talk of an international conference to deal with this situation. The bottom line is governments are reacting with appropriate concern and giving an appropriate response to the problem.
3.) Barry's bullish. If you thought I was bearish, well you don't know Barry. Actually, I think we were both bearish for quite some time. Barry's a big fan of contrary indicators. And he's seeing a lot of them right now.
4.) Consider the following from Warren Buffet:
THE financial world is a mess, both in the United States and abroad. Its problems, moreover, have been leaking into the general economy, and the leaks are now turning into a gusher. In the near term, unemployment will rise, business activity will falter and headlines will continue to be scary.
So ... I’ve been buying American stocks. This is my personal account I’m talking about, in which I previously owned nothing but United States government bonds. (This description leaves aside my Berkshire Hathaway holdings, which are all committed to philanthropy.) If prices keep looking attractive, my non-Berkshire net worth will soon be 100 percent in United States equities.
Why?
A simple rule dictates my buying: Be fearful when others are greedy, and be greedy when others are fearful. And most certainly, fear is now widespread, gripping even seasoned investors. To be sure, investors are right to be wary of highly leveraged entities or businesses in weak competitive positions. But fears regarding the long-term prosperity of the nation’s many sound companies make no sense. These businesses will indeed suffer earnings hiccups, as they always have. But most major companies will be setting new profit records 5, 10 and 20 years from now.
Let me be clear on one point: I can’t predict the short-term movements of the stock market. I haven’t the faintest idea as to whether stocks will be higher or lower a month — or a year — from now. What is likely, however, is that the market will move higher, perhaps substantially so, well before either sentiment or the economy turns up. So if you wait for the robins, spring will be over.
For me, the most important indicator right now is a raw, long-term chart of the SPYs. Bottom line, that looks like one hell of a buying opportunity to me right now.
Posted by bonddad at 10/20/2008 10:00:00 AM
0 comments Links to this post
Labels: market analysis
Market Mondays
I've been thinking as awful lot about market bottoms lately, largely because of the size and the magnitude of the most resent sell-off. Consider the following chart:
Note the SPYs have formed a multi-year double top. The first top occurred in 2000 and the second top occurred last year. Prices have obviously fallen since the 2007 top.
Consider that from 2003-2007 prices ran from a low of around 80 in 2003 to 155 last year. Prices are now at 93.8. In other words, most of the 2003-2007 rally is now gone. Yet corporate profits have increased since 2003, meaning overall valuations are cheap by historical standards.
On the year long chart, simply notice the market has been dropping for the last year. That's a pretty long time in market history. Another way to say this is the market has been correcting for a long enough time to shake out a lot of speculative players. In addition, note the volume increase in September and October of this year. That could be a selling climax.
On the three month chart, notice the following:
-- Prices are below all the SMAs
-- All the SMAs are moving lower
-- The shorter SMAs are below the longer SMAs
In other words, this is a classic bear market chart. However, also note that prices are moving in a wide consolidation range right now. The most extreme reading of this range would be 84-108. However, I think the real bottom would be around 90, closing the range to 18 points. I'm thinking the market is going to consolidate in this range barring another unforeseen random economic event.
Posted by bonddad at 10/20/2008 06:28:00 AM
0 comments Links to this post
Friday, October 17, 2008Weekend Weimar and Beagle
OK -- before I get to the pups I have a request. As this weekly post demonstrates I am a dog person. And I have found a dog charity that I would really like people to take notice of. It's called Baghdad Pups. It helps service men and women get dogs home who they befriend in Iraq. My wife and I call our dogs our children -- we're all very close. I can only imagine how close you would get to a dog in a war zone. And while I am against the war and have been since the beginning, my gripe is with management not the employees.
All that being said, if you've got a few bucks send it over to Baghdad Pups.
And now -- for our dogs.


Posted by bonddad at 10/17/2008 02:30:00 PM
2 comments Links to this post
Krugman on the Economy

From the NY Times:
Just this week, we learned that retail sales have fallen off a cliff, and so has industrial production. Unemployment claims are at steep-recession levels, and the Philadelphia Fed’s manufacturing index is falling at the fastest pace in almost 20 years. All signs point to an economic slump that will be nasty, brutish — and long.
How nasty? The unemployment rate is already above 6 percent (and broader measures of underemployment are in double digits). It’s now virtually certain that the unemployment rate will go above 7 percent, and quite possibly above 8 percent, making this the worst recession in a quarter-century.
And how long? It could be very long indeed.
Think about what happened in the last recession, which followed the bursting of the late-1990s technology bubble. On the surface, the policy response to that recession looks like a success story. Although there were widespread fears that the United States would experience a Japanese-style “lost decade,” that didn’t happen: the Federal Reserve was able to engineer a recovery from that recession by cutting interest rates.
But the truth is that we were looking Japanese for quite a while: the Fed had a hard time getting traction. Despite repeated interest rate cuts, which eventually brought the federal funds rate down to just 1 percent, the unemployment rate just kept on rising; it was more than two years before the job picture started to improve. And when a convincing recovery finally did come, it was only because Alan Greenspan had managed to replace the technology bubble with a housing bubble.
Now the housing bubble has burst in turn, leaving the financial landscape strewn with wreckage. Even if the ongoing efforts to rescue the banking system and unfreeze the credit markets work — and while it’s early days yet, the initial results have been disappointing — it’s hard to see housing making a comeback any time soon. And if there’s another bubble waiting to happen, it’s not obvious. So the Fed will find it even harder to get traction this time.
In other words, there’s not much Ben Bernanke can do for the economy. He can and should cut interest rates even more — but nobody expects this to do more than provide a slight economic boost.
If you look at the post below you will see all of the corresponding charts to the points Krugman makes. What is important to note is Krugman is arguing interest rate policy won't solve the problem.
Think about what happened in the last recession, which followed the bursting of the late-1990s technology bubble. On the surface, the policy response to that recession looks like a success story. Although there were widespread fears that the United States would experience a Japanese-style “lost decade,” that didn’t happen: the Federal Reserve was able to engineer a recovery from that recession by cutting interest rates.
But the truth is that we were looking Japanese for quite a while: the Fed had a hard time getting traction. Despite repeated interest rate cuts, which eventually brought the federal funds rate down to just 1 percent, the unemployment rate just kept on rising; it was more than two years before the job picture started to improve. And when a convincing recovery finally did come, it was only because Alan Greenspan had managed to replace the technology bubble with a housing bubble.
This is a very interesting idea that deserves wider discussion.
Posted by bonddad at 10/17/2008 01:30:00 PM
2 comments Links to this post
Beige Book Highlights
You know you are a total economics geek when you get excited about the Federal Reserve issuing the latest Beige Book. This is a compilation of anecdotal reports from all the Federal Reserve districts. It is released about every six weeks and is a great source of information on the economy. Let's take a look at the latest one and see what it says about various parts of the US economy.
Consumer spending was softer in nearly all Districts. Retail sales were reported to have weakened or declined in Philadelphia, Cleveland, Richmond, Atlanta, Chicago, Minneapolis, and Kansas City; Dallas and San Francisco cited weak or sluggish sales; and Boston and New York indicated that sales were mixed and moderately below plan sales, respectively. Several Districts noted a reduction in discretionary spending by consumers and lower sales on big-ticket items. Several also reported increased activity at discount stores as consumers became more price conscious and shifted purchases toward less-expensive brands.
None of this information is good especially when 70% of GDP growth comes from consumer spending. This chart shows retail sales have been slowing for awhile now:
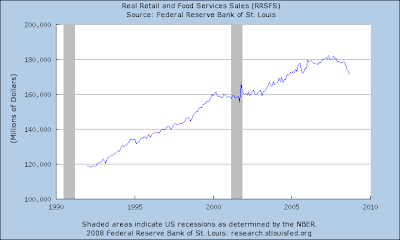
In addition, the year over year rate of change is now negative:

Also note the consumers are shopping down -- that is, more people are going to discount places to save money. While I am all for this activity it does indicate more cost cutting on the part of consumers.
Manufacturing activity moved lower in most Districts, and contacts expressed heightened concern about the economic outlook. Several Districts noted that credit conditions were contributing to a high level of uncertainty on the part of contacts. Declines in manufacturing activity of varying degrees were reported in Boston, New York, Cleveland, Richmond, Chicago, St. Louis, Kansas City, San Francisco, and Dallas. Atlanta reported that production remained at a low level, while Minneapolis described conditions as mixed and Philadelphia noted a slight increase in activity.
These numbers have been helped a great deal by the weaker dollar which has helped exports. However with Europe and Asia slowing this won't be the case for much longer.
The latest industrial production numbers were disproportionately impacted by two hurricanes and a strike at Boeing. Without these events the number would have been zero, so keep that in mind when you're looking at the chart. But, the longer-term trend is not good. We're clearly making less and less stuff right now.
In addition, we're using less of our productive capacity as well.
Residential real estate and construction activity weakened or remained low in all Districts. Housing activity was reported to have moved lower in Boston, New York, Philadelphia, Chicago, St. Louis, Minneapolis, Dallas, and San Francisco. While still slow, residential markets showed some signs of stabilizing in Cleveland, Atlanta, and Kansas City. Several Districts noted continuing downward price pressures and an increasing supply of homes for sale due to rising foreclosures. However, the inventory of unsold homes was reported to have declined in areas of the Boston and Atlanta Districts as well as in Philadelphia and Cleveland.
I have a hard time believing any real estate markets are stabilizing right now -- especially when the Federal Reserve failed to see the housing bubble forming. Bottom line, inventory is still sky high, credit is tightening and confidence is at multi-decade lows. My hope is that is a few more months we'll have an idea of when this will end. Here are some excerpts from a recent NY Times article that deserve mentioning:
One reliable proxy of housing values — the ratio of home prices to rents — indicates that in many cities prices are still too high relative to historical norms.
.....
The price-to-rent ratio, which provides one measure of how much of a premium home buyers place on owning rather than renting, spiked across the country earlier this decade.
It increased the most on the coasts and somewhat less in the middle of the country. Economy.com’s calculations show that while it remains elevated in many places, the ratio has fallen sharply to more normal levels in places like Sacramento, Dallas and Riverside, Calif.
.....
As of June, 2.8 percent of homes previously occupied by an owner were vacant. Nearly 1 in 10 rentals was without a tenant. Both numbers are near their highest levels since 1956, the earliest year for which the Census Bureau has such data.
.....
At the same time, Ms. Pestana said, her clients who are looking to buy are having a harder time lining up financing. One of her clients recently had to give up on a home after the lender that had offered a pre-approved loan changed its mind — a frequent occurrence, according to real estate agents and mortgage brokers.
“I am working harder than I have ever had to work to get a deal together and keep it together,” said Ms. Pestana, who has been a real estate agent for seven years.
The Beige Book does not have a section on employment. So I'll add the following charts:

The year over year rate of change in employment has been dropping for the last two years.

The unemployment rate has been increasing since the beginning of 2007.
Simply put, the economy is in terrible shape.
Posted by bonddad at 10/17/2008 11:30:00 AM
2 comments Links to this post
Hedge Fund Redemptions Creating Problems
From the Financial Times:
Troubles mounted for some of the world’s biggest hedge funds on Thursday as Highland Capital Management told investors it was shutting down two of its funds and details emerged of big losses at TPG-Axon.
The problems in the sector have set in motion a vicious cycle in the markets as hedge funds sell holdings to return money to worried investors, triggering further price declines and prompting more withdrawals. Investors pulled at least $43bn from hedge funds in September, according to TrimTabs Investment Research.
“Unfortunately, selling has begat selling as risk reduction and unwinding create spillover pressure on other funds with overlapping holdings,” Dinakar Singh, the founder of TPG-Axon said in a letter to investors at the end of September.
This explains some of the recent volatility in the markets. Fund X has a big holding in a particular security that has dropped. Fund X sells its holdings in that security to stop the loss and raise cash for anticipated withdrawals. This leads to further deterioration in the various stock prices leading to more investors wanting to pull money from hedge funds ... you get the idea.
Roubini has argued the next wave of problems will come from hedge fund related issues. Whether this is true or not only time will tell. But it does make sense in the current environment.
Posted by bonddad at 10/17/2008 09:30:00 AM
1 comments Links to this post
Forex Friday
John Murphy wrote a book a a while ago called "Technical Analysis of the Financial Markets." A central premise of the book is financial markets are inter-related. When one market goes up another goes down. It's hardly a revolutionary idea, but it definitely one work keeping in mind.
The following two charts of the euro and the dollar (weekly) show the inter-relationship that can exist between the two markets. As the dollar dropped over the last few years the euro rose. Simply put, traders now see the euro as a viable alternative to the dollar. Currently (as in the last few months), it's not so much that the dollar is rising as the euro is sinking. The reason is fundamental. Until the end of the summer, the ECB kept interest rates higher than those in the US. Trichet considered price stability a more important policy objective than monetary easing. However, at the end of the summer it became obvious that an easing was necessary. When Trichet announced his new policy direction the euro dropped. The dollar was the natural beneficiary of this policy. Remember -- there are no fundamental reasons to own dollars right now -- interest rates are low and the economy is in a recession.

On the euro chart, notice the following:
-- Prices have clearly broken the uptrend that started two years ago
-- The chart formed a double top in 2008 with the first top occurring at the beginning of the summer and the second top occurring at the end of the summer
-- Prices are below all the SMAs
-- The 10 and 20 week SMAs have moved through the 50 week SMA
-- The 50 week SMA is moving into neutral territory
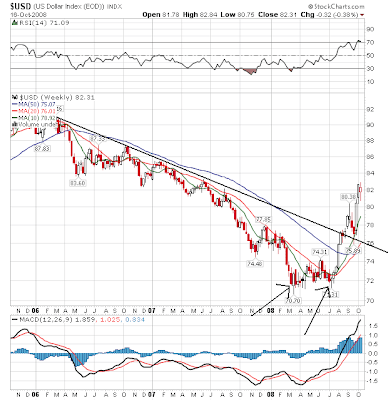
-- Prices have clearly broken the downtrend they were in for several years
-- The market formed a double bottom in 2008 with the first bottom occurring in the late Spring and the second bottom occurring in mid-late summer
-- Prices are above all the SMAs
-- The 10 and 20 week SMA has moved through the 50 week SMA
-- The 50 week SMA has turned neutral
Posted by bonddad at 10/17/2008 06:44:00 AM
0 comments Links to this post
Thursday, October 16, 2008Today's Markets
Remember -- this is still a very bearish chart.
-- Prices are below all the SMAs
-- All the SMAs are moving lower
-- The shorter SMAs are below the longer SMAs
BUT --
I drew three lines to show the points where I think the market should consolidate between. Remember, the market has dropped hard.

We're at 2002-2003 levels right now. So this is fundamentally a good place to consolidate simply from a time perspective. We're also very oversold still (and will be for a bit).
Posted by bonddad at 10/16/2008 03:15:00 PM
2 comments Links to this post
$640 Billion in Losses -- So Far
From Bloomberg:
Banks and securities firms have reported more than $640 billion in losses, writedowns and credit provisions since the start of 2007 and raised $611 billion in capital to offset those losses, according to data compiled by Bloomberg. New York-based JPMorgan, the biggest U.S. bank by assets, reported third-quarter net income yesterday of $527 million and Wells Fargo in San Francisco earned $1.64 billion.
Those are massive losses. But remember -- they're all contained to the financial sector so everything is A OK.
Posted by bonddad at 10/16/2008 11:00:00 AM
1 comments Links to this post
Newer Posts Older Posts Home |
|
|
 [复制链接]