- 金币:
-
- 奖励:
-
- 热心:
-
- 注册时间:
- 2006-7-3
|
|

楼主 |
发表于 2009-3-26 11:58
|
显示全部楼层
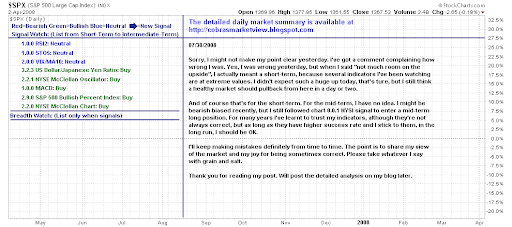
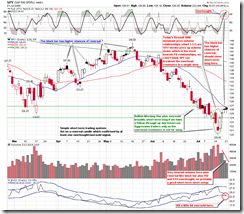
Tuesday, July 22, 200807/22/2008 Market Recap: Market Overbought
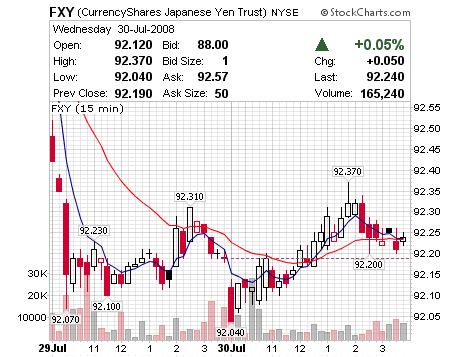
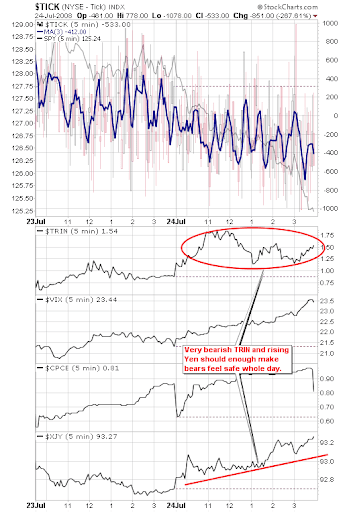
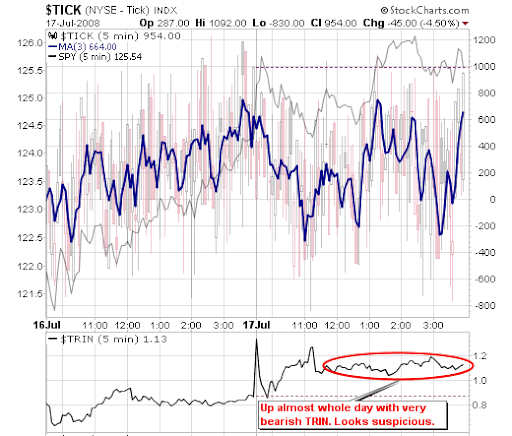
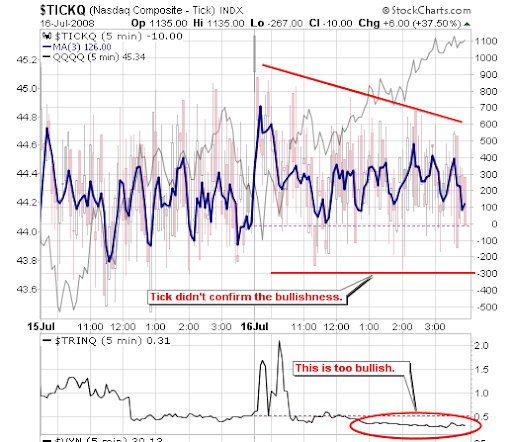
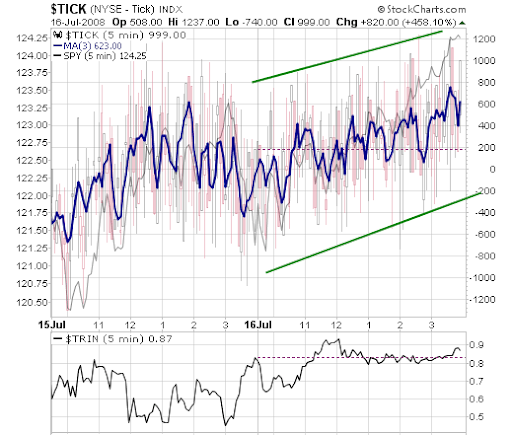
Today based on [url=http://stockcharts.com/def/servlet/Favorites.CServlet?obj=ID2393449&cmd=show[s139439402]&disp=P]0.0.1 Simple SPY Trading System[/url] the plan was short-term short. Someone asked me yesterday, what should we do if the market gapped down today? My answer was to wait for the gap being filled at about 10:30am, then watch [url=http://stockcharts.com/def/servlet/Favorites.CServlet?obj=ID2393449&cmd=show[s134510337]&disp=P]2.1.2 NYSE - Tick (5 min)[/url] and see if TRIN stayed above 1.2, at the same time $XJY should go up. However today TRIN was quite bearish all the time, and $XJY kept falling. This was against the short signal until the market closed, and a huge Bullish Engulf pattern was formed. Therefore the sell signal was not confirmed today, and we have to wait for the next chance. Concerning the $XJY confirmation, I find that the market will normally close in green if $XJY goes down. This phenomena is valid recently but may not hold forever.
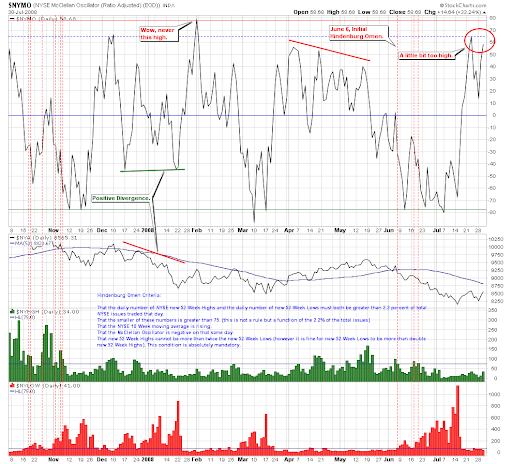
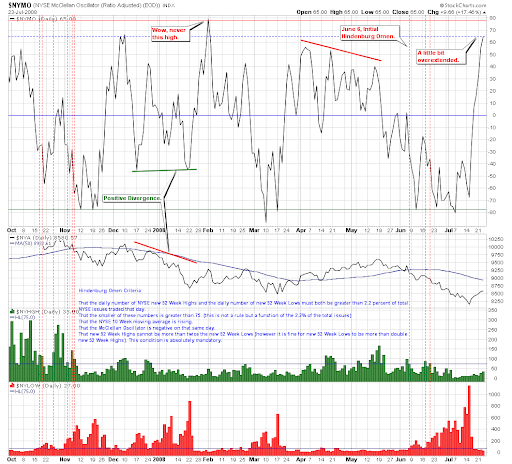
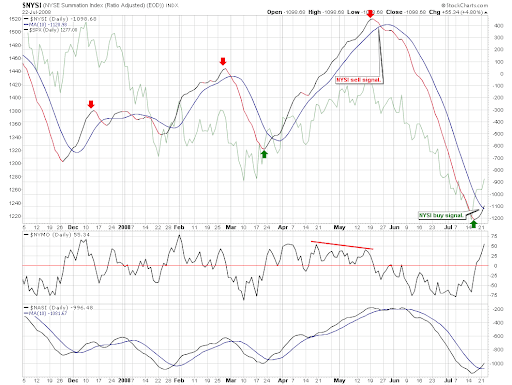
Today we got mid-term buy signal. On [url=http://stockcharts.com/def/servlet/Favorites.CServlet?obj=ID2393449&cmd=show[s124013638]&disp=P]0.0.0 Signal Watch and Daily Highlights[/url] needed mid-term signals on the left side of the chart are all in green, including my favorite signal [url=http://stockcharts.com/def/servlet/Favorites.CServlet?obj=ID2393449&cmd=show[s122111965]&disp=P]2.2.0 NYSE McClellan Chart[/url].
As a result of this, [url=http://stockcharts.com/def/servlet/Favorites.CServlet?obj=ID2393449&cmd=show[s139439402]&disp=P]0.0.1 Simple SPY Trading System[/url] says it's time to close mid-term short, and open mid-term long. However there are some overbought signals on the chart which means the market is due for pullback. So you have to make a decision whether to close mid-term short and open mid-term long after a pullback OR close short / open long tomorrow morning. For myself, I do not open long positions when the market is overbought. All signals are about probability, TA is not 100% accurate, but the spirit of TA is to bet the high probability setups, not worry about "this time may be different". When I say the market is due for pullback in the near term, I mean the market has a higher probability of pullback than rally. Whenever you believe this time is different and the signals might be wrong, please feel free to go ahead.
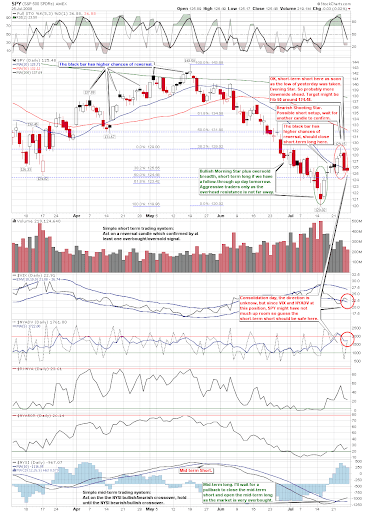
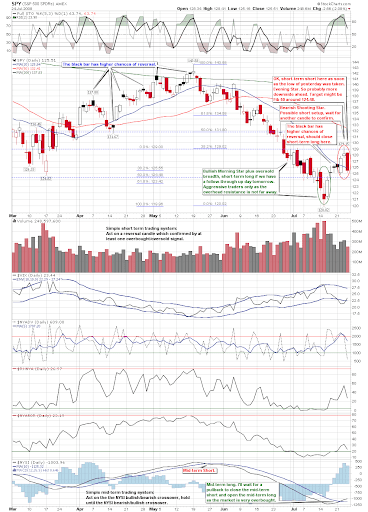
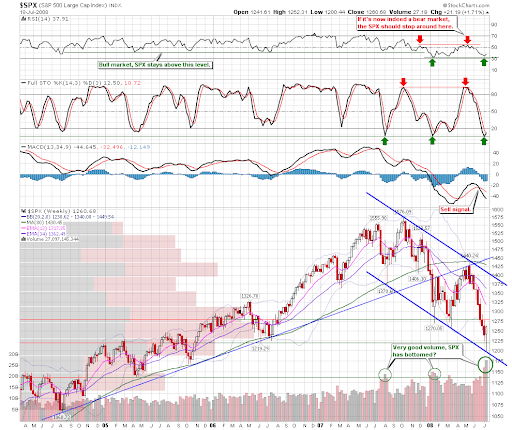
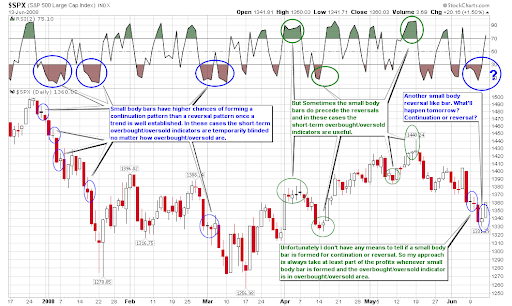
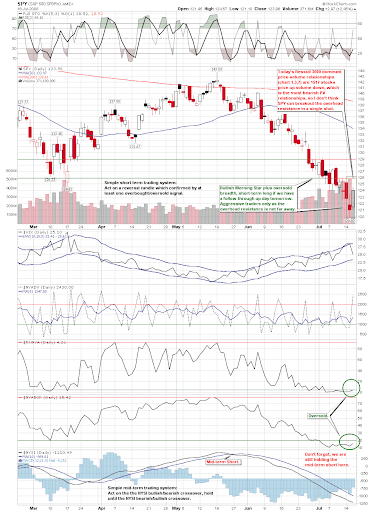
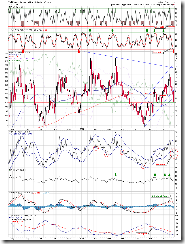
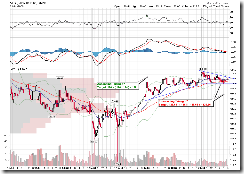
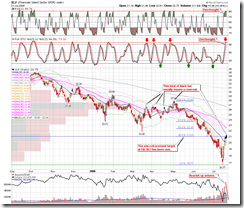
[url=http://stockcharts.com/def/servlet/Favorites.CServlet?obj=ID2393449&cmd=show[s126616985]&disp=P]1.0.0 S&P 500 Large Cap Index (Daily)[/url]. Similar with other indices, it is overbought but MACD is confirmed buy signal. Also note the all black buy signal on the bottom of the chart.
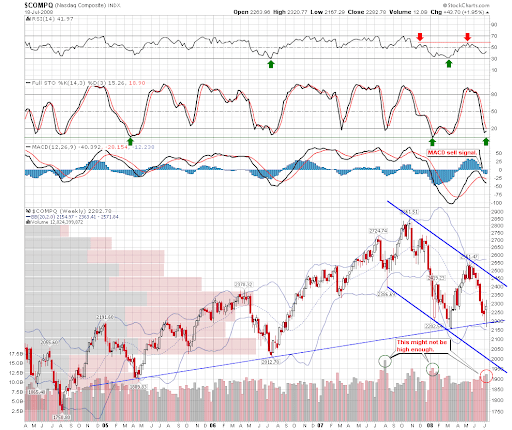
[url=http://stockcharts.com/def/servlet/Favorites.CServlet?obj=ID2393449&cmd=show[s111434698]&disp=P]1.1.0 Nasdaq Composite (Daily)[/url]. It is testing the downtrend line.
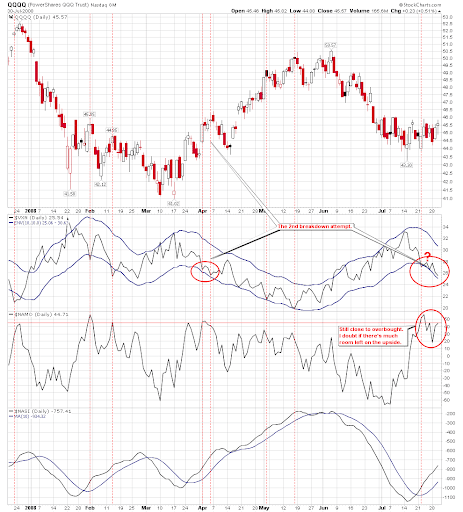
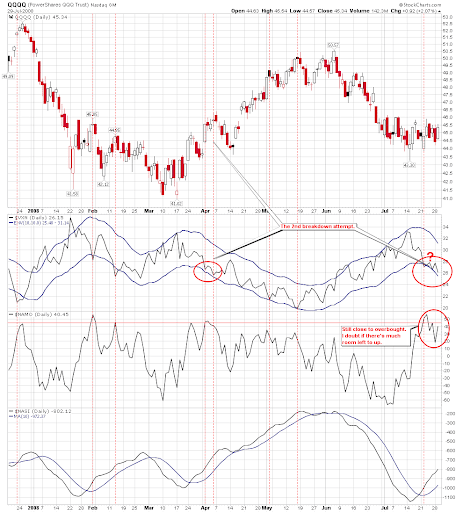
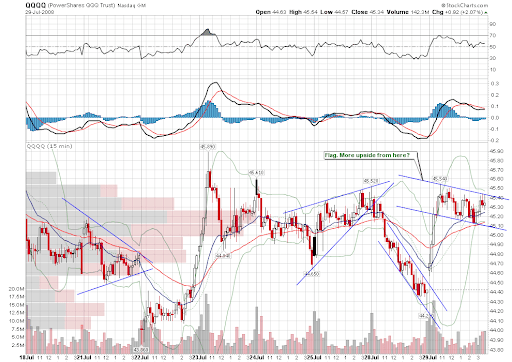
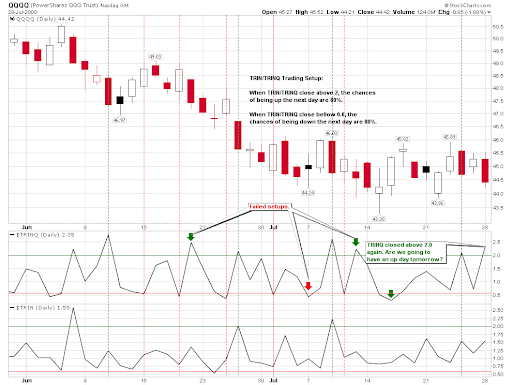
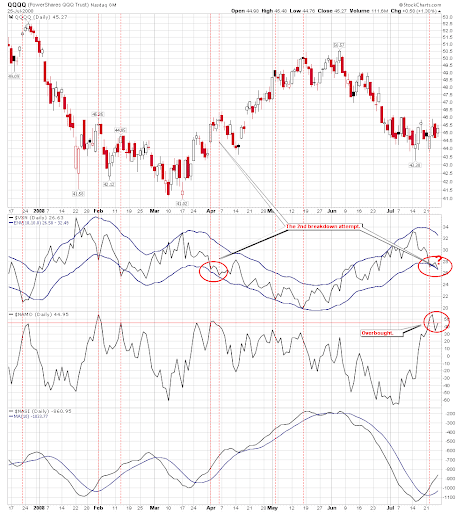
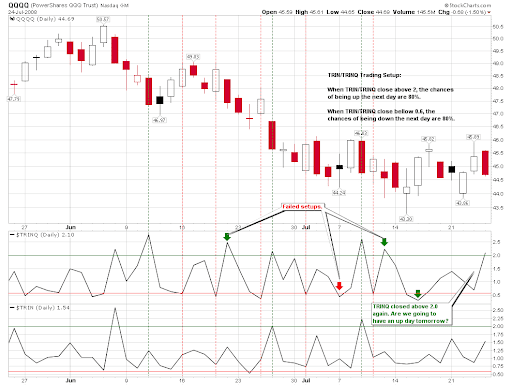
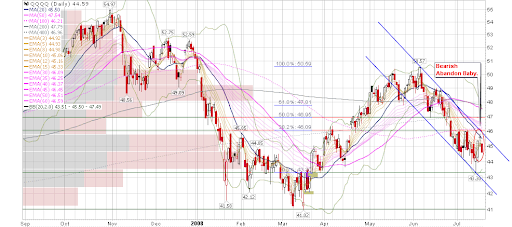
[url=http://stockcharts.com/def/servlet/Favorites.CServlet?obj=ID2393449&cmd=show[s125997542]&disp=P]1.1.6 PowerShares QQQ Trust (QQQQ Daily)[/url]. It is funny that VXN MA(10) Envelope is oversold. What does this mean? fall further down? At least the upside space is not much.
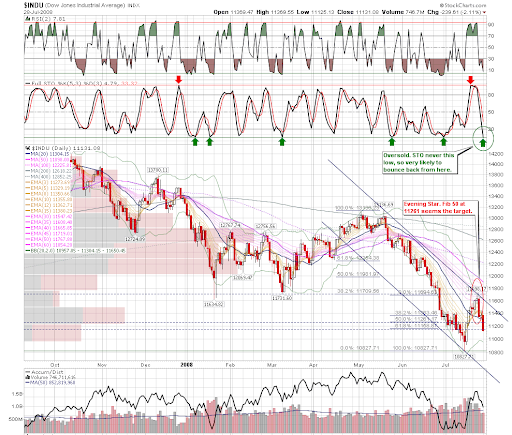
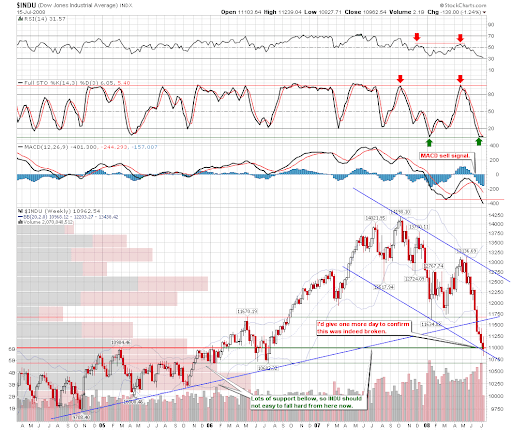
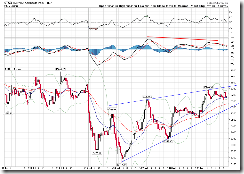
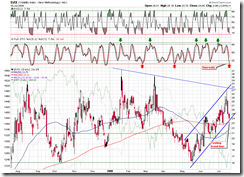
[url=http://stockcharts.com/def/servlet/Favorites.CServlet?obj=ID2393449&cmd=show[s124615261]&disp=P]1.2.1 Dow Jones Industrial Average (Weekly)[/url]. $INDU is testing back the trendline, which so called kill channel goodbye.
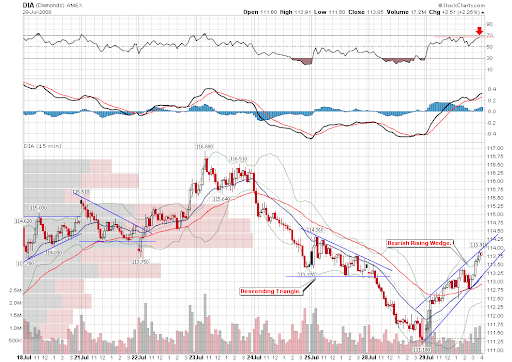
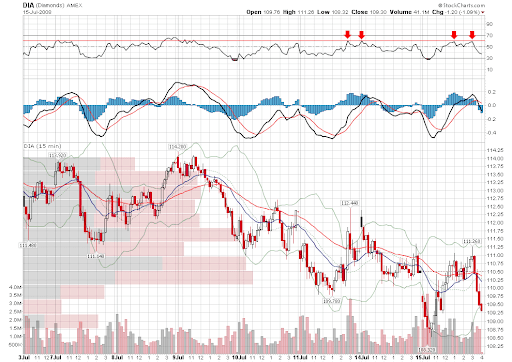
[url=http://stockcharts.com/def/servlet/Favorites.CServlet?obj=ID2393449&cmd=show[s134697461]&disp=P]1.2.7 Diamonds (DIA 15 min)[/url]. The negative divergence of RSI is obvious on the 15-min intraday chart. But take the notice that the divergence does not mean immediate pullback, it usually has to be confirmed by other signals.
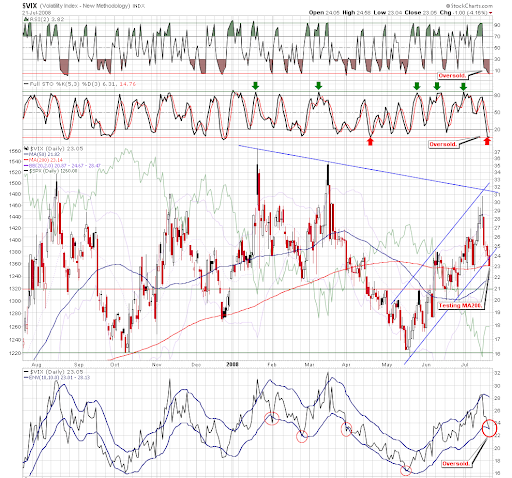
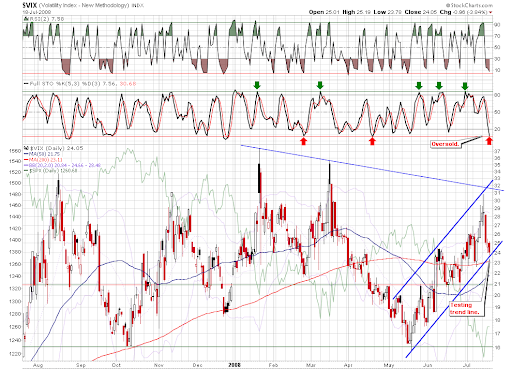
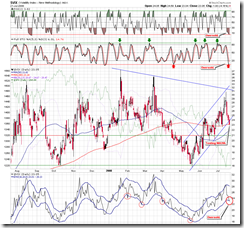
[url=http://stockcharts.com/def/servlet/Favorites.CServlet?obj=ID2393449&cmd=show[s122111957]&disp=P]2.0.0 Volatility Index - NYSE (Daily)[/url]. It is extremely oversold. Note that the breakout of MA(10) Envelop is the greatest since the beginning of this year. The probability of the market pullback is very high.
[url=http://stockcharts.com/def/servlet/Favorites.CServlet?obj=ID2393449&cmd=show[s123447127]&disp=P]2.4.2 NYSE - Issues Advancing[/url]. Overbought on the chart also means pullback. Note that the portion it extends into the overbought region is the greatest in the year, and overbought/oversold of this signal has been fairly accurate in the past. (this time might be an exception, who knows?)
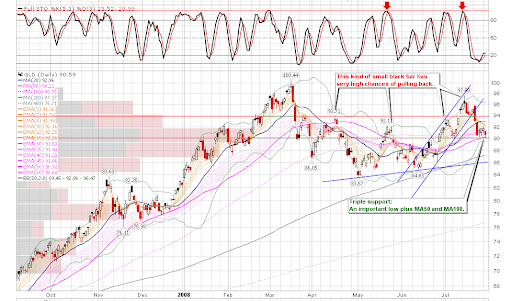
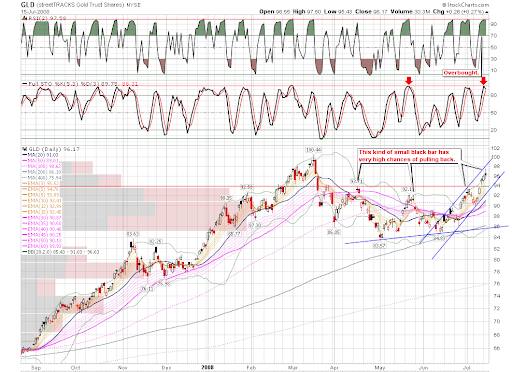
[url=http://stockcharts.com/def/servlet/Favorites.CServlet?obj=ID2393449&cmd=show[s124844123]&disp=P]3.3.0 streetTRACKS Gold Trust Shares (GLD Daily)[/url]. It broke the support, so I closed my position.
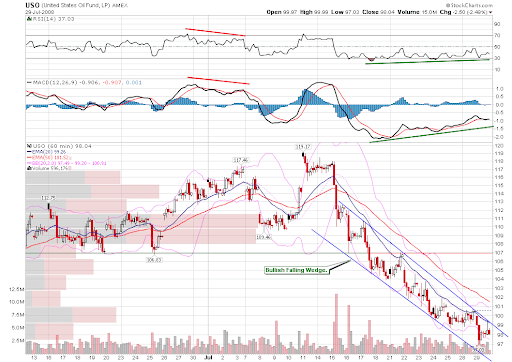
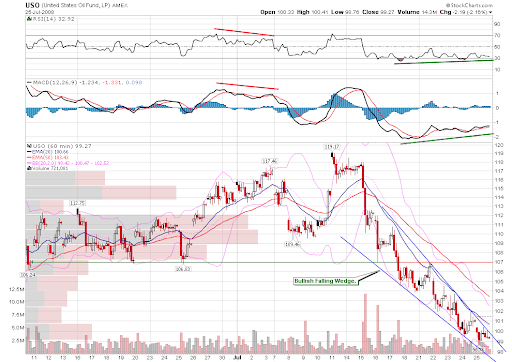
[url=http://stockcharts.com/def/servlet/Favorites.CServlet?obj=ID2393449&cmd=show[s126630325]&disp=P]3.4.3 United States Oil Fund, LP (USO 60 min)[/url]. MACD and RSI have a little bit positive divergence.
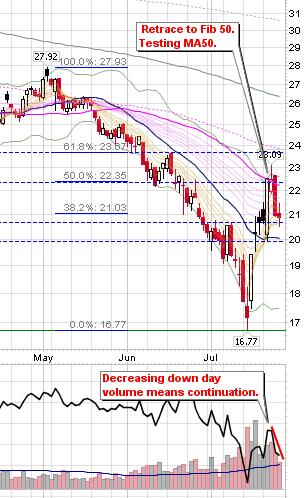
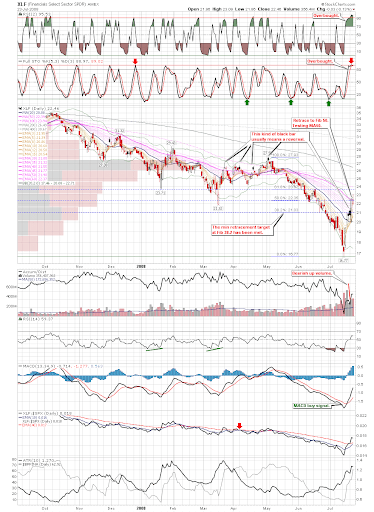
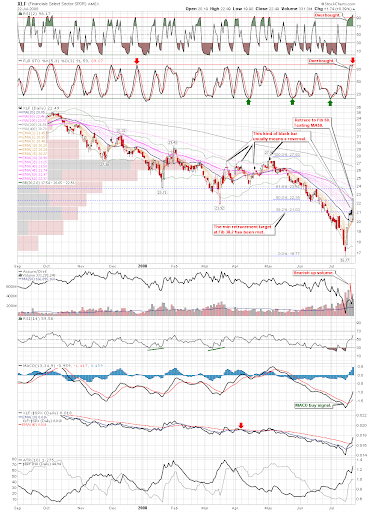
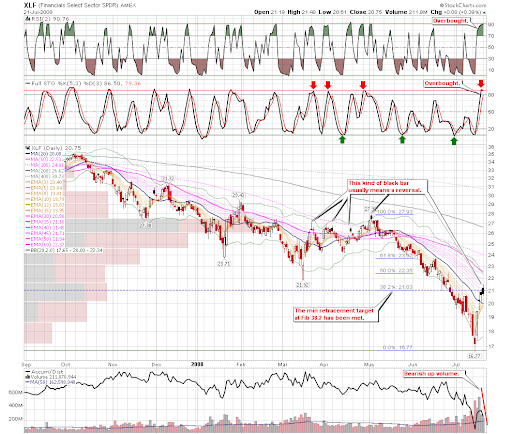
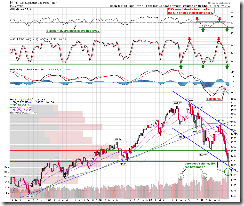
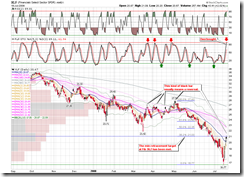
[url=http://stockcharts.com/def/servlet/Favorites.CServlet?obj=ID2393449&cmd=show[s128581358]&disp=P]5.3.0 Financials Select Sector SPDR (XLF Daily)[/url]. It is right on the Fib 50 line at where the pullback usually finishes. Tomorrow MA(50) will be tested, which is very important.
Posted by Cobra at 10:31 PM 1 comments 
Monday, July 21, 200807/21/2008 Market Recap: Lack of Commitment
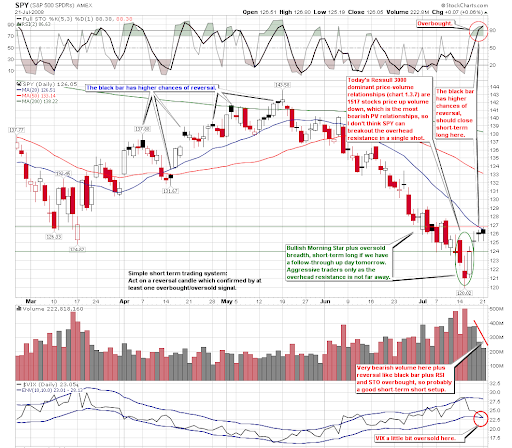
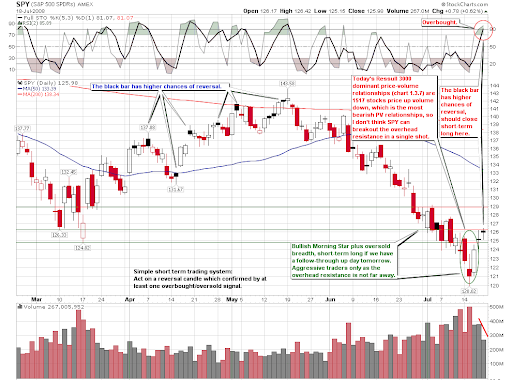
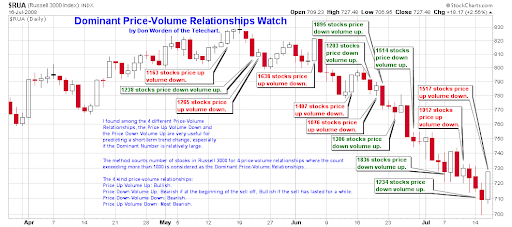
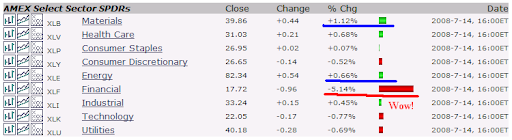
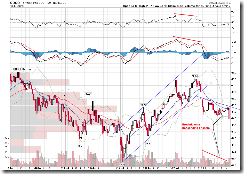
Today the main problem is the volume has dried up. Indices have been going up for four days but the volume keeps shrinking, which is a highly bearish pattern and likely causes a reversal. In addition, [url=http://stockcharts.com/def/servlet/Favorites.CServlet?obj=ID2393449&cmd=show[s123114873]&disp=P]5.2.0 Energy Select Sector SPDR (XLE Daily)[/url] and [url=http://stockcharts.com/def/servlet/Favorites.CServlet?obj=ID2393449&cmd=show[s123115036]&disp=P]5.6.0 Materials Select Sector SPDR (XLB Daily)[/url] rallied significantly while [url=http://stockcharts.com/def/servlet/Favorites.CServlet?obj=ID2393449&cmd=show[s128581358]&disp=P]5.3.0 Financials Select Sector SPDR (XLF Daily)[/url] did not although some decent ER released in the morning, and this usually means the rally will not last long. Furthermore, on [url=http://stockcharts.com/def/servlet/Favorites.CServlet?obj=ID2393449&cmd=show[s142685381]&disp=P]1.3.7 Russell 3000 Dominant Price-Volume Relationships[/url] the dominant price-volume relationships are 1066 stocks were price up volume down, which is again very bearish.
Therefore, the market is due for pullback tomorrow.
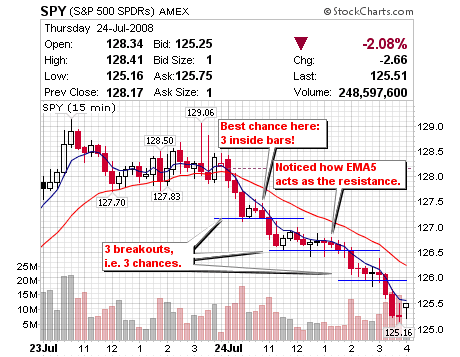
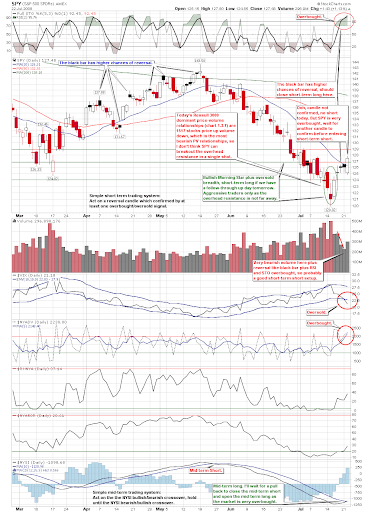
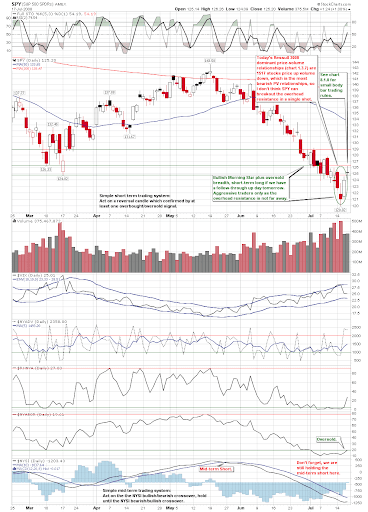
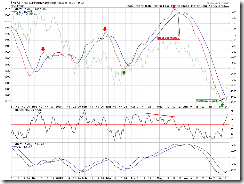
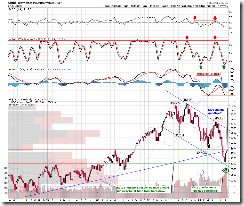
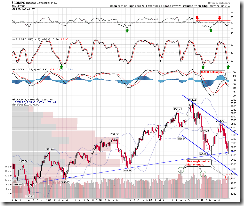
[url=http://stockcharts.com/def/servlet/Favorites.CServlet?obj=ID2393449&cmd=show[s139439402]&disp=P]0.0.1 Simple SPY Trading System[/url]. Note the bearish volume pattern, the black candle which has a high chance of reversal, and the overbought of RSI and STO indicators, as well as the oversold VIX/MA(10) at the bottom of the chart, all these signals are saying short-term short.
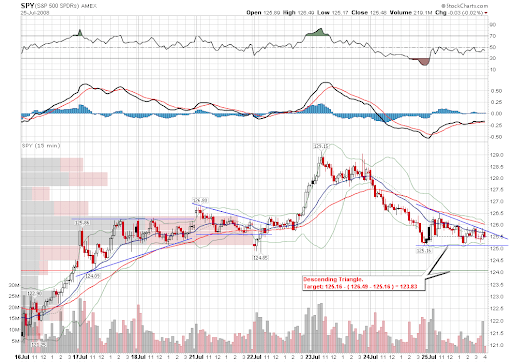
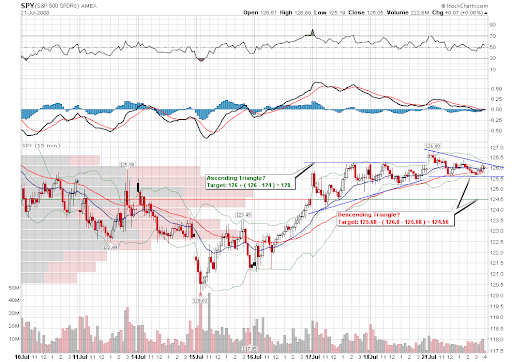
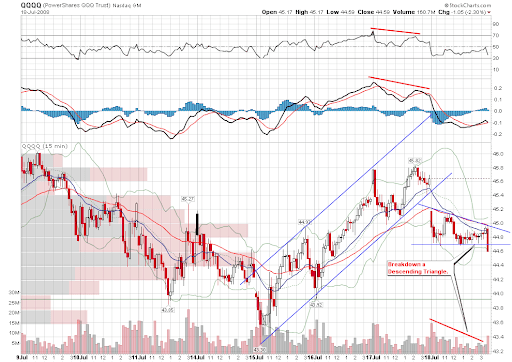
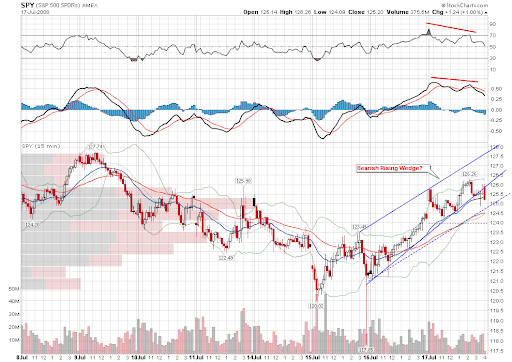
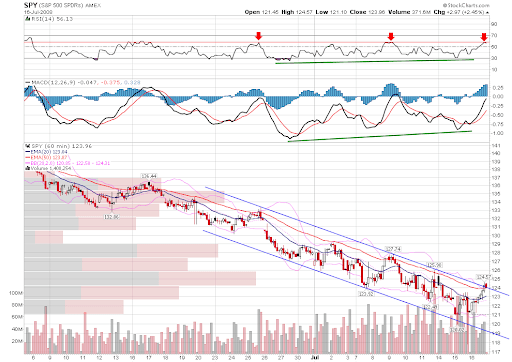
[url=http://stockcharts.com/def/servlet/Favorites.CServlet?obj=ID2393449&cmd=show[s134696784]&disp=P]1.0.7 S&P 500 SPDRs (SPY 15 min)[/url]. On the 15-min intraday chart, the Descending Triangle is targeting 124.56. By the way, the Ascending Triangle pattern mentioned yesterday indeed broke out upward but didn't reach the projected target. In fact the pattern on the intraday charts are quite reliable. Compared with technical indicators, chart patterns are more accurate in my opinion.
[url=http://stockcharts.com/def/servlet/Favorites.CServlet?obj=ID2393449&cmd=show[s134697461]&disp=P]1.2.7 Diamonds (DIA 15 min)[/url]. The Descending Triangle is targeting 112.93.
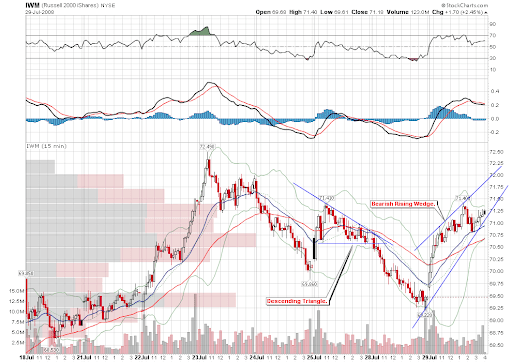
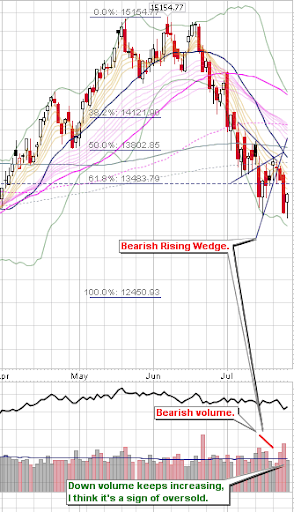
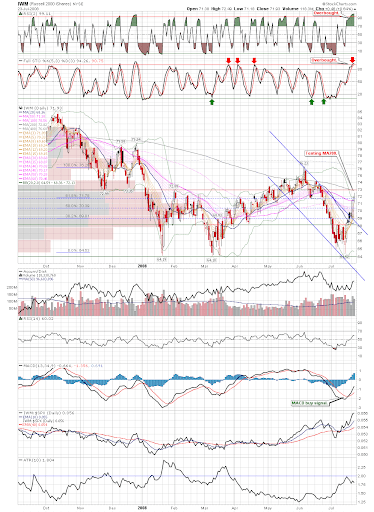
[url=http://stockcharts.com/def/servlet/Favorites.CServlet?obj=ID2393449&cmd=show[s125784160]&disp=P]1.3.0 Russell 2000 iShares (IWM Daily)[/url]. Overbought after four days of rally, volume is decreasing, very bearish. On [url=http://stockcharts.com/def/servlet/Favorites.CServlet?obj=ID2393449&cmd=show[s134697614]&disp=P]1.3.6 Russell 2000 iShares (IWM 15 min)[/url], the bearish Rising Wedge indicates a possible pullback.
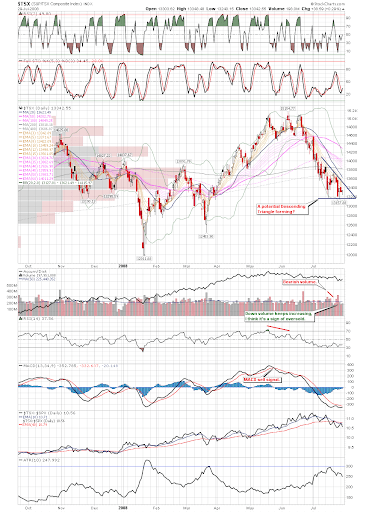
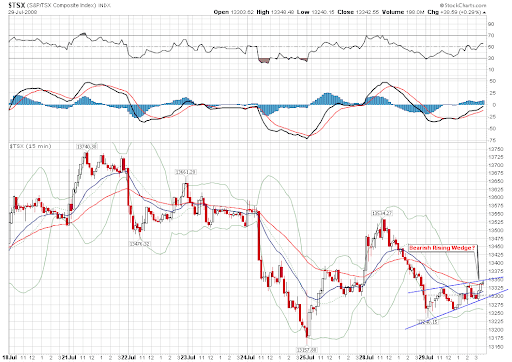
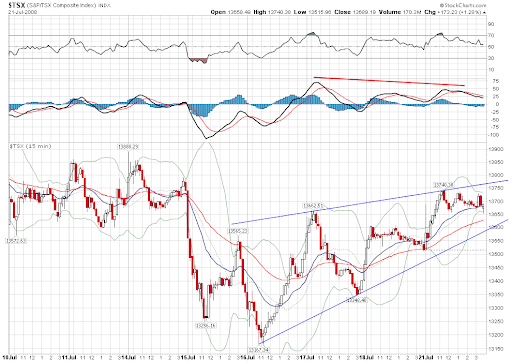
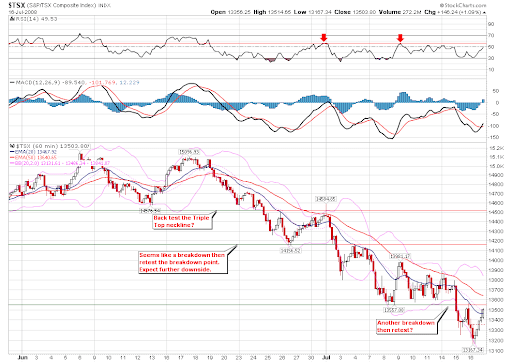
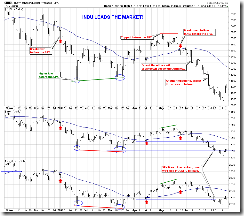
[url=http://stockcharts.com/def/servlet/Favorites.CServlet?obj=ID2393449&cmd=show[s130140412]&disp=P]1.4.0 S&P/TSX Composite Index (Daily)[/url], bearish Rising Wedge. [url=http://stockcharts.com/def/servlet/Favorites.CServlet?obj=ID2393449&cmd=show[s131641892]&disp=P]1.4.2 S&P/TSX Composite Index (60 min)[/url], [url=http://stockcharts.com/def/servlet/Favorites.CServlet?obj=ID2393449&cmd=show[s142228780]&disp=P]1.4.3 S&P/TSX Composite Index (15 min)[/url], on both the 60-min and 15-min chart, the bearish Rising Wedge patterns are clear. In addition, MACD on the 15-min chart shows negative divergence. So the Canada market is due for pullback, too.
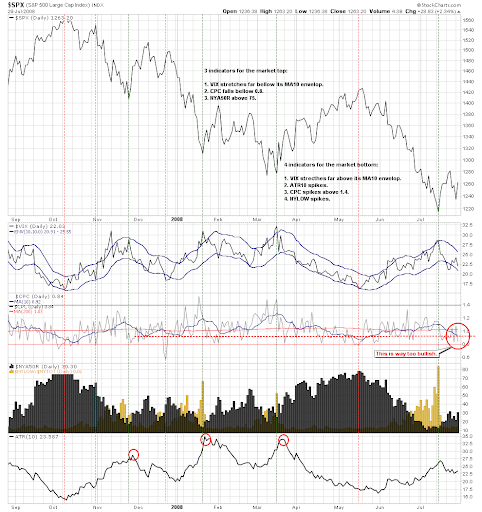
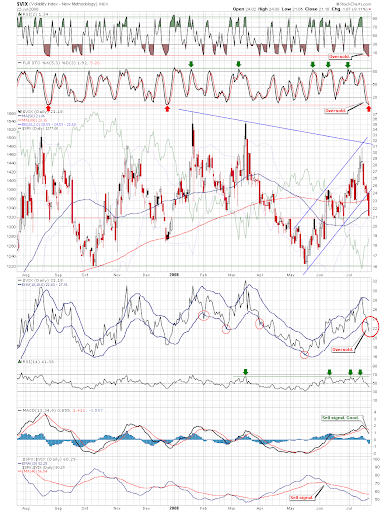
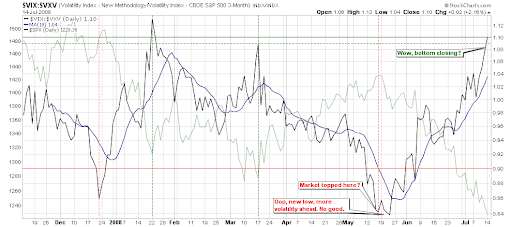
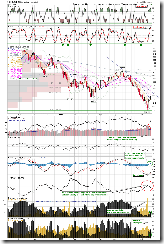
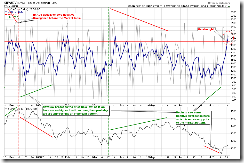
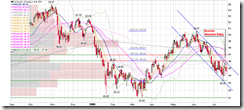
[url=http://stockcharts.com/def/servlet/Favorites.CServlet?obj=ID2393449&cmd=show[s122111957]&disp=P]2.0.0 Volatility Index - NYSE (Daily)[/url]. VIX is extremely oversold. It is now testing MA(200), also note the MA(10) envelope, which has entered into the region of mid-term oversold. Take further notice at the locations where VIX broke MA(10) envelope (marked by red circles), the latest oversold condition is quite significant. Therefore, if VIX drops further tomorrow, no matter the market goes up or down, it is an excellent chance to initiate short positions. Regardless how bullish the market is in the near term, remember that the primary trend is down. Short positions based on such a good signal has a high probability of success.
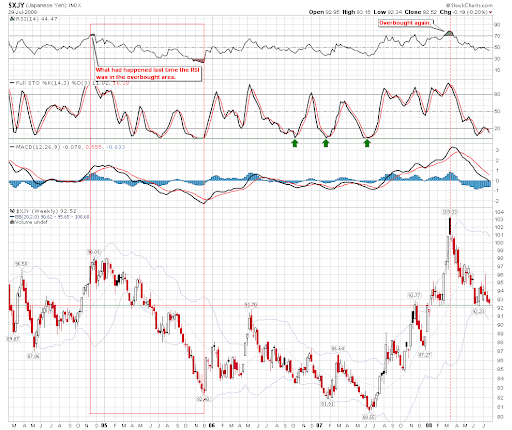
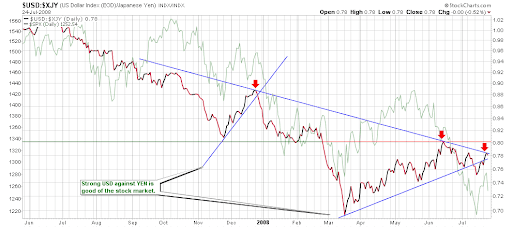
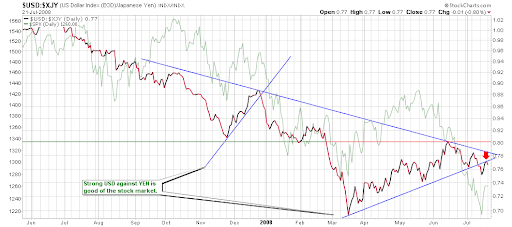
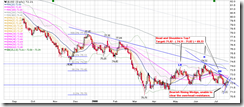
[url=http://stockcharts.com/def/servlet/Favorites.CServlet?obj=ID2393449&cmd=show[s123353198]&disp=P]3.2.0 Japanese Yen (Daily)[/url]. It is supported by MA(200). The rally of Yen means the plunge of the stock market because of unwind carry trade. [url=http://stockcharts.com/def/servlet/Favorites.CServlet?obj=ID2393449&cmd=show[s137463038]&disp=P]3.2.3 US Dollar/Japanese Yen Ratio[/url], note that the ratio has bounced back by the resistance, and this is very bearish to the stock market.
[url=http://stockcharts.com/def/servlet/Favorites.CServlet?obj=ID2393449&cmd=show[s124844123]&disp=P]3.3.0 streetTRACKS Gold Trust Shares (GLD Daily)[/url]. The gold bounced up from the support. It is a good entry-point.
[url=http://stockcharts.com/def/servlet/Favorites.CServlet?obj=ID2393449&cmd=show[s126630325]&disp=P]3.4.3 United States Oil Fund, LP (USO 60 min)[/url]. Here is the only good news for bulls -- the oil is getting a resistance at the moment.
[url=http://stockcharts.com/def/servlet/Favorites.CServlet?obj=ID2393449&cmd=show[s128581358]&disp=P]5.3.0 Financials Select Sector SPDR (XLF Daily)[/url]. Overbought, and black candle, plus bearish up volume. Very bearish.
Posted by Cobra at 9:27 PM 0 comments
Saturday, July 19, 200807/18/2008 Market Recap: Market might pull back, the Tuesday's low holds the key
Last Friday many charts are saying the market is due for pullback, and I am wondering if they are too perfect to be correct. Anyway, let me present all charts here and you will see whether they seem reasonable or not.
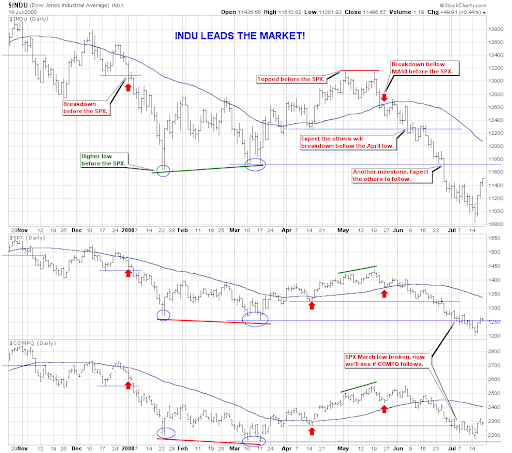
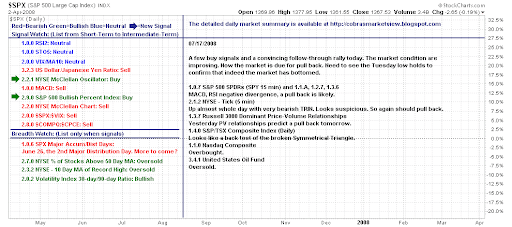
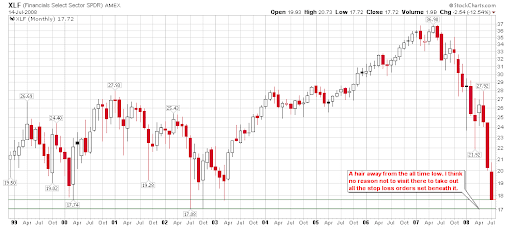
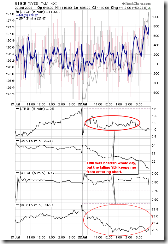
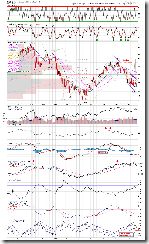
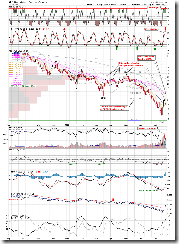
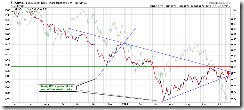
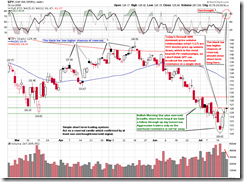
If indeed a pullback happens, the Tuesday low is the key to watch. On the following chart, 0.0.3 INDU leads the Markets, my target has not reached yet since COMPQ is not following INDU to break the March low. Note the blue circles on the chart: while the market is bottoming out, INDU always makes a higher low when SPX and COMPQ is still lower low. Therefore my prediction is that maybe the market will test the Tuesday low, and COMPQ will very likely break it and even break the March low, INDU will however hold the Tuesday low. At the time being, I am not aware of anything worse than banks' collapse which could cause the market's plummet to the Tuesday low. If next week the market drops and makes higher lows, it will be a good opportunity to buy dip.
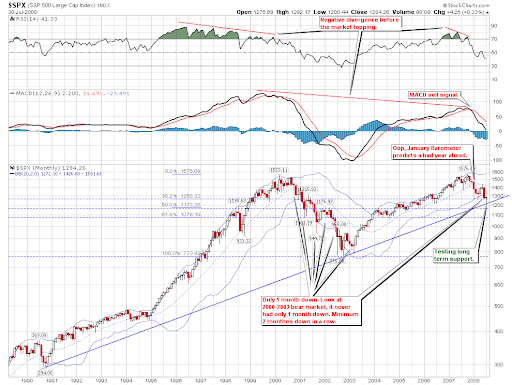
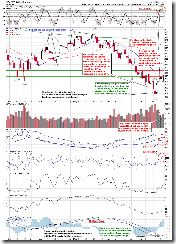
Here is another reason of supporting COMPQ to break the Tuesday low. Note the green circles marked at the bottom of following chart, 1.0.1 S&P 500 Large Cap Index (Weekly), such heavy volumes looks like a bottom pattern. However the volumes on the next chart, 1.1.2 Nasdaq Composite (Weekly) (marked with green circles), do not look heavy enough compared with INDU chart. So it seems $COMPQ will plunge eventually. We will know whether this becomes true or not once the AAPL earning report is released after the market closes.
1.0.0 S&P 500 Large Cap Index (Daily), 1.1.0 Nasdaq Composite (Daily), 1.2.0 Dow Jones Industrial Average (Daily): all STO indicators are overbought.
0.0.1 Simple SPY Trading System, another black candlestick. As I said before, this kind of black candlestick has a chance of reversal. Additionally considering overbought RSI and STO, one should close the short-term long positions.
1.1.6 PowerShares QQQ Trust (QQQQ Daily). QQQQ is not overbought, but the current pattern is a Bearish Evening Star which is fairly reliable. Therefore QQQQ will likely drop down further.
1.1.A PowerShares QQQ Trust (QQQQ 15 min). On the 15-min intraday chart, QQQQ has broken downward the Descending Triangle, which means it will go further down on Monday.
1.3.0 Russell 2000 iShares (IWM Daily). It is overbought. Just like 1.0.0, a black candlestick has a higher chance of reversal. So very possibly IWM will dip down Monday.
1.4.0 S&P/TSX Composite Index (Daily). A black candlestick also shows up in the Canada market chart. Again, it means pullback. On the 60-min intraday chart, 1.4.2 S&P/TSX Composite Index (60 min), RSI is testing the resistance which is another reason of pullback.
2.0.0 Volatility Index - NYSE (Daily). VIX is right on the support, and STO is oversold. In the past STO will reverse at the current level, furthermore RSI(14) is also on the support, so VIX will possibly head up which means the market will pull back.
3.0.3 20 Year Treasury Bond Fund iShares (TLT Daily). Bond has been plummeting for four consecutive days, and it is now extremely oversold and due for a rebound. Therefore the money will flow into the bond market and will possibly drag down the stock market.
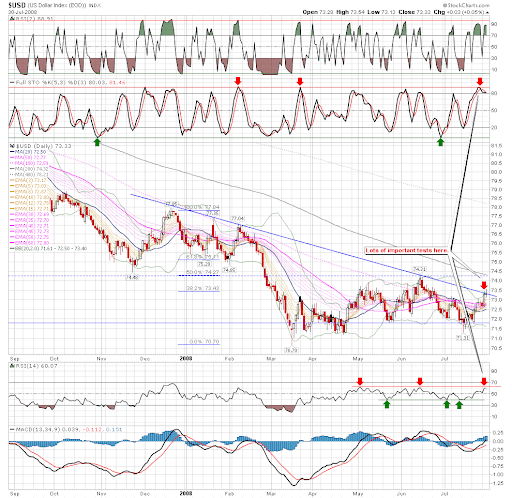
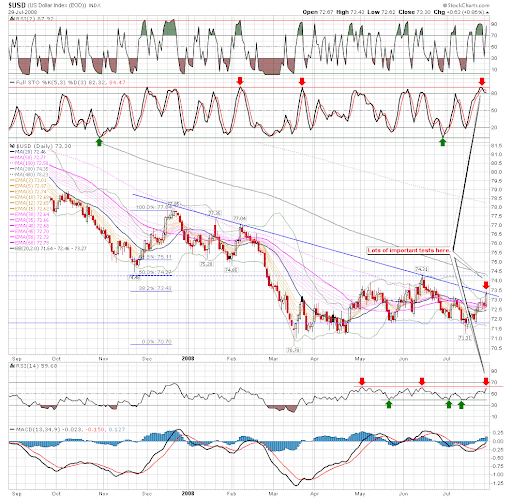
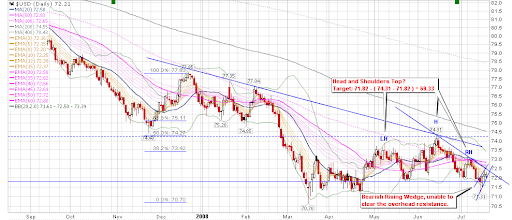
3.1.0 US Dollar Index (Daily). In the past few days USD seemed a bit strong but now it shows a Bearish Rising Wedge. The resistance holds firmly, so USD may turn south which is bearish to the stock market.
3.4.1 United States Oil Fund, LP (USO Daily). It is oversold and due for a rebound, which is bearish for the stock market.
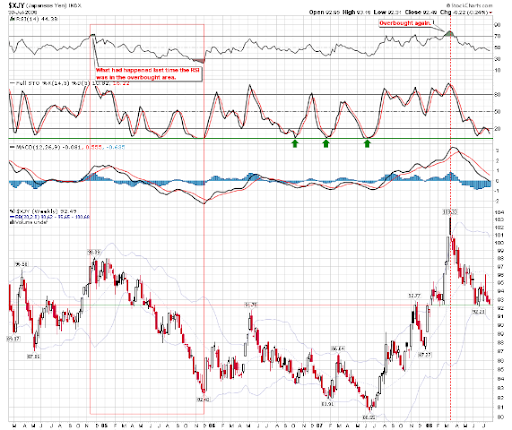
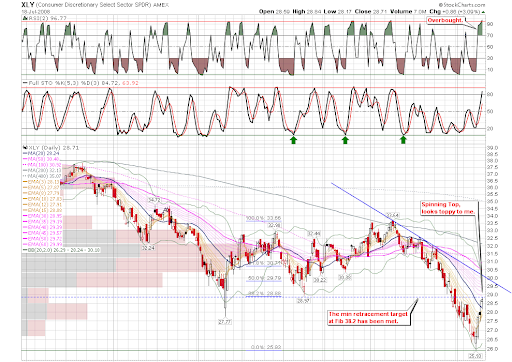
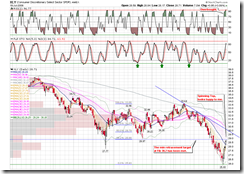
5.1.0 Consumer Discretionary Select Sector SPDR (XLY Daily). XLY is one of leading sectors in this rally during the past few days. Now it is overbought and closed at the Fib 38.2%, plus the Spinning Top pattern, all three factors are indicating a possibility of pullback.
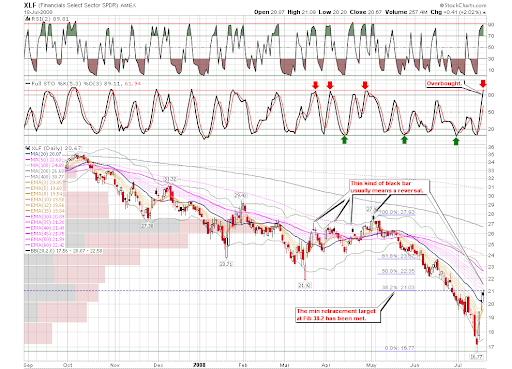
5.3.0 Financials Select Sector SPDR (XLF Daily). The most important and the leading sector in the rally is now overbought. In the past the black candlestick almost always means reversal. And it closed at Fib 38.2%, at where the rebound often finishes.
As a summary, so many signals are indicating the market is due for pullback. The only two charts which support the further rally are 1.0.7 S&P 500 SPDRs (SPY 15 min) and 1.2.7 Diamonds (DIA 15 min)的Ascending Triangle. However the Ascending Triangle are dual-directional, both upside and downside breakouts are possible. Therefore my conclusion is the market is due for pullback next Monday.
Posted by Cobra at 10:35 PM 0 comments
Newer Posts Older Posts Home |
|
|
 [复制链接]