- 金币:
-
- 奖励:
-
- 热心:
-
- 注册时间:
- 2006-7-3
|
|

楼主 |
发表于 2009-3-26 11:46
|
显示全部楼层
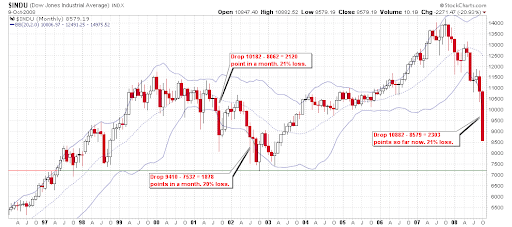
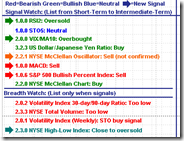
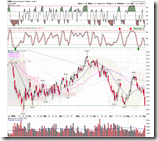
Thursday, September 4, 200809/04/2008 Market Recap: Major Distribution Day
Conclusion today:
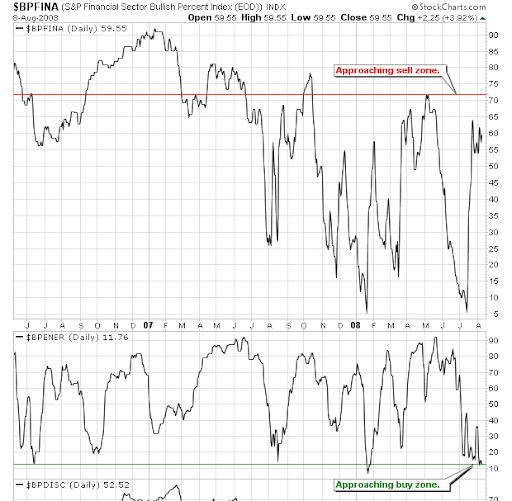
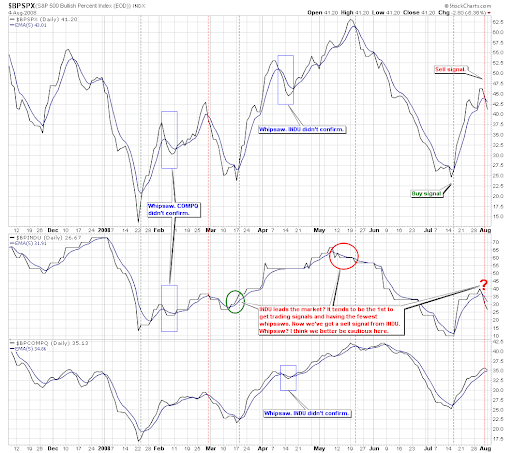
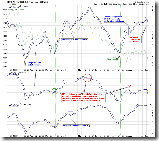
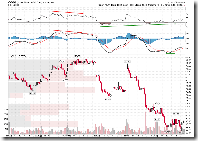
- There are a few mid-term sell signals, especially [url=http://stockcharts.com/def/servlet/Favorites.CServlet?obj=ID2393449&cmd=show[s133859547]&disp=P]1.0.6 S&P 500 Bullish Percent Index[/url], all three major indices confirm the sell signal at the same time. Therefore it is very likely the down leg begins, and the target is at least the low in July.
- We also get a few short-term oversold signals so the probability of market rebound is high. On the other hand, no signal clearly indicates that the market will bounce back tomorrow.
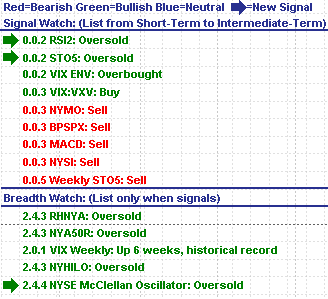
[url=http://stockcharts.com/def/servlet/Favorites.CServlet?obj=ID2393449&cmd=show[s124013638]&disp=P]0.0.0 Signal Watch and Daily Highlights[/url] contains all the signals. Read it and you will know what kind of situation the market is at present.
Firstly let's take a look at the evidence to prove the mid-term trend is bearish.
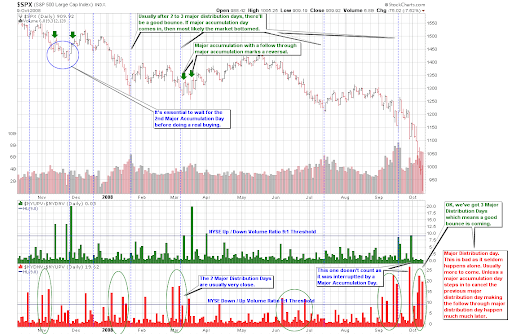
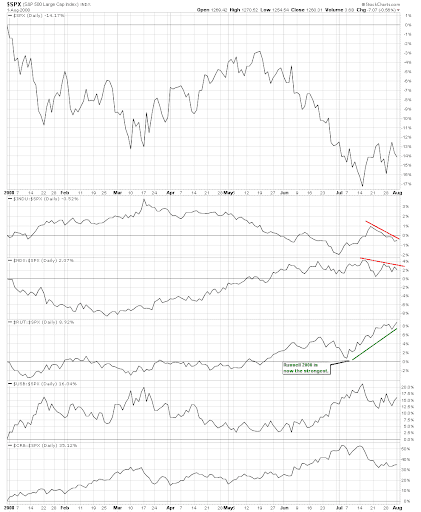
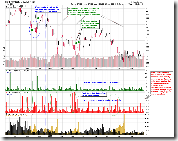
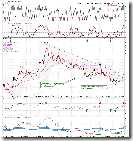
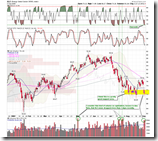
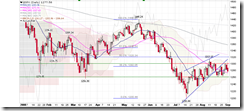
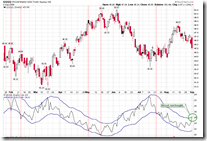
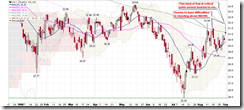
[url=http://stockcharts.com/def/servlet/Favorites.CServlet?obj=ID2393449&cmd=show[s128363142]&disp=P]1.0.7 S&P 500 Large Cap Index (Major Accum/Dist Days)[/url]. This is the main topic today, Major Distribution Day. The theory is that it does not appear in single. In a few weeks we will see another one unless a Major Accumulation Day happens before it.
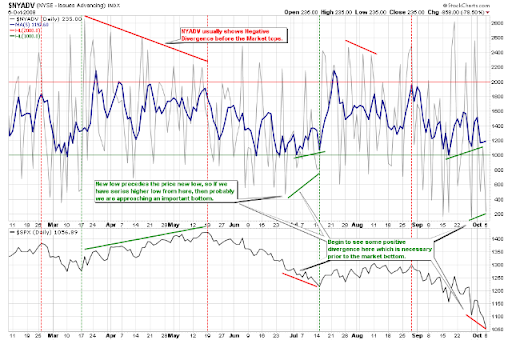
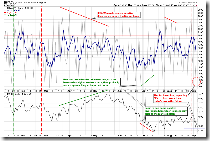
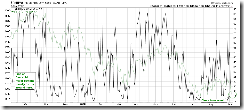
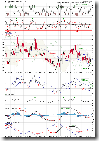
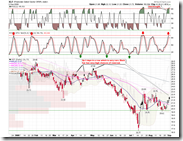
[url=http://stockcharts.com/def/servlet/Favorites.CServlet?obj=ID2393449&cmd=show[s123447127]&disp=P]2.4.2 NYSE - Issues Advancing[/url]. This chart is not very easy to read, basically you just pay attention to the Divergence. Look at the pale gray line, it usually forms a series of higher low before the market approaches a bottom. Now we have the first lower low, which means the trend of SPX will keep going down before a series of higher low shows up.
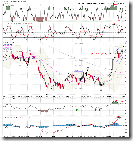
[url=http://stockcharts.com/def/servlet/Favorites.CServlet?obj=ID2393449&cmd=show[s133859547]&disp=P]1.0.6 S&P 500 Bullish Percent Index[/url]. As I said before, the sell signal is confirmed.
As a summary, all above signals mean the market will be quite weak from now on.
Next let's take a look which signals are supporting a short-term rebound.
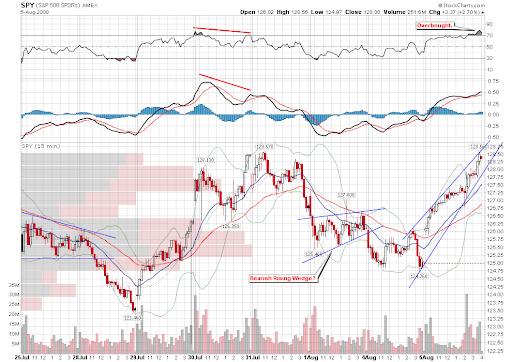
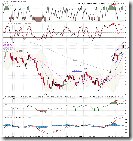
[url=http://stockcharts.com/def/servlet/Favorites.CServlet?obj=ID2393449&cmd=show[s134696784]&disp=P]1.0.4 S&P 500 SPDRs (SPY 15 min)[/url]. This is why I am not sure if the market will bounce back tomorrow, i.e., the positive divergence on MACD and RSI is to short to firmly support the rebound. Compare with [url=http://stockcharts.com/def/servlet/Favorites.CServlet?obj=ID2393449&cmd=show[s142228780]&disp=P]1.4.3 S&P/TSX Composite Index (15 min)[/url] you will see even if the divergence becomes very significant, a rebound may still not show up. By the way, according to 1.4.3, I think Canadian market may likely bounce back.
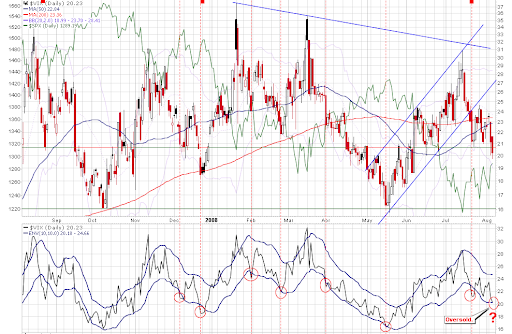
[url=http://stockcharts.com/def/servlet/Favorites.CServlet?obj=ID2393449&cmd=show[s122111957]&disp=P]2.0.0 Volatility Index - NYSE (Daily)[/url]. Besides the famous MA10 ENV is broken upward significantly, STO is also testing the resistance. Therefore it may reverse in the short-term, which means the market might bounce back.
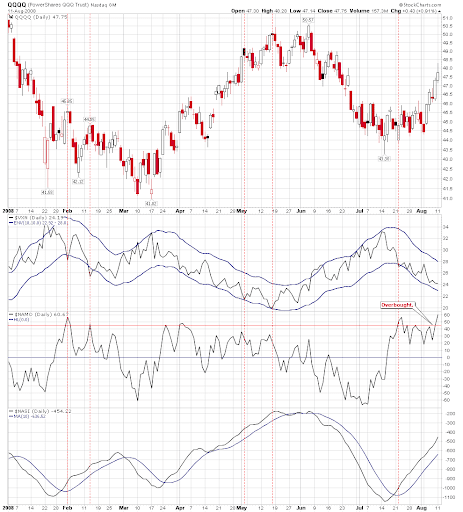
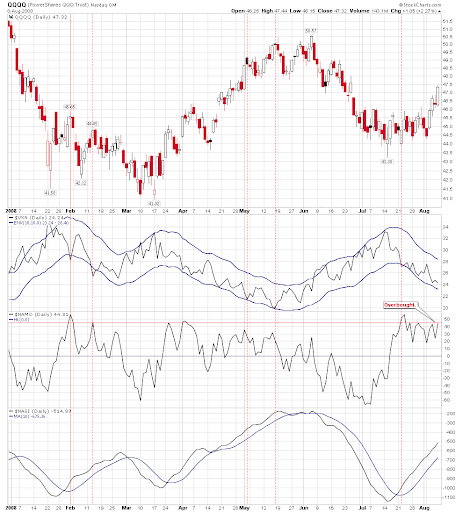
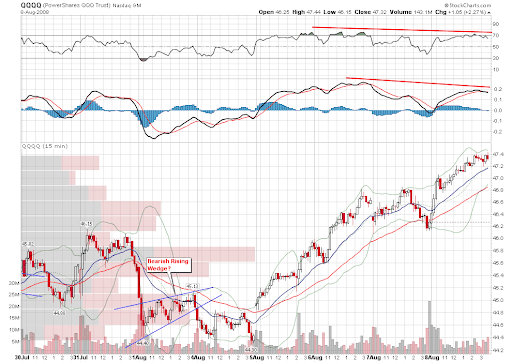
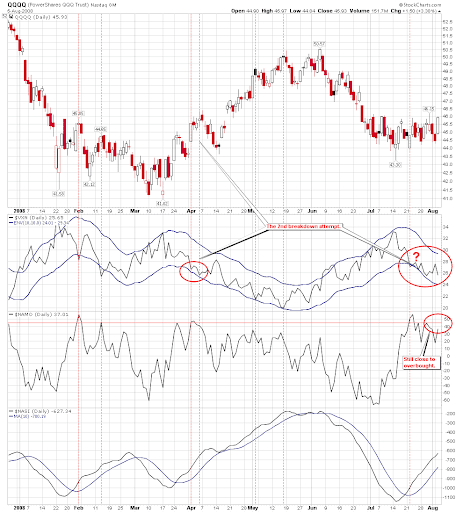
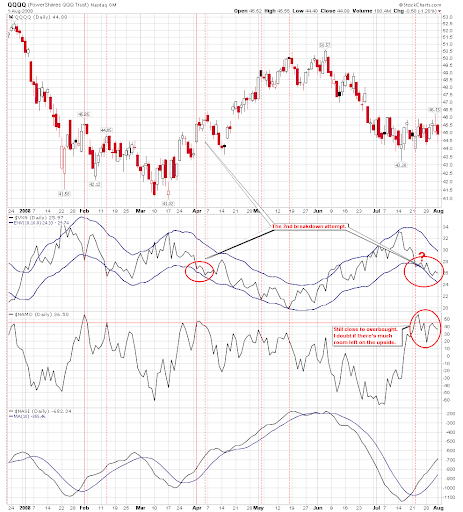
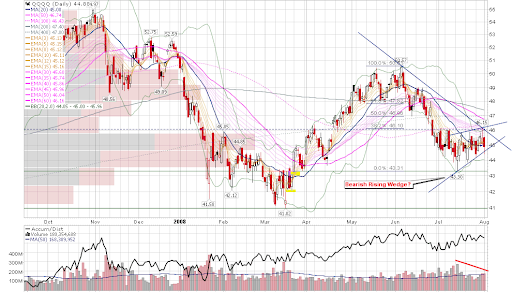
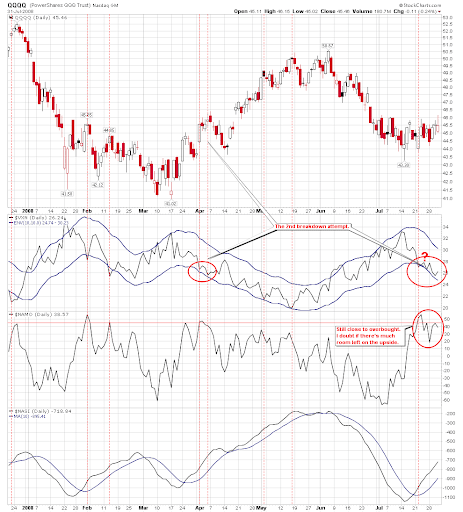
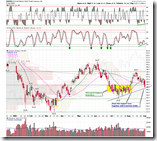
[url=http://stockcharts.com/def/servlet/Favorites.CServlet?obj=ID2393449&cmd=show[s125997542]&disp=P]1.1.6 PowerShares QQQ Trust (QQQQ Daily)[/url], oversold, and STO is on the support level too. Thus it has a chance to bounce back.
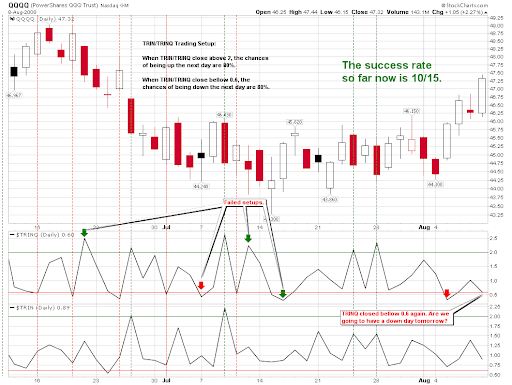
[url=http://stockcharts.com/def/servlet/Favorites.CServlet?obj=ID2393449&cmd=show[s144831686]&disp=P]1.1.C TRINQ Trading Setup[/url], TRINQ is greater than 2 today. Therefore QQQQ might bounce back tomorrow according to the TRINQ pattern. However, be reminded that the success rate of TRINQ setup is about 61%.
[url=http://stockcharts.com/def/servlet/Favorites.CServlet?obj=ID2393449&cmd=show[s131518004]&disp=P]2.3.0 NYSE High-Low Index[/url], this is the hope in the next Monday. If it keeps going down tomorrow, it may get oversold and the market will have a better chance to bounce back on the next Monday.
As a summary, in the short term bulls can hope for rebound but it may not happen tomorrow.
As what I said yesterday, I am not clear how the market will solve the issue of the short-term pullback of US dollar. Today the market tanked while US dollar raised like crazy. Once US dollar pulls back, what will happen? I am not optimistic.
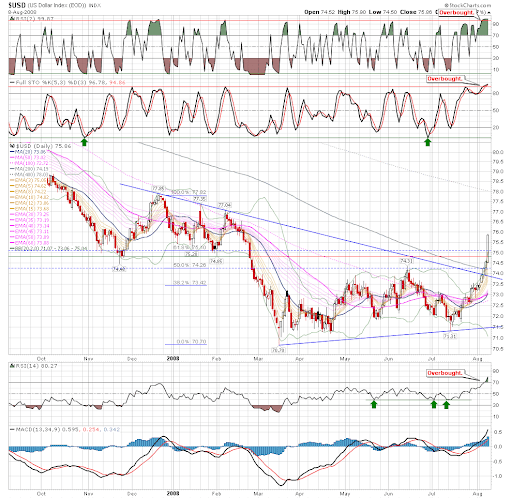
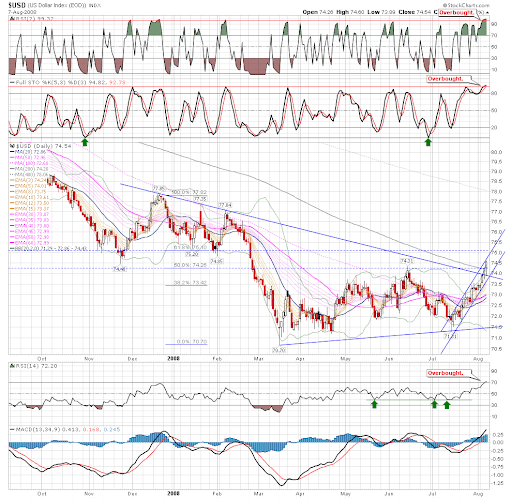
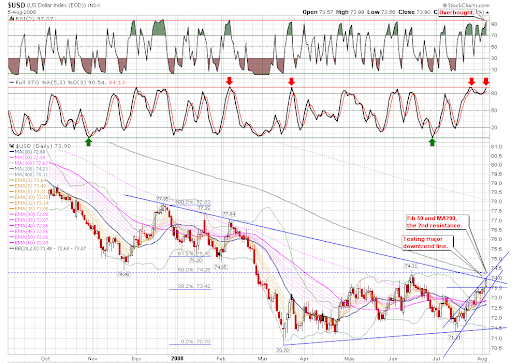
[url=http://stockcharts.com/def/servlet/Favorites.CServlet?obj=ID2393449&cmd=show[s123162280]&disp=P]3.1.0 US Dollar Index (Daily)[/url], overbought. The negative divergence still exists in the indicators.
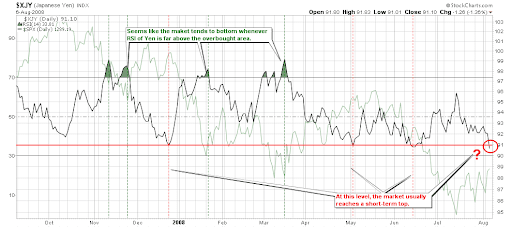
[url=http://stockcharts.com/def/servlet/Favorites.CServlet?obj=ID2393449&cmd=show[s123353198]&disp=P]3.2.0 Japanese Yen (Daily)[/url]. The chart of Japanese Yen looks bullish, Breakout Ascending Triangle. Of course, it is overbought too. Besides RSI2 is extremely overbought, RSI14 is also testing the resistance, so in the short-term it may pull back. Then the stock market may not look too bad if US dollar pulls back at the same time, hopefully.
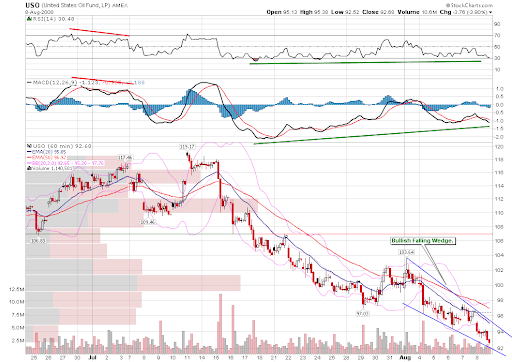
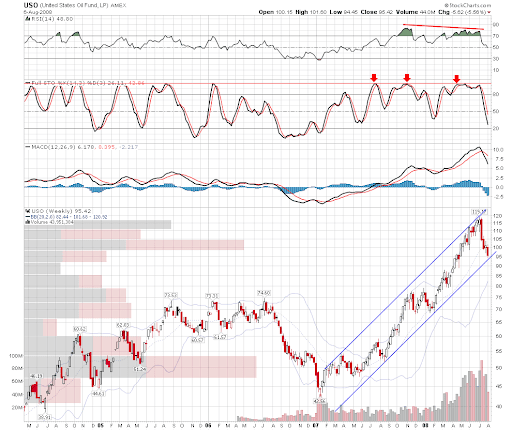
[url=http://stockcharts.com/def/servlet/Favorites.CServlet?obj=ID2393449&cmd=show[s125240869]&disp=P]3.4.1 United States Oil Fund, LP (USO Daily)[/url], oil is still oversold and holds on the support.
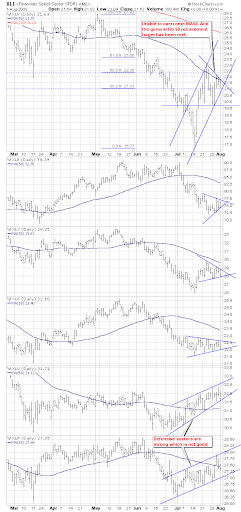
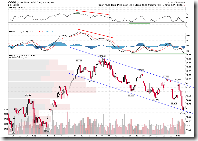
[url=http://stockcharts.com/def/servlet/Favorites.CServlet?obj=ID2393449&cmd=show[s123114873]&disp=P]5.2.0 Energy Select Sector SPDR (XLE Daily)[/url]. XLE may help the market bounce back. It is oversold and the volume still looks like a typical capitulation to me. It should probably bounce back.
[url=http://stockcharts.com/def/servlet/Favorites.CServlet?obj=ID2393449&cmd=show[s150387600]&disp=P]5.2.2 Energy Select Sector SPDR (XLE 15 min)[/url]. The positive divergence on MACD and RSI is actually fairly powerful.
If oil bounces back, so should be the Canadian market. [url=http://stockcharts.com/def/servlet/Favorites.CServlet?obj=ID2393449&cmd=show[s130140412]&disp=P]1.4.0 S&P/TSX Composite Index (Daily)[/url], oversold. [url=http://stockcharts.com/def/servlet/Favorites.CServlet?obj=ID2393449&cmd=show[s142228780]&disp=P]1.4.3 S&P/TSX Composite Index (15 min)[/url], as I said before the positive divergence on MACD and RSI is very significant. The Canadian market index dropped almost 1000 points within 3 days, how crazy it is.
Posted by Cobra at 10:35 PM 0 comments 
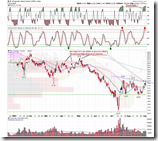
Wednesday, September 3, 200809/03/2008 Market Recap: Destined to up tomorrow?
Today I would like to give you the conclusion first:
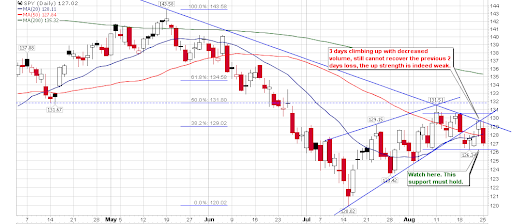
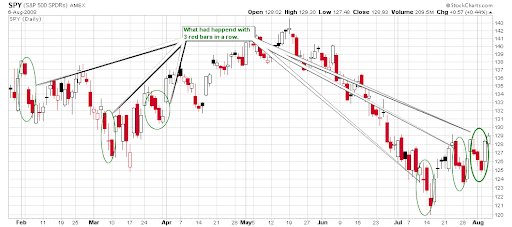
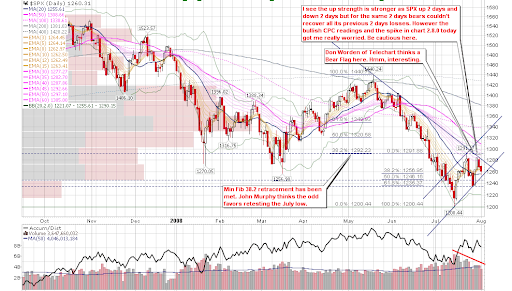
- As what I said before, if three down days cannot claim all the gain in the three up days, it means the up strength is stronger than the down strength. Today the market shows a little stronger up strength which is a good news. The market is still range bounded but at least it is not confirmed bearish.
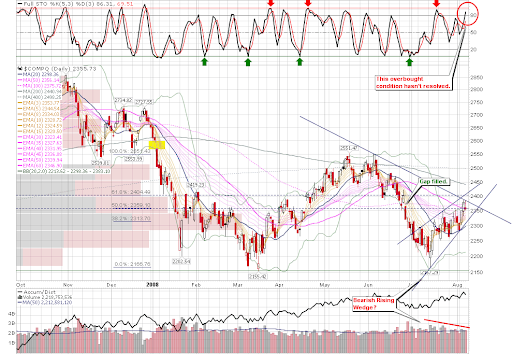
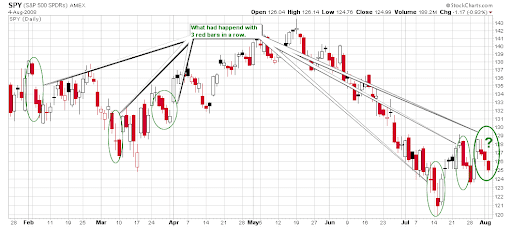
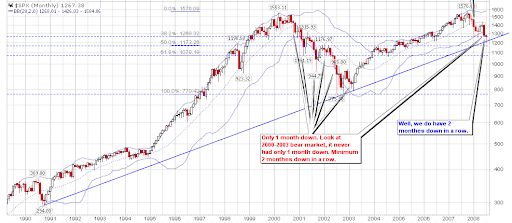
- If SPX has three down days in a row, I said that on the fourth day we will see a rebound. So tomorrow the market might go up according to this observation. However, besides this reason there is no other evidence to support the suspected rebound. I don't know how the market will resolve this puzzle, maybe a simple explanation is an overbought market can become even more overbought. Well, if the market indeed rises I think it's better to close a part of long positions since the market has been overbought already.
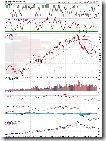
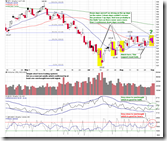
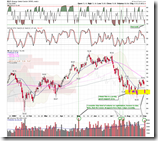
[url=http://stockcharts.com/def/servlet/Favorites.CServlet?obj=ID2393449&cmd=show[s139439402]&disp=P]0.0.1 Simple SPY Trading System[/url]. Above conclusions can be seen on this chart. Keep an eye on NYADV at the bottom. If it rises tomorrow, it may get overbought and the bounce (if we ever see one) could be a one-day wonder.
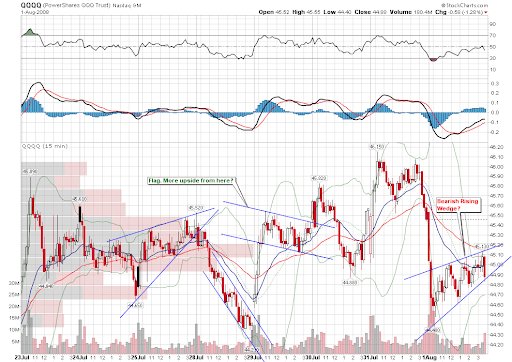
[url=http://stockcharts.com/def/servlet/Favorites.CServlet?obj=ID2393449&cmd=show[s134697338]&disp=P]1.1.A PowerShares QQQ Trust (QQQQ 15 min)[/url]. MACD and RSI show positive divergence. QQQQ probably has a chance to bounce back tomorrow.
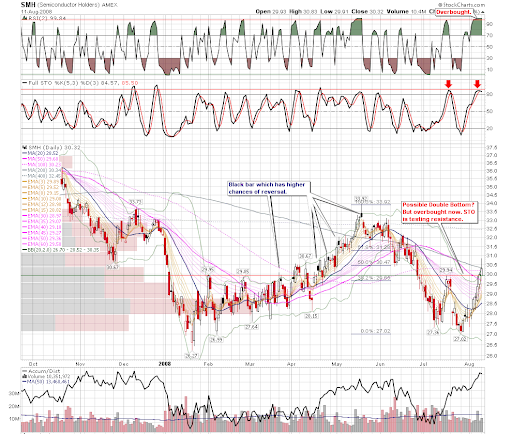
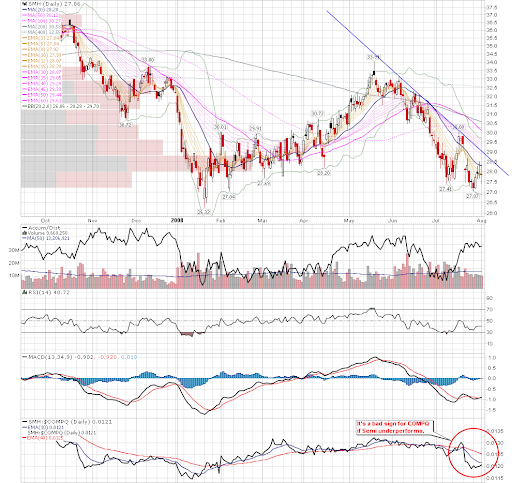
[url=http://stockcharts.com/def/servlet/Favorites.CServlet?obj=ID2393449&cmd=show[s134348165]&disp=P]1.1.4 Semiconductor Holders (SMH Daily)[/url]. This chart supports the possible rebound of QQQQ as well. The oversold SMH is the primary reason why Nasdaq is so weak recently. On the chart you can see that it had rallied 9 days continuously... finally it turned to oversold from extremely overbought.
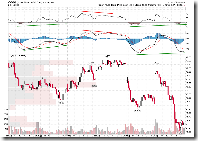
[url=http://stockcharts.com/def/servlet/Favorites.CServlet?obj=ID2393449&cmd=show[s128581358]&disp=P]5.3.0 Financials Select Sector SPDR (XLF Daily)[/url]. Look at this chart, XLF has rallied for 6 six days and this never happened before. I feel reluctant to say it is overbought and due for a pullback tomorrow. But in term of probability the pullback will happen for sure. I don't know if XLF can help the broad market to rally. If it pulls back, how can the whole market rally?
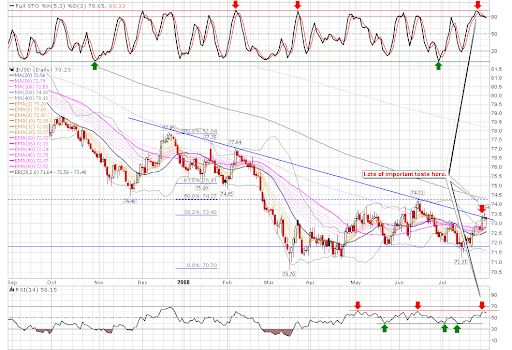
[url=http://stockcharts.com/def/servlet/Favorites.CServlet?obj=ID2393449&cmd=show[s123162280]&disp=P]3.1.0 US Dollar Index (Daily)[/url]. The Doji (i.e., the cross) candlestick pattern looks very toppy. Tomorrow it should go down a bit, which is bearish to the stock market.
[url=http://stockcharts.com/def/servlet/Favorites.CServlet?obj=ID2393449&cmd=show[s125240869]&disp=P]3.4.1 United States Oil Fund, LP (USO Daily)[/url], oversold and at the support. Two red hollow candles, high probability of reversal. Will the stock market still go up?
[url=http://stockcharts.com/def/servlet/Favorites.CServlet?obj=ID2393449&cmd=show[s123114873]&disp=P]5.2.0 Energy Select Sector SPDR (XLE Daily)[/url], oversold. Yesterday I said it never drops longer than three days recently, well, today is the fourth down day. So no pattern is absolutely accurate. Anyway, the volume still looks a capitulation so I believe it will bounce back soon. As I said yesterday, the rebound of XLE is bearish to XLF, and in turn bearish to the broad market.
As a summary, although I really wish the market could rally tomorrow, I cannot find any strong evidence. Maybe aforementioned indicators might not have an accurate timing and might keep as it is for a while. This gives me a feeling that, the rally tomorrow -- if we can ever see one -- seems not sustainable and might be farfetched. I do not deny the possibility of rally but I do not feel optimistic to the post-rally days either.
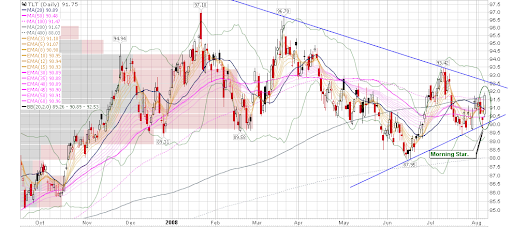
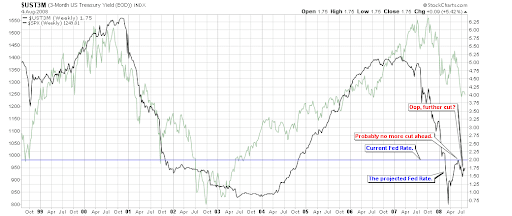
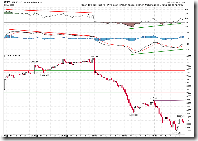
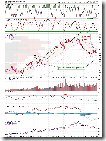
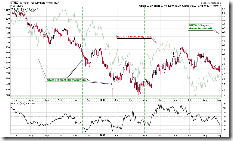
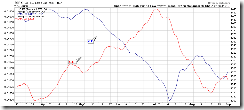
Just for your information, today actually there is a mid-term bottom signal. Because the present inflation rate is quite high (the data from the government denies it though), the trend of bond is not necessarily the opposite to the stock market. As a result, I doubt its applicability. [url=http://stockcharts.com/def/servlet/Favorites.CServlet?obj=ID2393449&cmd=show[s122111676]&disp=P]3.0.0 10Y T-Bill Yield[/url], note that the green dashed line accurately pinpoints the bottoms of the stock market, which is shown by the pale green line in the background. Does it mean we are going to see a massive rally? For the validation of this signal, you may refer to [url=http://stockcharts.com/def/servlet/Favorites.CServlet?obj=ID2393449&cmd=show[s137695390]&disp=P]8.0.4 Market top/bottom by ROC30 of 10Y T-Bill Yield 2005-2008[/url], [url=http://stockcharts.com/def/servlet/Favorites.CServlet?obj=ID2393449&cmd=show[s137696214]&disp=P]8.0.5 Market top/bottom by ROC30 of 10Y T-Bill Yield 2001-2004[/url]. Note that the validation was done in a low-inflation history, which is different from the current situation.
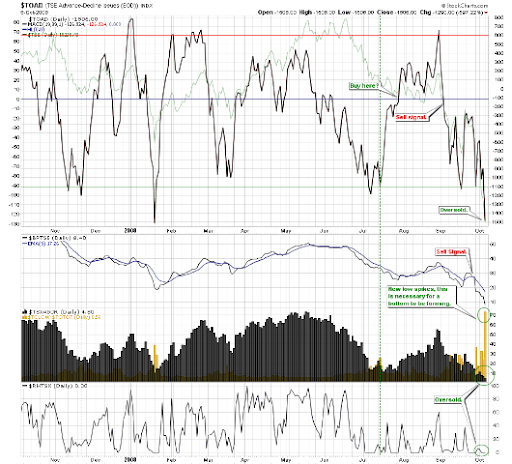
[url=http://stockcharts.com/def/servlet/Favorites.CServlet?obj=ID2393449&cmd=show[s148778154]&disp=P]1.4.4 TSE McClellan Oscillator[/url]. Note the green circles at the bottom of the chart. The Canadian market is oversold. Of course, RHTSX can stay at zero for some time. However, if the oil and the energy sector are going to bounce back according to aforementioned analysis, the Canadian market will have a chance, too.
Posted by Cobra at 10:15 PM 2 comments
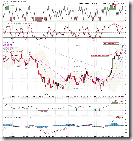
Tuesday, September 2, 200809/02/2008 Market Recap: Stuck in a Range
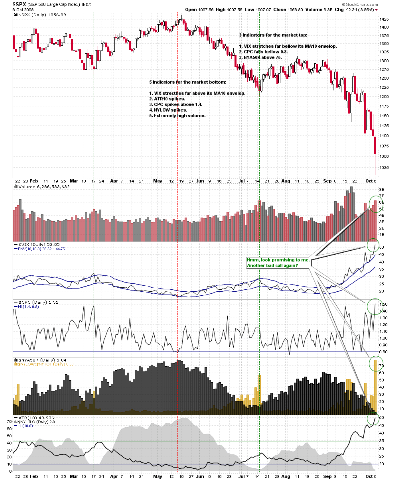
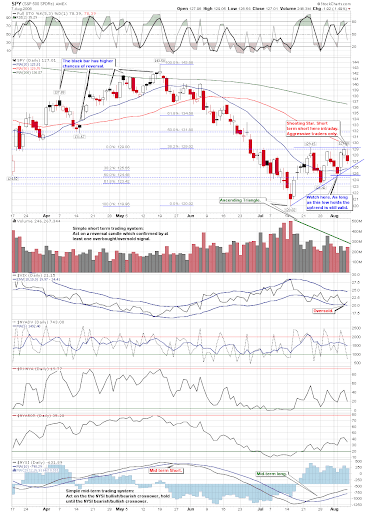
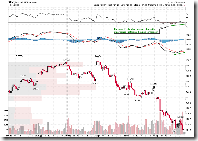
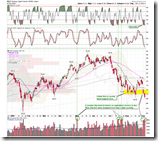
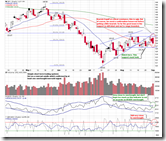
[url=http://stockcharts.com/def/servlet/Favorites.CServlet?obj=ID2393449&cmd=show[s139439402]&disp=P]0.0.1 Simple SPY Trading System[/url], Bearish Engulf (which means the current red candle completely engulfs the first one) is formed at a key resistance, so it is no doubt that the daily chart today is very bearish. The trading range formed during the last week, however, still holds so far, which means the market virtually goes nowhere. Tomorrow if the selling-off continues, we can see which direction of the trend is stronger according the my judgement to the trend strength -- whether 3 up days or 3 down days has greater magnitude -- and we will know where the Mr. Market will go.
There are the following three points for your attention:
- VIX ENV at the bottom. Note the green circles, VIX may break above ENV if the market dives tomorrow. Even if VIX doesn't, it will be overbought after further rally according to [url=http://stockcharts.com/def/servlet/Favorites.CServlet?obj=ID2393449&cmd=show[s122111957]&disp=P]2.0.0 Volatility Index - NYSE (Daily)[/url]. In this case the market may bounce back on the day after tomorrow. I have mentioned a few times that there will be a tradable rebound after three down days in a row recently. If the market goes down tomorrow it will be three down days, so in some sense bulls shouldn't feel too depressed.
- NYADV at the very bottom of the chart. Note the red circles, NYADV will be overbought if the market rises tomorrow. Overbought NYADV is a accurate pattern and thus the probability of market going down on the day after tomorrow will be big. Therefore if the market rallies, bears should not feel nervous. In addition, the success rate of NYADV is higher than VIX ENV in term of timing -- what I mean is that VIX ENV may have a delay.
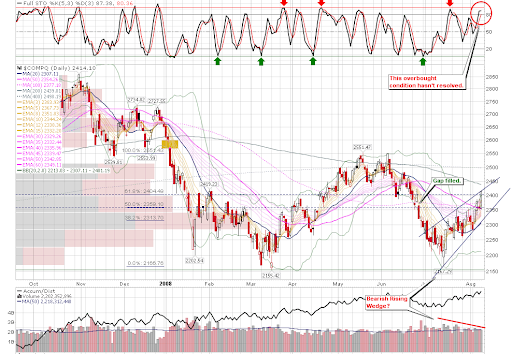
- [url=http://stockcharts.com/def/servlet/Favorites.CServlet?obj=ID2393449&cmd=show[s111434556]&disp=P]1.0.0 S&P 500 Large Cap Index (Daily)[/url], the candlestick pattern of the index daily chart is not a Bearish Engulf, then it doesn't seem that bearish (by no means it is not bearish). Let me re-emphasis that for candlestick pattern, one should always refer to the Index ETF chart. The open price of NYSE indices are often delayed, and the gap isn't clear on the chart and so the candlestick pattern analysis may be inaccurate. Today we have seen a typical pattern.
Conclusion: most likely the market will be stuck in a range this week, and both bulls and bears will have a chance to runaway or open new positions.
What will happen tomorrow then? I tend to be bearish although QQQQ may have a hope.
Let's take a look at QQQQ first.
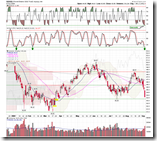
[url=http://stockcharts.com/def/servlet/Favorites.CServlet?obj=ID2393449&cmd=show[s125997542]&disp=P]1.1.6 PowerShares QQQ Trust (QQQQ Daily)[/url]. I think the yellow region provides a strong support and should not break easily. Furthermore, both STO and RSI2 show positive divergence which is good.
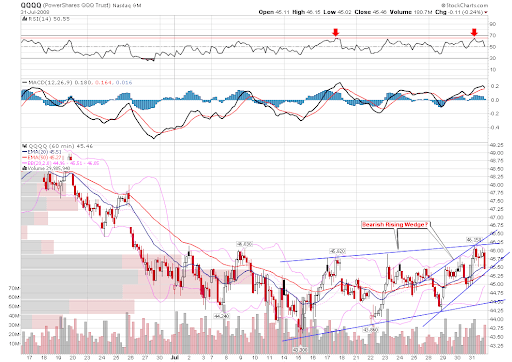
[url=http://stockcharts.com/def/servlet/Favorites.CServlet?obj=ID2393449&cmd=show[s126618051]&disp=P]1.1.8 PowerShares QQQ Trust (QQQQ 60 min)[/url]. I agree that QQQQ is in a down price channel, and the channel has been validated by three points. However today it is right on the lower edge and might bounce back. Take notice of the positive divergence on MACD and RSI.
[url=http://stockcharts.com/def/servlet/Favorites.CServlet?obj=ID2393449&cmd=show[s134697338]&disp=P]1.1.A PowerShares QQQ Trust (QQQQ 15 min)[/url], there is also positive divergence on MACD and RSI.
[url=http://stockcharts.com/def/servlet/Favorites.CServlet?obj=ID2393449&cmd=show[s146618192]&disp=P]1.1.B QQQQ and VXN[/url]. You can see that VXN ENV might be break upward if QQQQ dives tomorrow, so at least it might bounce back the day after tomorrow. However be careful that the VIX/VXN signal itself is accurate but its timing is not.
Here are some negative factors to the tomorrow market.
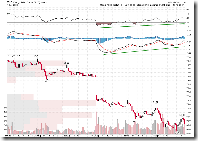
[url=http://stockcharts.com/def/servlet/Favorites.CServlet?obj=ID2393449&cmd=show[s122111957]&disp=P]2.0.0 Volatility Index - NYSE (Daily)[/url]. It has broken the Bullish Falling Wedge today, which is one of the most bearish signals for bulls. In the short term, as aforementioned it might get overbought, however the breakout today probably means VIX will be rising for a while, which in turn means the down leg of the market will likely start to grow. Before the trading range in 0.0.1 is broken, the down leg will not be confirmed so you don't have to act in advance. By the way, take a look at this [url=http://stockcharts.com/def/servlet/Favorites.CServlet?obj=ID2393449&cmd=show[s139801120]&disp=P]2.0.2 Volatility Index 30-day/90-day Ratio[/url], does it seem the top has passed?
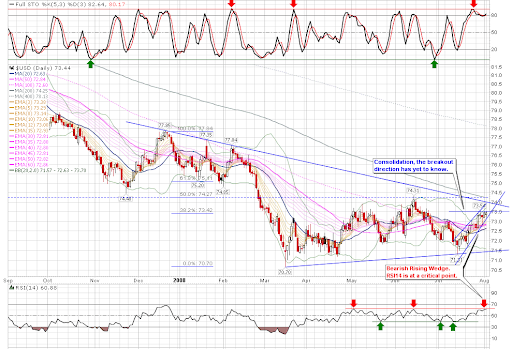
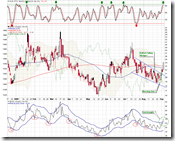
[url=http://stockcharts.com/def/servlet/Favorites.CServlet?obj=ID2393449&cmd=show[s123162280]&disp=P]3.1.0 US Dollar Index (Daily)[/url]. US dollar rallied again, and this time the stock market didn't go up but US dollar got overbought. I still think this is a bearish rising wedge pattern (I moved the lines a bit). Moreover, the negative divergence on the chart are not to be ignored. All these mean US dollar may pull back at least in the short term, which is bearish to the stock market.
[url=http://stockcharts.com/def/servlet/Favorites.CServlet?obj=ID2393449&cmd=show[s125240869]&disp=P]3.4.1 United States Oil Fund, LP (USO Daily)[/url], oversold. Note the positive divergence on MACD and RSI. With the possibility of US dollar pullback, oil may very likely bounce back.

Now take a look at the following chart and be reminded the anti-correlation between XLE (energy sector) and XLF (financial sector).
Then take a look at [url=http://stockcharts.com/def/servlet/Favorites.CServlet?obj=ID2393449&cmd=show[s123114873]&disp=P]5.2.0 Energy Select Sector SPDR (XLE Daily)[/url], it's oversold and right on the support. The volume looks like a capitulation to me. So the probability of rebound is quite high.
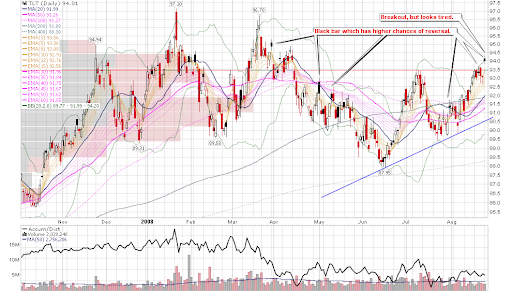
[url=http://stockcharts.com/def/servlet/Favorites.CServlet?obj=ID2393449&cmd=show[s128581358]&disp=P]5.3.0 Financials Select Sector SPDR (XLF Daily)[/url]. It is overbought and has rallied for five days. Note that other than the mad short squeeze after July 15th, it hasn't had a 5 up days in a row. The black candle has a very high probability of reversal. Also considered the factor of XLE, I think XLF will not be optimistic tomorrow.
[url=http://stockcharts.com/def/servlet/Favorites.CServlet?obj=ID2393449&cmd=show[s123114735]&disp=P]5.1.0 Consumer Discretionary Select Sector SPDR (XLY Daily)[/url]. XLY contains home builders and retailers, recently it often leads the rally. On the chart, however, it has been rejected the third time by the 200 days moving average. The Doji today is formed at the key resistance, which is likely a reversal.
By the way, many candlestick patterns, such as Bearish Engulf and Doji, will be more accurate at a key resistance. Of course they have to be confirmed on the next day, which is tomorrow.
So let's see how it goes tomorrow. God Bless America!
Posted by Cobra at 10:04 PM 0 comments
Newer Posts Older Posts Home |
|
|
 [复制链接]