- 金币:
-
- 奖励:
-
- 热心:
-
- 注册时间:
- 2006-7-3
|
|

楼主 |
发表于 2009-3-26 11:54
|
显示全部楼层
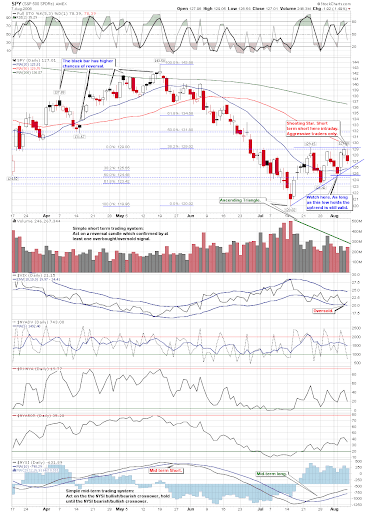
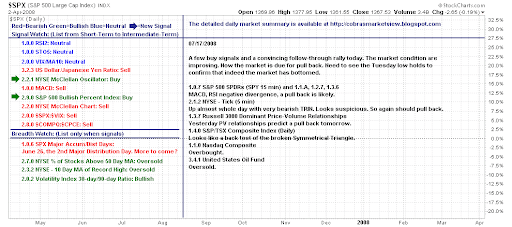
Thursday, August 7, 200808/07/2008 Market Recap: Uptrend Still Valid
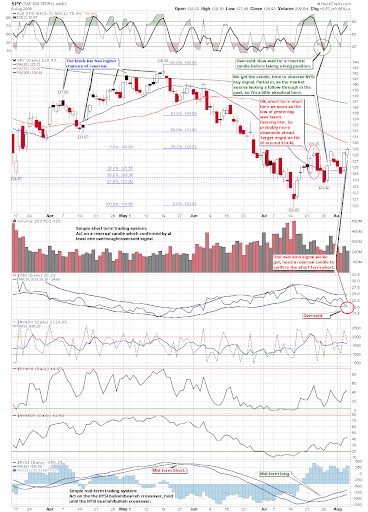
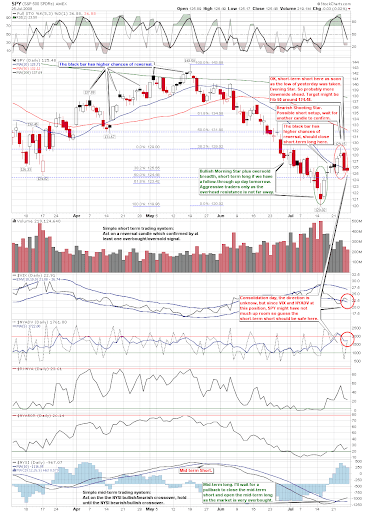
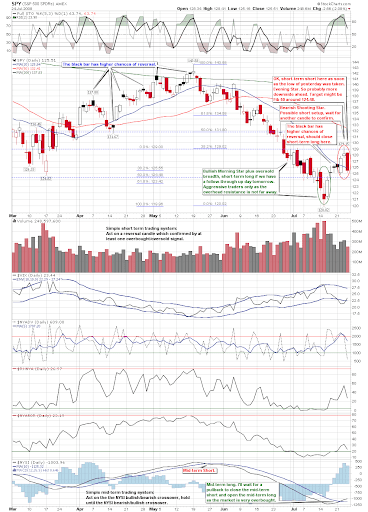
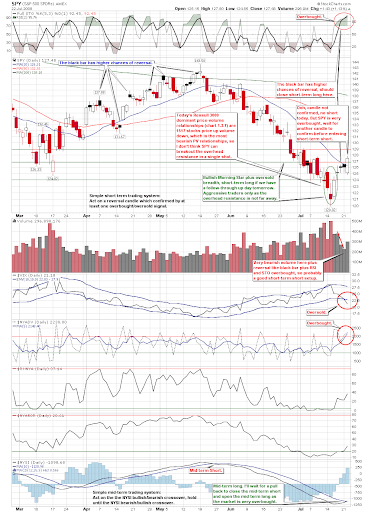
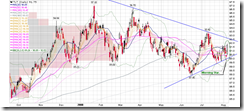
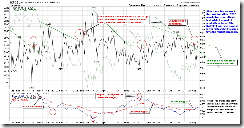
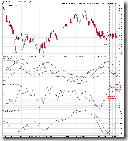
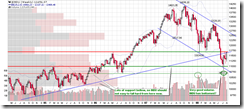
If the market had run up today, it could be a climax run and would be topped out soon. Now it pulled back and this looks quite healthy so far. On [url=http://stockcharts.com/def/servlet/Favorites.CServlet?obj=ID2393449&cmd=show[s139439402]&disp=P]0.0.1 Simple SPY Trading System[/url] there are several higher lows. As long as the low on the blue trendline is not broken, the uptrend will be still intact. Pay attention to this low if the market continues to sell off.
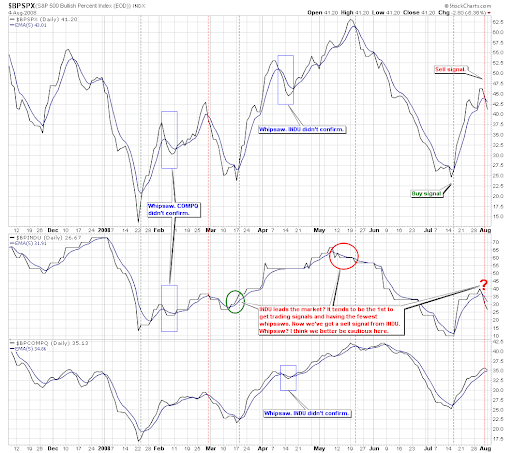
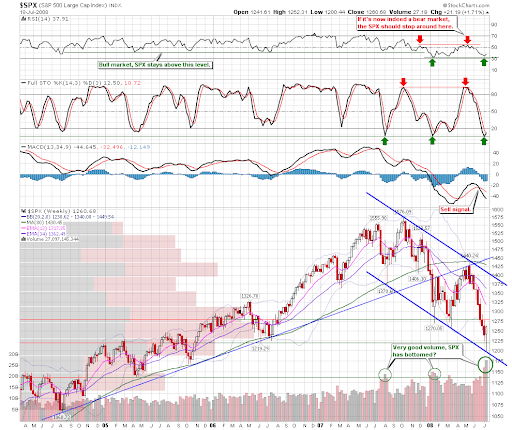
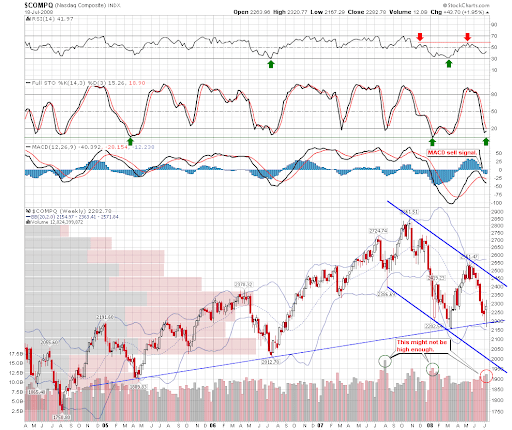
[url=http://stockcharts.com/def/servlet/Favorites.CServlet?obj=ID2393449&cmd=show[s133859547]&disp=P]1.0.9 S&P 500 Bullish Percent Index[/url], this has been proven to be a whipsaw. COMPQ does not confirm the sell signal so the mid-term signal is still buy.
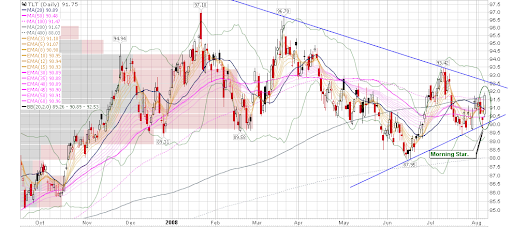
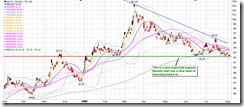
[url=http://stockcharts.com/def/servlet/Favorites.CServlet?obj=ID2393449&cmd=show[s132765947]&disp=P]3.0.3 20 Year Treasury Bond Fund iShares (TLT Daily)[/url]. This is my concern. It rallied a lot, and the candlestick is a Morning Star, which has a relatively accurate pattern. This means the bullish trend of TLT will likely be continued, and this is bearish to the stock market since the money will fly to safety and the bond market.
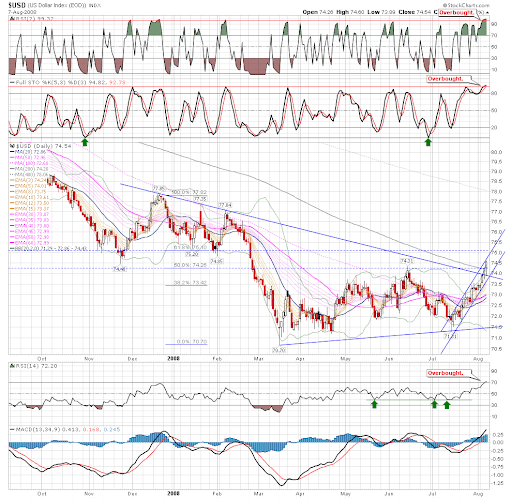
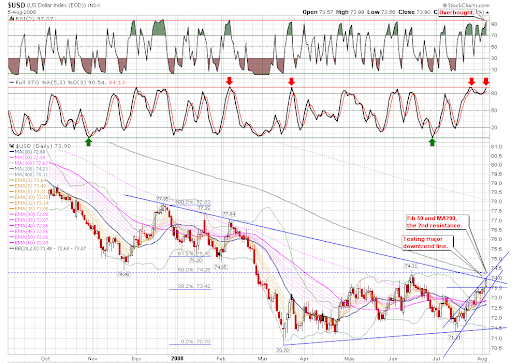
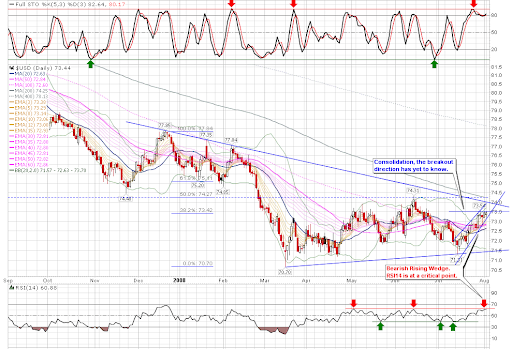
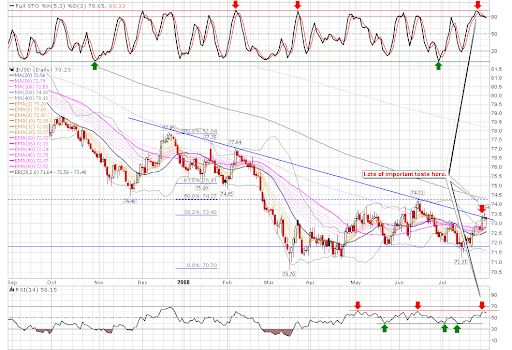
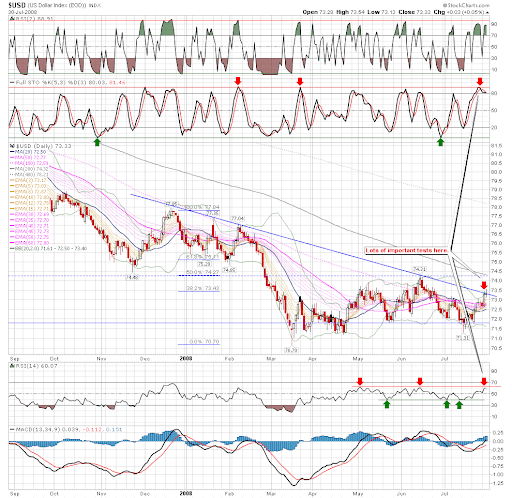
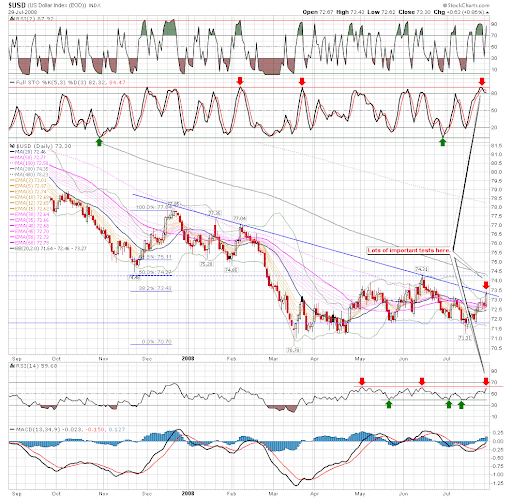
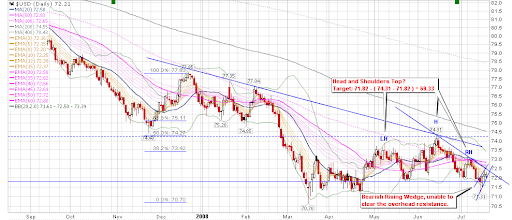
[url=http://stockcharts.com/def/servlet/Favorites.CServlet?obj=ID2393449&cmd=show[s123162280]&disp=P]3.1.0 US Dollar Index (Daily)[/url]. US dollar is invincible as expected but it is seriously overbought, especially STO has reached a record high level. This means pullback is due. In addition, oil has sold off miserably and probably needs to take a rest. This is possibly bearish to the stock market.
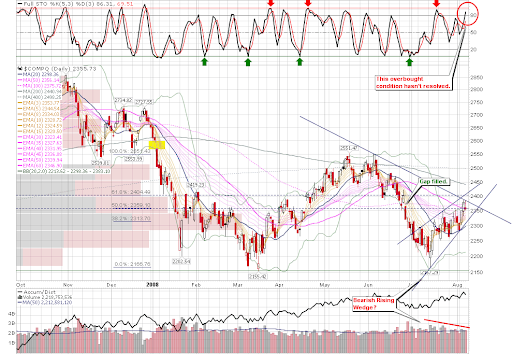
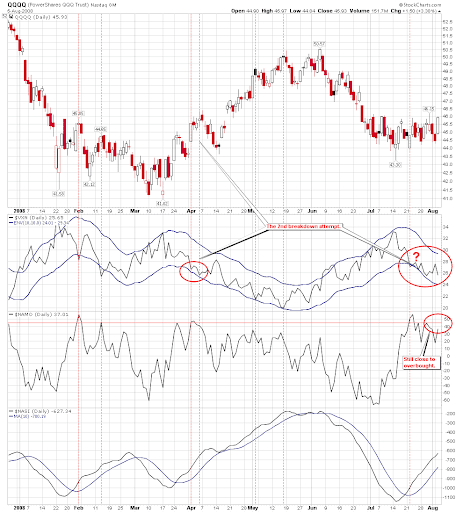
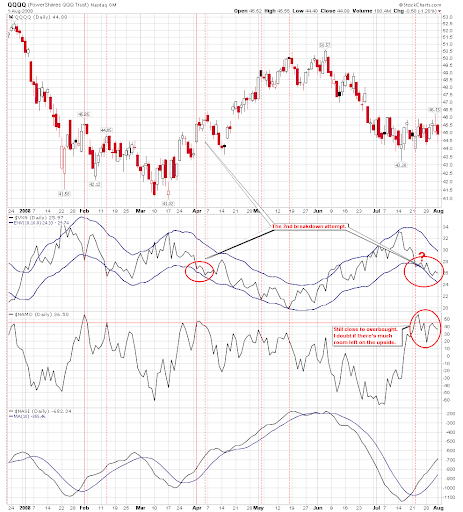
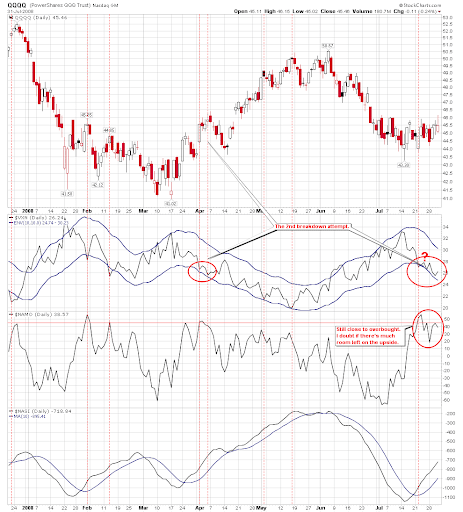
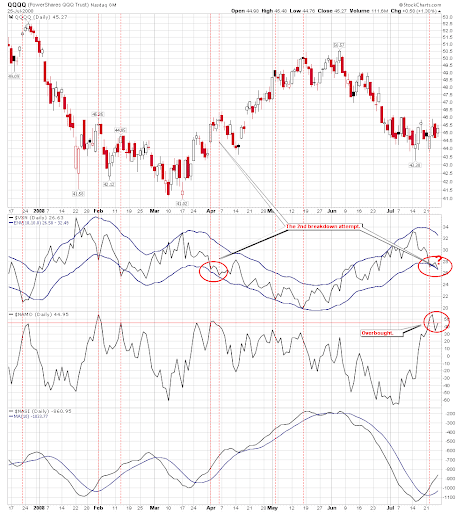
[url=http://stockcharts.com/def/servlet/Favorites.CServlet?obj=ID2393449&cmd=show[s111434698]&disp=P]1.1.0 Nasdaq Composite (Daily)[/url]. Note that STO is still quite high, so is it on [url=http://stockcharts.com/def/servlet/Favorites.CServlet?obj=ID2393449&cmd=show[s125997542]&disp=P]1.1.6 PowerShares QQQ Trust (QQQQ Daily)[/url]. Therefore I do not really believe QQQQ will go further up significantly although it was quite bullish today.
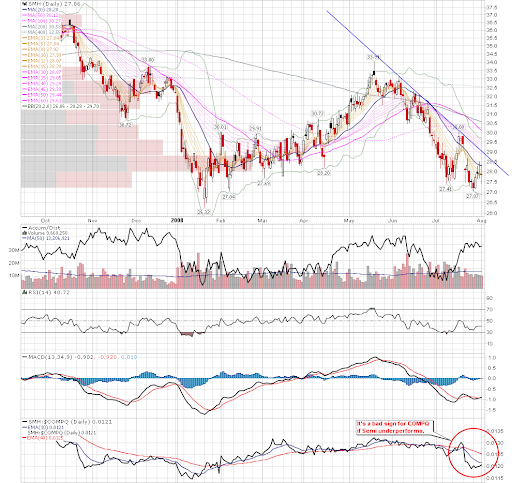
[url=http://stockcharts.com/def/servlet/Favorites.CServlet?obj=ID2393449&cmd=show[s134348165]&disp=P]1.1.4 Semiconductor Holders (SMH Daily)[/url]. Here you can see why QQQQ was so bullish. SMH broke out and got overbought as well.
As a summary, I guess the market will pull back a bit. There is no solid evidence that the big trend is changed, so the game is still buy dip, sell bounce. Of course a lower low should not be formed if the pullback continues tomorrow. On the other hand, keep an eye on [url=http://stockcharts.com/def/servlet/Favorites.CServlet?obj=ID2393449&cmd=show[s125228382]&disp=P]2.8.0 CBOE Options Equity Put/Call Ratio[/url], where $CPCE is close to the trendline again. For a more accurate $CPCE data during the trading hours (note the comment on the chart), you may refer to data on CBOE. But you have to calculate the ratio of Puts/Calls in Equity Options column manually. Usually the intraday ratio isn't so different from the ratio at the market close.
Posted by Cobra at 10:30 PM 3 comments 
Wednesday, August 6, 200808/06/2008 Market Recap: Speculation vs TA Signals
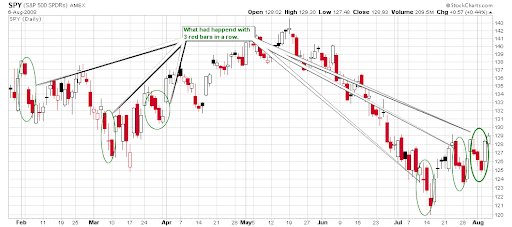
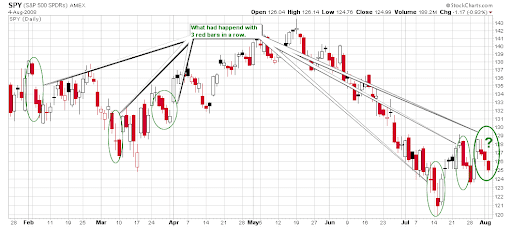
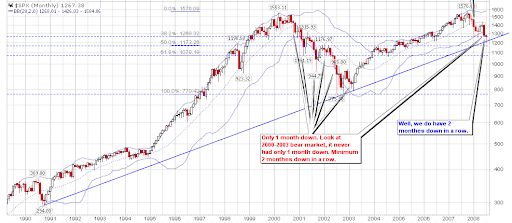
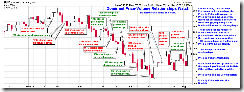
In the Monday report 08/04/2008 Market Recap, I put a chart to show what had happened when SPY down 3 days in a row. Now let us look back and see how amazing it is. Note that 3 out of 5 times the market went up for three days, and my feeling at the moment is this time the market may push up for 4 days. Well, this is just my guess, no evidence though.
Next let us review the current TA signals.
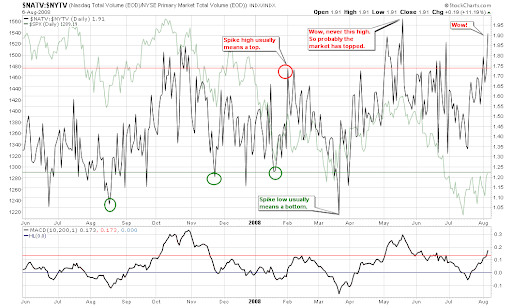
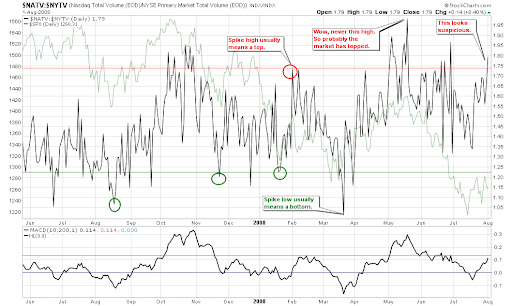
The most powerful one is the [url=http://stockcharts.com/def/servlet/Favorites.CServlet?obj=ID2393449&cmd=show[s139935158]&disp=P]2.3.4 Nasdaq Total Volume/NYSE Total Volume[/url], Wow!
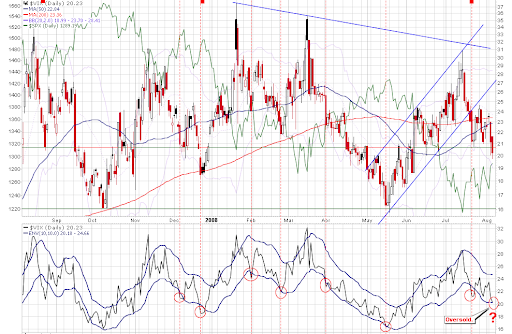
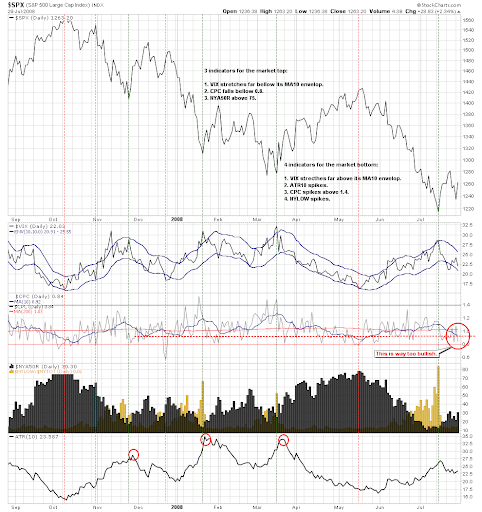
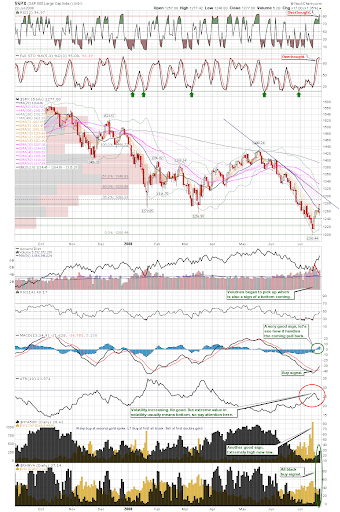
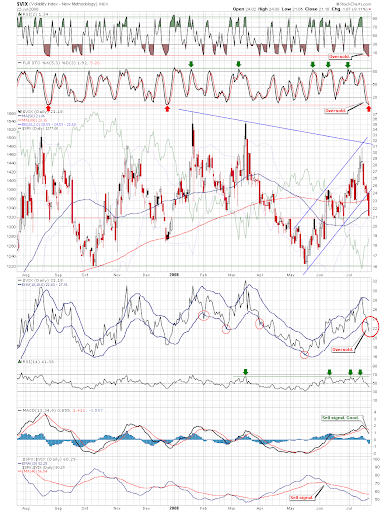
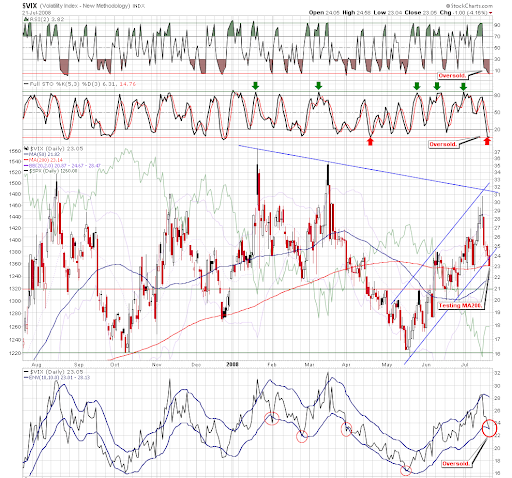
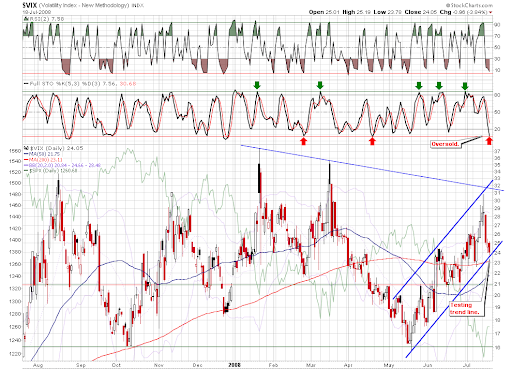
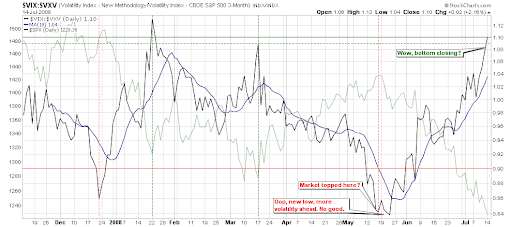
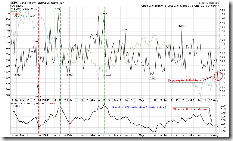
The next one is [url=http://stockcharts.com/def/servlet/Favorites.CServlet?obj=ID2393449&cmd=show[s122111957]&disp=P]2.0.0 Volatility Index - NYSE (Daily)[/url], VIX MA(10) Envelop, which is a well-know indicator, is oversold. Note the red circles connected with red dash lines, compare with the market denoted by the green lines, don't you think once the lower edge of MA(10) Envelop is broken, the green line has a high probability of pullback?
The old frield NAMO on [url=http://stockcharts.com/def/servlet/Favorites.CServlet?obj=ID2393449&cmd=show[s146618192]&disp=P]1.1.B QQQQ and VXN[/url] is going up as expected and very close to overbought region now.
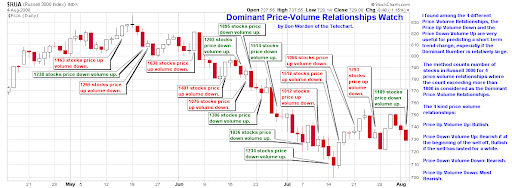
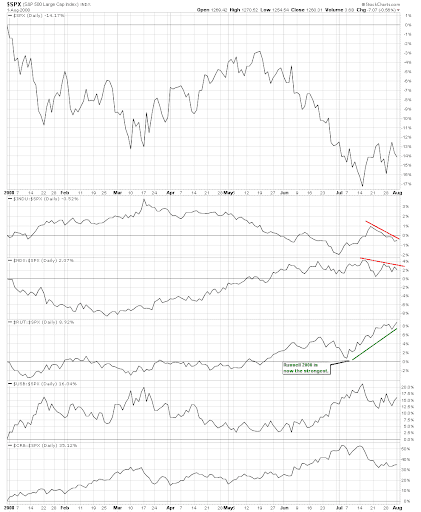
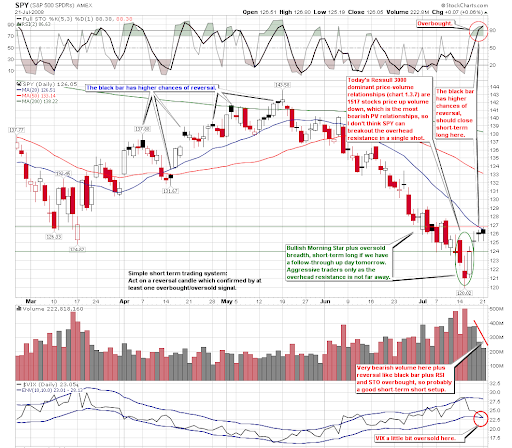
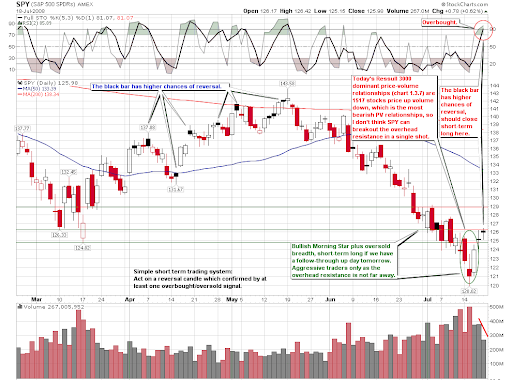
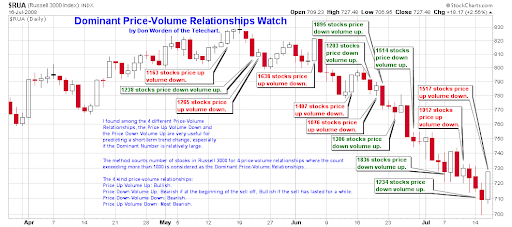
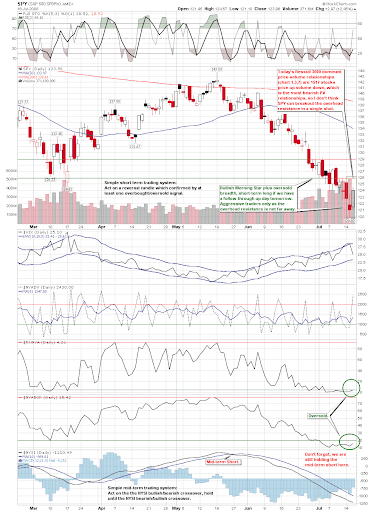
And on the [url=http://stockcharts.com/def/servlet/Favorites.CServlet?obj=ID2393449&cmd=show[s142685381]&disp=P]1.3.7 Russell 3000 Dominant Price-Volume Relationships[/url] today 1147 stocks were price up volume down, which is quite bearish. Note those red comments on the chart, the probability of getting a red candle next day is quite high.
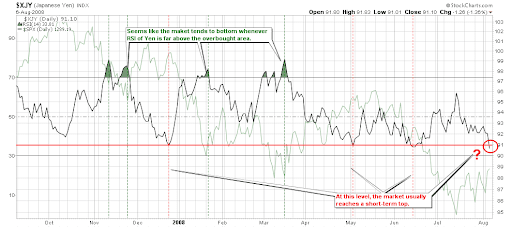
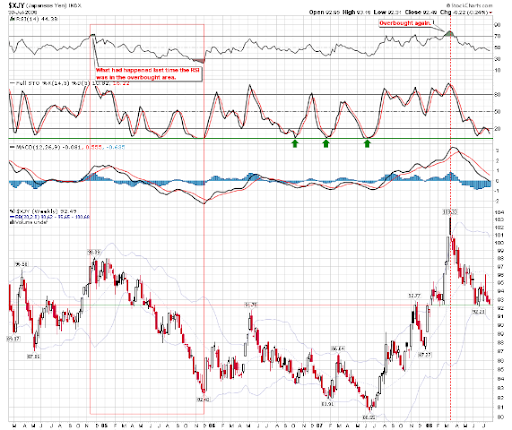
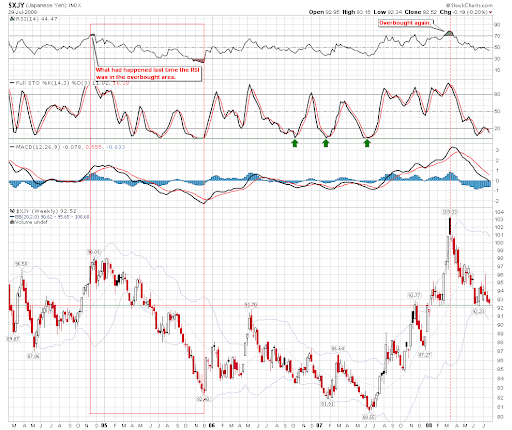
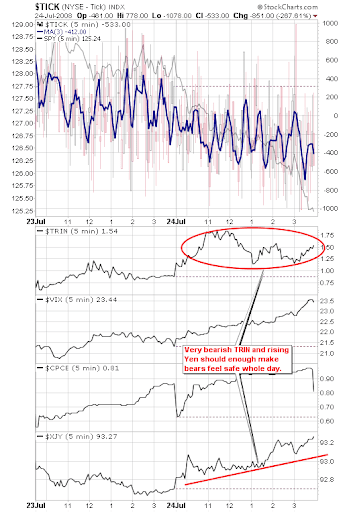
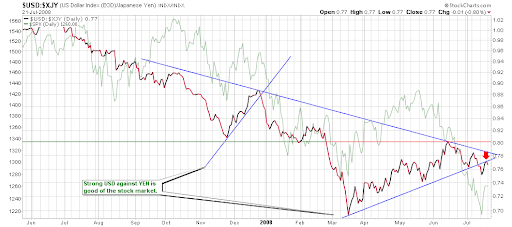
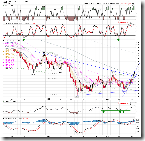
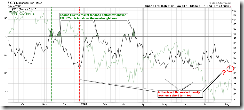
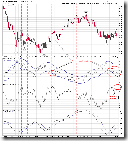
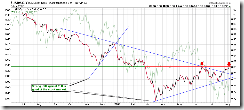
Furthermore on [url=http://stockcharts.com/def/servlet/Favorites.CServlet?obj=ID2393449&cmd=show[s144322189]&disp=P]3.2.4 Yen RSI and the Market Bottom[/url] the Japanese Yen failed the battle with the US Dollars finally. However, on the chart everytime at the red line level, the market denoted by the green line pulled back significantly. Maybe this time is different, after all the relationship between the US Dollars and the Japanese Yen has changed. On the other hand, any rule will be considered to be valid before it is disproved. Therefore this signal cannot be ignored.
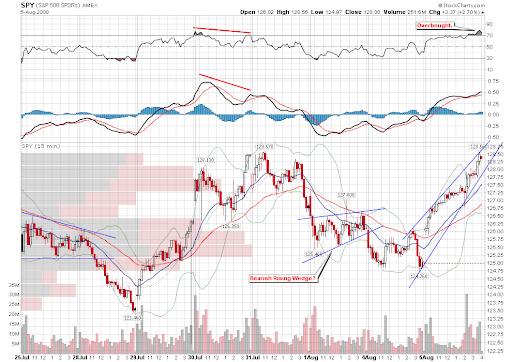
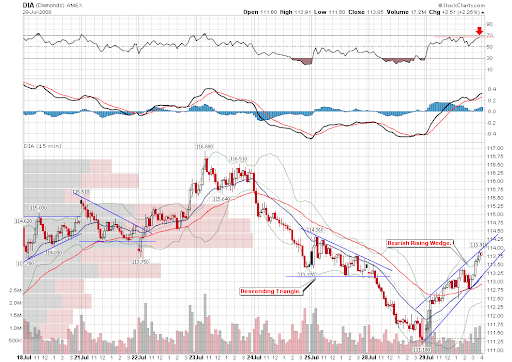
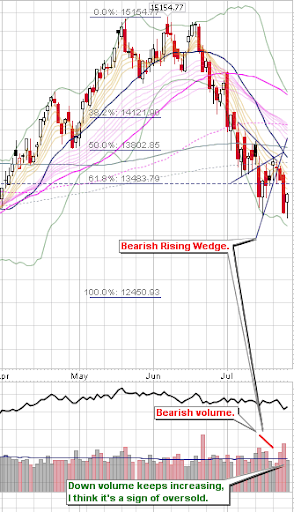
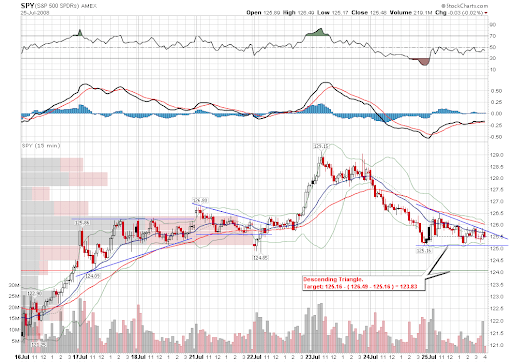
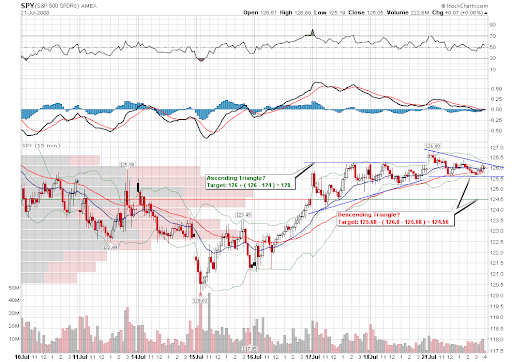
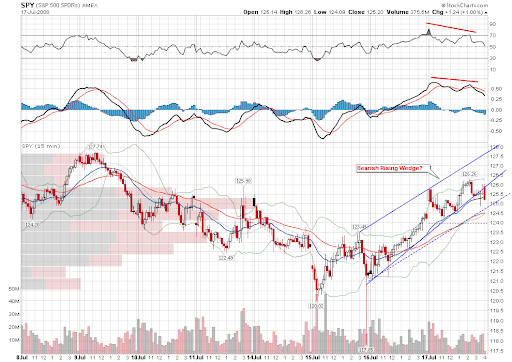
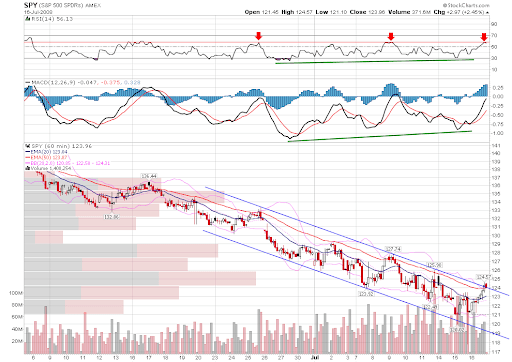
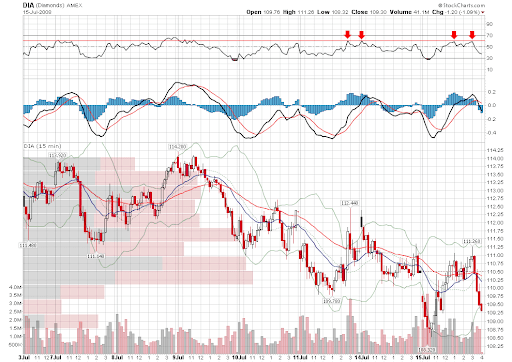
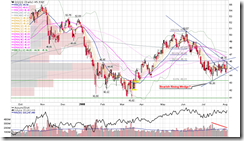
[url=http://stockcharts.com/def/servlet/Favorites.CServlet?obj=ID2393449&cmd=show[s134696784]&disp=P]1.0.4 S&P 500 SPDRs (SPY 15 min)[/url], [url=http://stockcharts.com/def/servlet/Favorites.CServlet?obj=ID2393449&cmd=show[s134697461]&disp=P]1.2.7 Diamonds (DIA 15 min)[/url]. The pattern looks like a Bearish Rising Wedge. Additionally MACD and RSI show negative divergence.
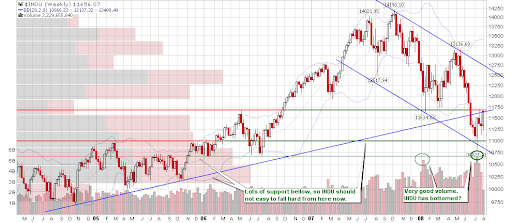
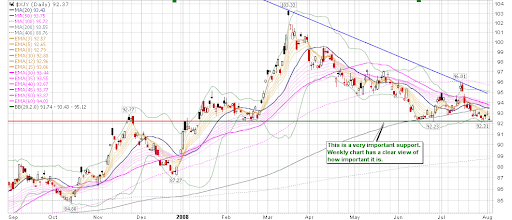
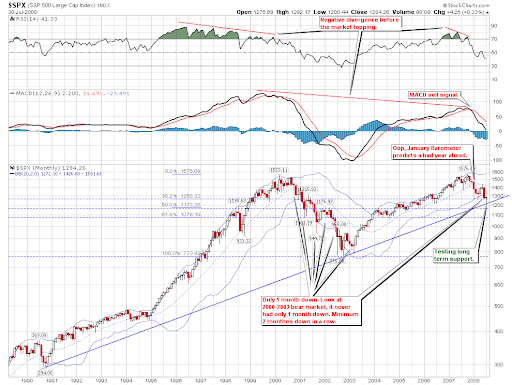
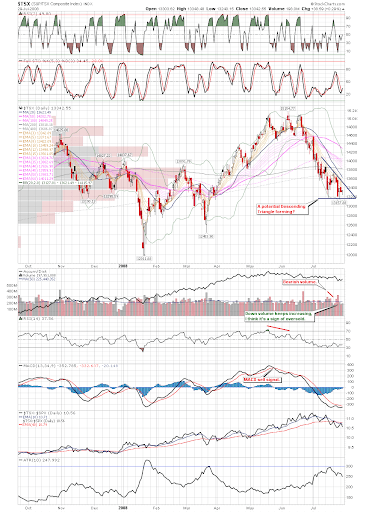
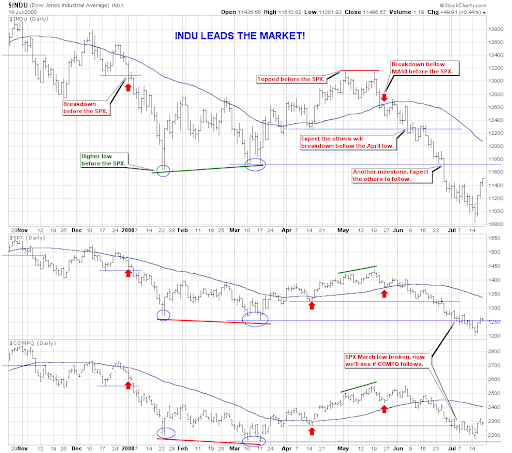
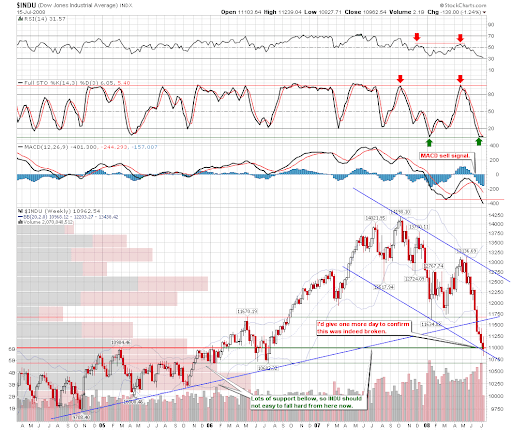
[url=http://stockcharts.com/def/servlet/Favorites.CServlet?obj=ID2393449&cmd=show[s124615261]&disp=P]1.2.1 Dow Jones Industrial Average (Weekly)[/url]. On the weekly chart you can see how tough the test is that INDU is facing.
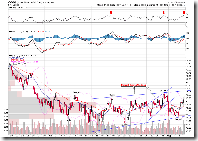
[url=http://stockcharts.com/def/servlet/Favorites.CServlet?obj=ID2393449&cmd=show[s134348165]&disp=P]1.1.4 Semiconductor Holders (SMH Daily)[/url]. The challenges it is facing have not changed, overbought, bearish volume, RSI(14) testing resistance, and here is one more red candle which has high probability of reversal. This situation is bearish to COMPQ.
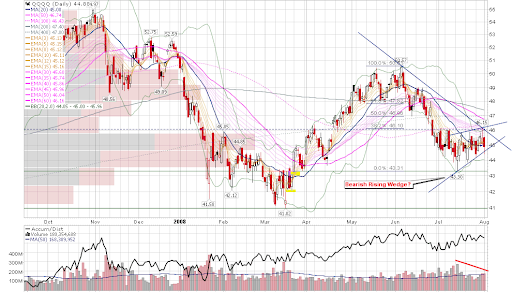
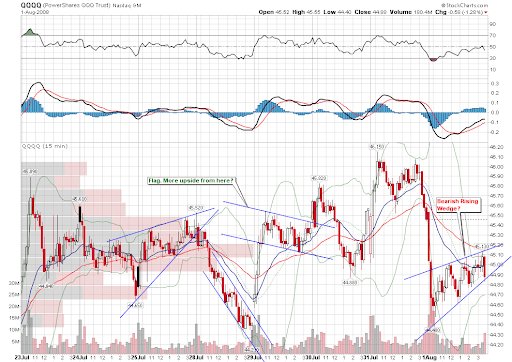
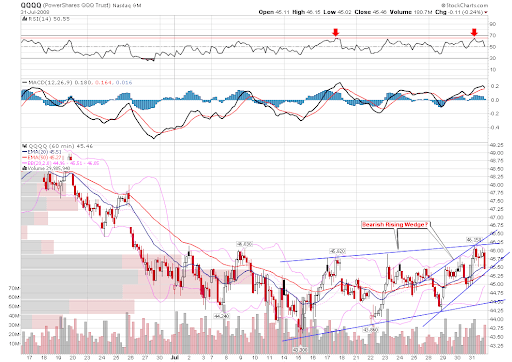
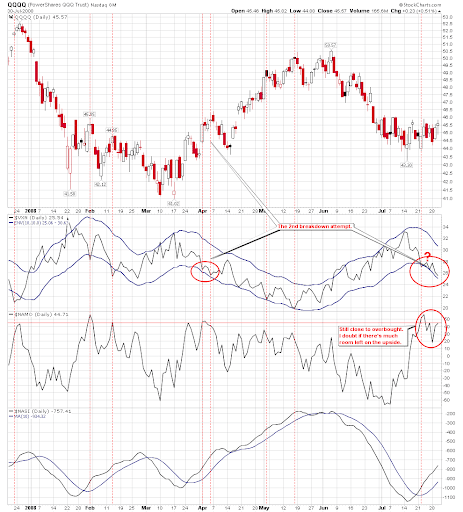
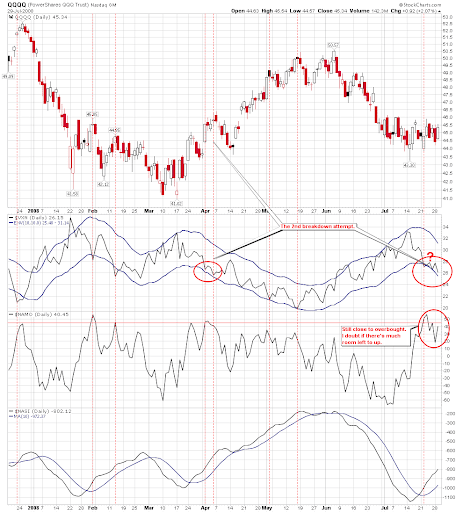
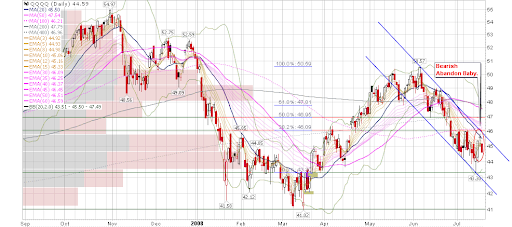
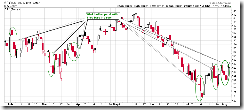
[url=http://stockcharts.com/def/servlet/Favorites.CServlet?obj=ID2393449&cmd=show[s125997542]&disp=P]1.1.6 PowerShares QQQ Trust (QQQQ Daily)[/url], yes, it is a breakout. But it is now facing the challenges by MA(50), MA(100), Fibonacci 50%, and more importantly today is price up on decreasing volume. If tomorrow it goes up further and volume still decreases, this pattern, as I said many times, has a very high probability of plunge afterward. Remember that NAMO is close to the overbought region now.
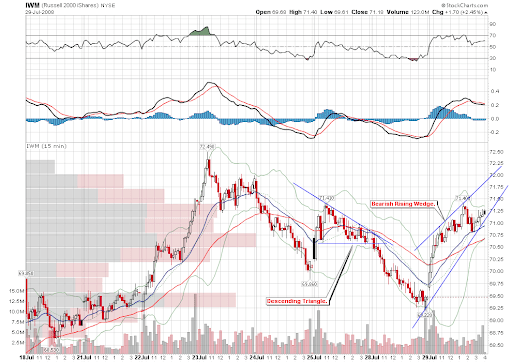
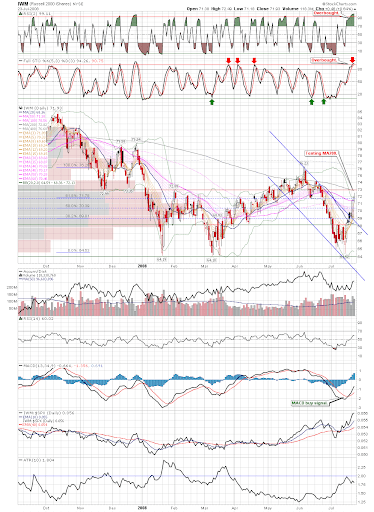
[url=http://stockcharts.com/def/servlet/Favorites.CServlet?obj=ID2393449&cmd=show[s125784160]&disp=P]1.3.0 Russell 2000 iShares (IWM Daily)[/url]. This is a breakout, too. But it is also close to the resistance. Additionally it is volume keeps decreasing on up day, too. Therefore the situation is not optimistic.
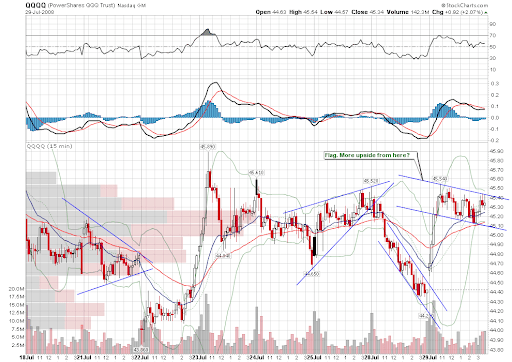
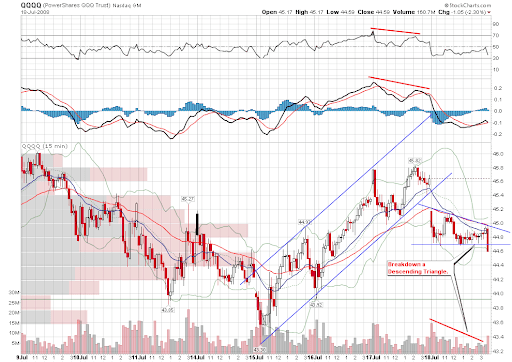
[url=http://stockcharts.com/def/servlet/Favorites.CServlet?obj=ID2393449&cmd=show[s134697338]&disp=P]1.1.A PowerShares QQQ Trust (QQQQ 15 min)[/url], [url=http://stockcharts.com/def/servlet/Favorites.CServlet?obj=ID2393449&cmd=show[s134697614]&disp=P]1.3.6 Russell 2000 iShares (IWM 15 min)[/url]. On the 15 min charts the patterns look like Bearish Rising Wedge.
According to the analysis, it is quite possible the market will pull back tomorrow. What about if it still goes up? Well, this is TA. My feeling is, as I said in the beginning, the market will go further up for 4 consecutive days, because the previous pattern is Wall Street always full of surprise. Do we believe in TA signals, or our own feelings? Let me emphasis again, TA always bet on high probability. Maybe aforementioned reasons would eventually be disproved, overbought could become more overbought. However, over the long term does our own guts have higher chance of winning than the TA signals which have been statistically validated many times in history? As a TA trader, I will strictly follow the TA signals instead of overriding TA signals by gut feelings. This is the secret of how TA can get success, which wins by long-term sustainable probability. Okay, let us take a look at 0.0.1, because of oversold VIX/MA(10) we are waiting for a reversal candle to trigger the short-term short, right?
[url=http://stockcharts.com/def/servlet/Favorites.CServlet?obj=ID2393449&cmd=show[s123162280]&disp=P]3.1.0 US Dollar Index (Daily)[/url]. USD has passed the first fence and stopped at the second fence. Now it is overbought.
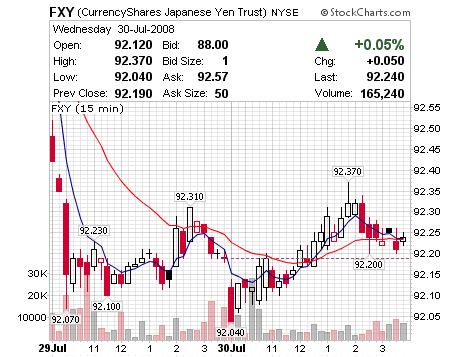
[url=http://stockcharts.com/def/servlet/Favorites.CServlet?obj=ID2393449&cmd=show[s123353198]&disp=P]3.2.0 Japanese Yen (Daily)[/url], Breakdown! But it is overbought, and both STO and RSI(14) are at the support.
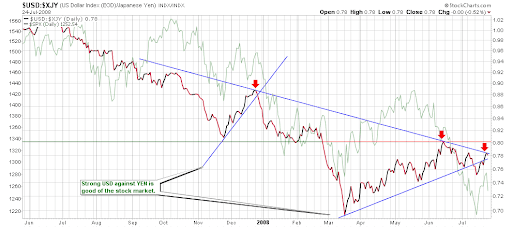
[url=http://stockcharts.com/def/servlet/Favorites.CServlet?obj=ID2393449&cmd=show[s137463038]&disp=P]3.2.3 US Dollar/Japanese Yen Ratio[/url]. Very good!

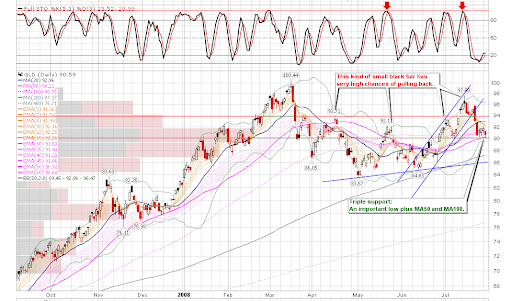
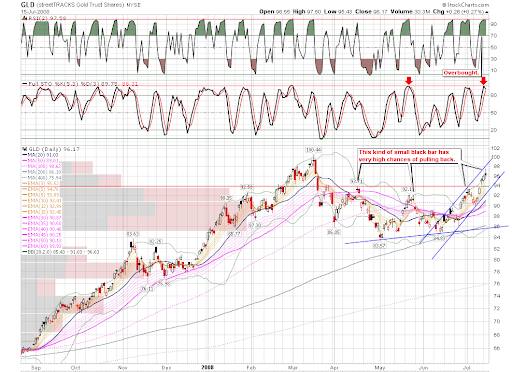
[url=http://stockcharts.com/def/servlet/Favorites.CServlet?obj=ID2393449&cmd=show[s124844123]&disp=P]3.3.0 streetTRACKS Gold Trust Shares (GLD Daily)[/url]. Today it is a black candle which has a high probability of reversal. Possible Bullish Harami formed at important support. In addition STO is on the support, too.
[url=http://stockcharts.com/def/servlet/Favorites.CServlet?obj=ID2393449&cmd=show[s126629960]&disp=P]3.3.2 streetTRACKS Gold Trust Shares (GLD 60 min)[/url], MACD divergence. It looks like a V bottom.
As a result, shouldn't GLD bounce back soon?
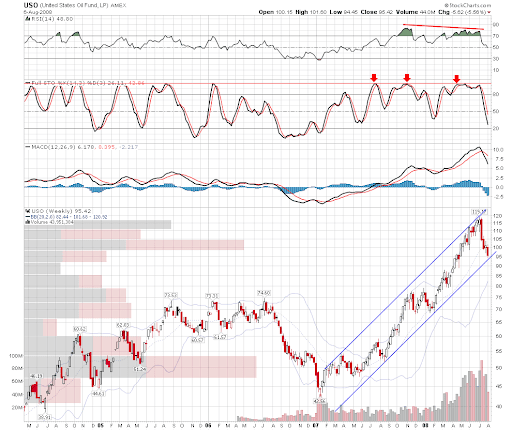
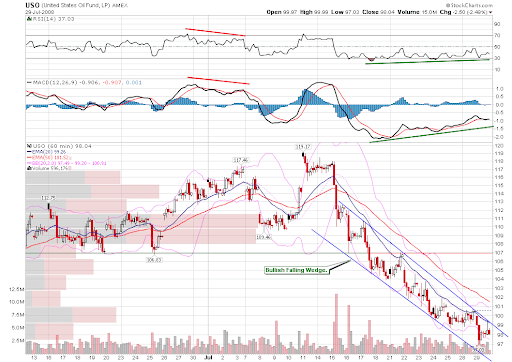
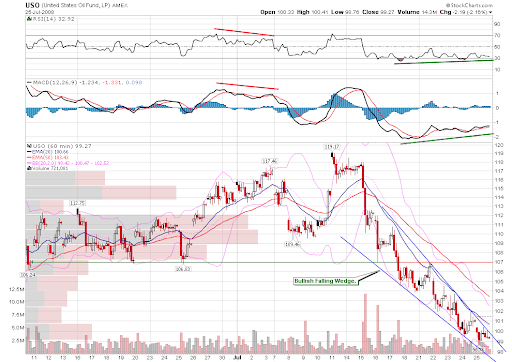
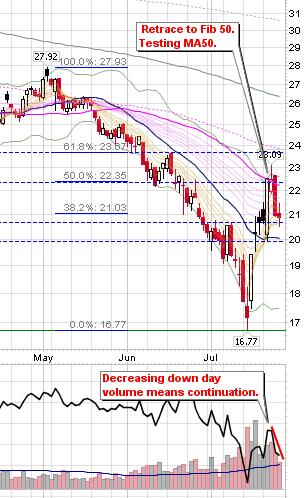
[url=http://stockcharts.com/def/servlet/Favorites.CServlet?obj=ID2393449&cmd=show[s125240869]&disp=P]3.4.1 United States Oil Fund, LP (USO Daily)[/url]. It is almost retraced to Fibonacci 50%, at where pullback usually finishes. STO is on the support, too.
[url=http://stockcharts.com/def/servlet/Favorites.CServlet?obj=ID2393449&cmd=show[s125508321]&disp=P]3.4.2 United States Oil Fund, LP (USO Weekly)[/url]. The oil is on the long term trendline, which can be seen on the weekly chart.
[url=http://stockcharts.com/def/servlet/Favorites.CServlet?obj=ID2393449&cmd=show[s126630325]&disp=P]3.4.3 United States Oil Fund, LP (USO 60 min)[/url], MACD and RSI show positive divergence.
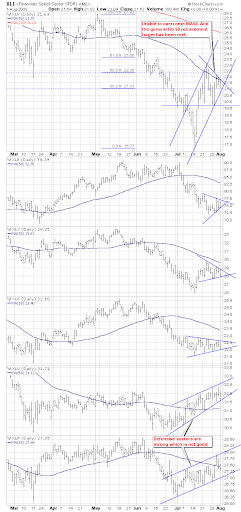
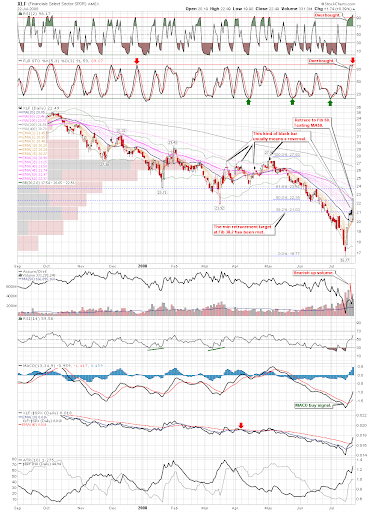
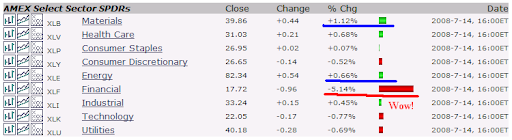
Note that [url=http://stockcharts.com/def/servlet/Favorites.CServlet?obj=ID2393449&cmd=show[s123114873]&disp=P]5.2.0 Energy Select Sector SPDR (XLE Daily)[/url] has started to bounce back. XLE usually leads the oil, so the oil will likely go up too.
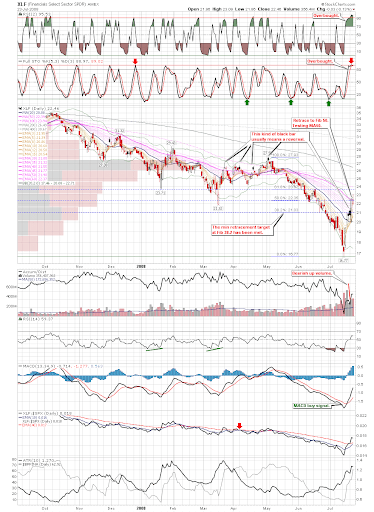
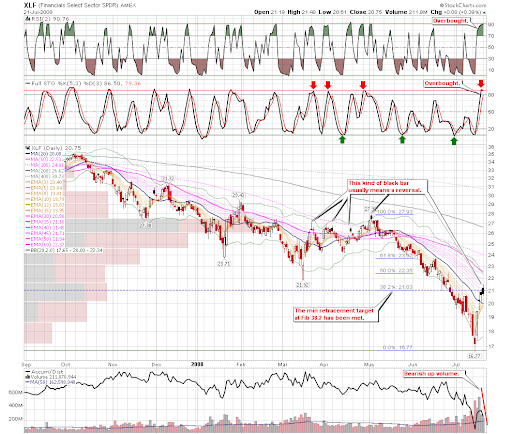
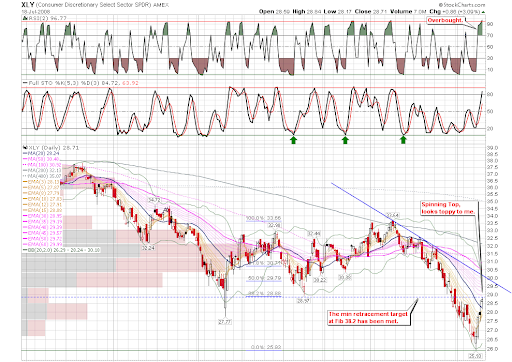
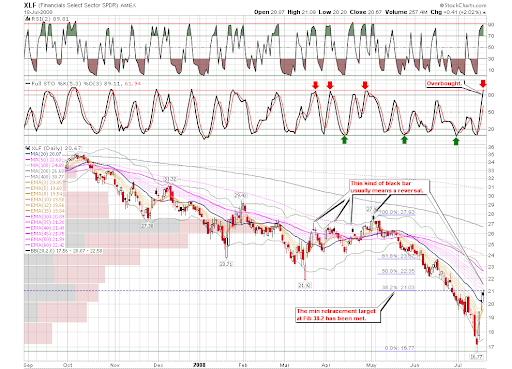
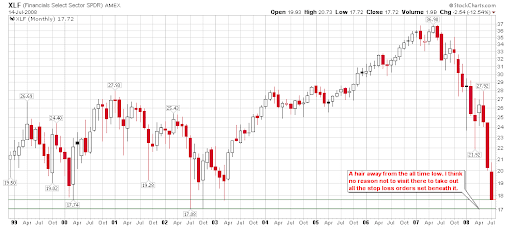
If the oil bounces back and so is the XLE, note the negative correlation between XLE and [url=http://stockcharts.com/def/servlet/Favorites.CServlet?obj=ID2393449&cmd=show[s128581358]&disp=P]5.3.0 Financials Select Sector SPDR (XLF Daily)[/url], XLF may pull back further.
Posted by Cobra at 10:17 PM 3 comments
Tuesday, August 5, 200808/05/2008 Market Recap: CPC readings are little too bullish
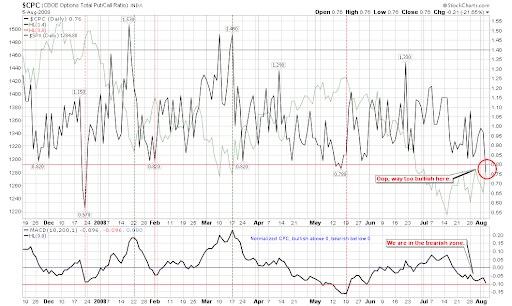
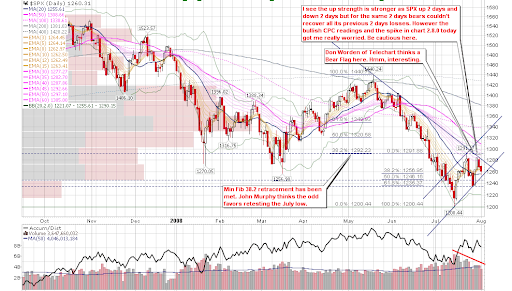
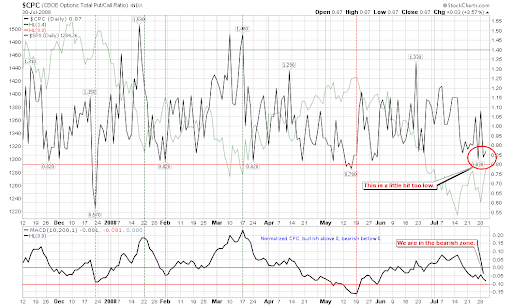
Today the market soared but there is an issue: [url=http://stockcharts.com/def/servlet/Favorites.CServlet?obj=ID2393449&cmd=show[s146756206]&disp=P]2.8.1 CBOE Options Total Put/Call Ratio[/url]. The CPC reading reached the new low this year, and the sentiment is extremely bullish. I am not saying the market is making a U-turn now, but it cannot keep bullish for very long. In term of trading practice, I think it is a nice hedge to make counter-trend short whenever the market gets overbought.
[url=http://stockcharts.com/def/servlet/Favorites.CServlet?obj=ID2393449&cmd=show[s146618192]&disp=P]1.1.B QQQQ and VXN[/url]. The old friend NAMO went up again and is close to overbought region at the moment. If tomorrow the market goes up further, short will have a high probability of success.
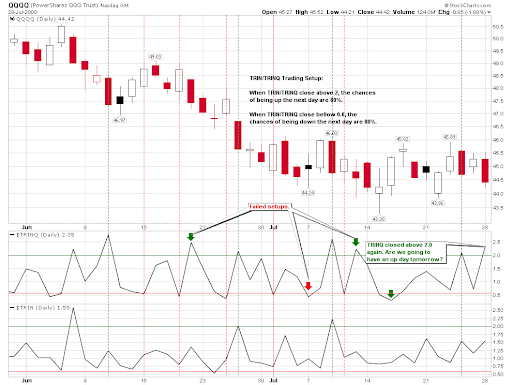
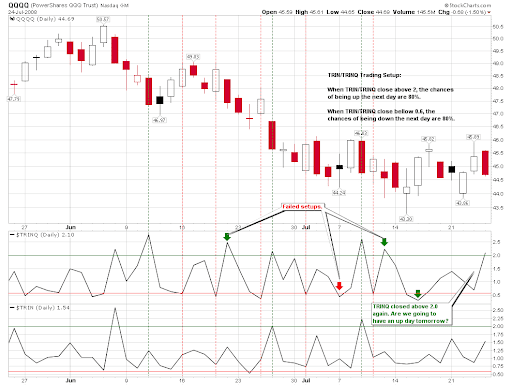
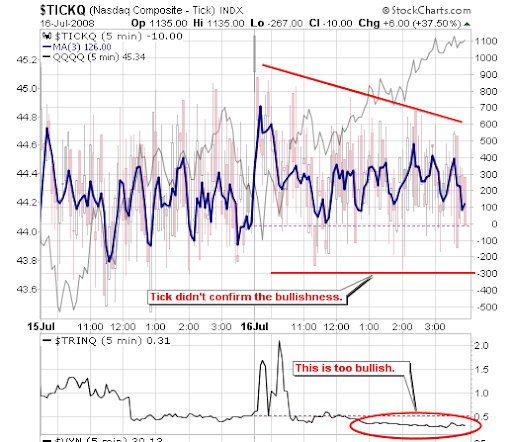
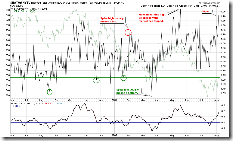
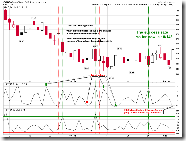
[url=http://stockcharts.com/def/servlet/Favorites.CServlet?obj=ID2393449&cmd=show[s144831686]&disp=P]1.1.C TRINQ Trading Setup[/url]. I would usually like to use an indicator once it is proved to have an edge recently and as far as it still has. According to the chart, the success rate of the TRINQ setup is 10/14, which is quite impressive. So I do think today's reading 0.32 is over bullish, and tomorrow the market will likely go down.
[url=http://stockcharts.com/def/servlet/Favorites.CServlet?obj=ID2393449&cmd=show[s134696784]&disp=P]1.0.4 S&P 500 SPDRs (SPY 15 min)[/url], [url=http://stockcharts.com/def/servlet/Favorites.CServlet?obj=ID2393449&cmd=show[s134697338]&disp=P]1.1.A PowerShares QQQ Trust (QQQQ 15 min)[/url], [url=http://stockcharts.com/def/servlet/Favorites.CServlet?obj=ID2393449&cmd=show[s134697461]&disp=P]1.2.7 Diamonds (DIA 15 min)[/url]. The 15-min chart of all three major indices are overbought now. According to my experience, the market will unlikely rally up significantly considered the RSI at such a high level.
[url=http://stockcharts.com/def/servlet/Favorites.CServlet?obj=ID2393449&cmd=show[s125997542]&disp=P]1.1.6 PowerShares QQQ Trust (QQQQ Daily)[/url]. This is still Bearish Rising Wedge. Note that the volume is confirming this pattern.
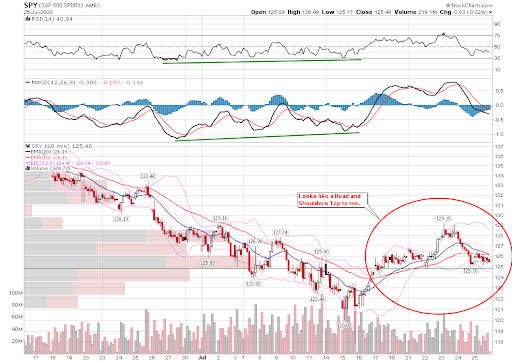
[url=http://stockcharts.com/def/servlet/Favorites.CServlet?obj=ID2393449&cmd=show[s126618051]&disp=P]1.1.8 PowerShares QQQ Trust (QQQQ 60 min)[/url]. Note the resistance on the RSI indicator.
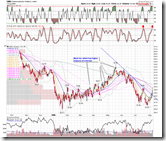
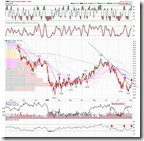
[url=http://stockcharts.com/def/servlet/Favorites.CServlet?obj=ID2393449&cmd=show[s134348165]&disp=P]1.1.4 Semiconductor Holders (SMH Daily)[/url]. The important component of Nasdaq is overbought and testing the major downtrend line. In addition, the volume is quite bearish, and RSI(14) is testing the resistance, too.
As a summary, it will be a good chance to short if QQQQ does not pull back tomorrow.
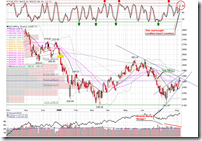
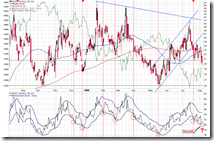
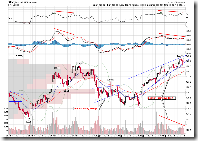
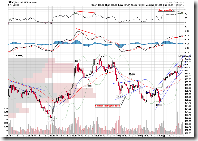
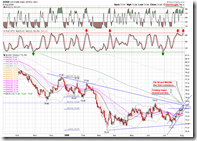
[url=http://stockcharts.com/def/servlet/Favorites.CServlet?obj=ID2393449&cmd=show[s123162280]&disp=P]3.1.0 US Dollar Index (Daily)[/url]. The US dollar is super strong, but it is getting tough test -- major downtrend line, RSI(2) overbought, and STO got back to the resistance. Even it passes the test, Fibonacci 50% and MA(200) are waiting right ahead. Considering that the US dollar is overbought, it could be tough to pass both tests. Anyway the market is invincible, and I am merely human. Although it looks unlikely or probably hopeless, you never know.
[url=http://stockcharts.com/def/servlet/Favorites.CServlet?obj=ID2393449&cmd=show[s123353198]&disp=P]3.2.0 Japanese Yen (Daily)[/url]. The Japanese Yen is very strong and still on the major support.
[url=http://stockcharts.com/def/servlet/Favorites.CServlet?obj=ID2393449&cmd=show[s137463038]&disp=P]3.2.3 US Dollar/Japanese Yen Ratio[/url]. The battle between US dollar and Japanese Yen is at a key point, and the resistance is significant.
Usually aforementioned factors mean the market is due for a pullback.
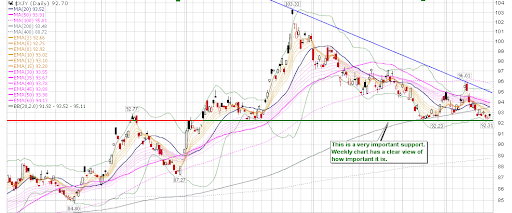
[url=http://stockcharts.com/def/servlet/Favorites.CServlet?obj=ID2393449&cmd=show[s124844123]&disp=P]3.3.0 streetTRACKS Gold Trust Shares (GLD Daily)[/url], the GLD is oversold. On the weekly chart [url=http://stockcharts.com/def/servlet/Favorites.CServlet?obj=ID2393449&cmd=show[s125507178]&disp=P]3.3.1 streetTRACKS Gold Trust Shares (GLD Weekly)[/url] RSI is already on the support.
Posted by Cobra at 10:21 PM 0 comments
Newer Posts Older Posts Home |
|
|
 [复制链接]