搜索
楼主: hefeiddd

一个笨蛋的股指交易记录-------地狱级炒手

  [复制链接]
 楼主| 发表于 2009-3-21 11:12 | 显示全部楼层
Tuesday, June 20, 2006Watch List - BRCM, FFIV, JCOM, CTXS, NEW
I see a lot of bullish setups tonight. Here are some of my favourites. Now if all the other bulls out there are feeling the same way, we might be able to make some real money going long again. Click on the charts to read my notes.


[url=][/url]
Posted by Jamie at 6/20/2006 10:00:00 PM 0 comments


NASDAQ Technical Picture
It feels like the summer doldrums because neither the bears nor the bulls are trying very hard here. If the bulls don't step up soon, we're going to retest the June lows. There's a real lack of leadership in tech land. I'd like to see the semis do something here.

Enough of that, here is Mike Ashbaugh's take on the markets.

[url=][/url]
Posted by Jamie at 6/20/2006 08:53:00 PM 0 comments


Three Day Consolidation Breakout Failure - PAYX
I'm posting this trade to show what happens when I ignore my own trading rules. I knew going into the trade that there wasn't enough volume to support the three consolidation breakout, but I took the low risk entry anyway. So I got what I deserved, a stop out.

[url=][/url]
Posted by Jamie at 6/20/2006 08:36:00 PM 0 comments


Swing Trade - AMGN, BRCM
I covered the balance of my AMGN trade at the 10:00 reversal as it tested its May 2nd low. There's a lot of support at this level dating back to Jan. 2005 so I didn't want to take a chance. We'll see if breaks down tomorrow.


As per last night's watch list, BRCM filled its Thursday morning gap in the first 15 minutes of trade. A quick check back 15 minutes later and it was still holding, so I decided to get long. I exited 50% when it stalled at resistance. I'm swinging the balance into tomorrow. My stop is currently set just pennies below the afternoon low. I may adjust it tomorrow morning in the pre-market. I like the setup on the daily view as today's session closed with a small lower shadow. However, I will watch it closely on the open. If it can't break today's high in the early going, I'll exit my position.

[url=][/url]
Posted by Jamie at 6/20/2006 08:02:00 PM 0 comments
金币:
奖励:
热心:
注册时间:
2006-7-3

回复 使用道具 举报

 楼主| 发表于 2009-3-21 11:13 | 显示全部楼层
Monday, June 19, 2006Watch List - FLSH, CERN, BRCM
Despite a higher low, followed by a higher high, $30.00 looks like formidable resistance for FLSH, given the current environment.

CERN has trendline support in the $37.00 area. However, if the trendline doesn't hold, it may setup yet another shorting opportunity.

BRCM is pulling back to Thursday's gap support. It may bounce once the gap is filled. If weakness persists, we have another level of support at $30.00.

[url=][/url]
Posted by Jamie at 6/19/2006 10:24:00 PM 0 comments


NASDAQ Technical Picture
A lack of leadership following Thursday's bullish wide range bounce is being followed up by a slow give back. The best the bulls can hope for now is a higher low. Today's tech weakness was lead by networking and biotech stocks. On the broader markets, weakness in commodities, gold, and the energy sectors paced the way. Bearish momentum is waning but until a leadership group steps up for the bulls, we continue to flounder.

[url=][/url]
Posted by Jamie at 6/19/2006 08:16:00 PM 0 comments


Swing Trade - AMGN
Of the 20 odd stocks I track on my Web Trader, AMGN was the weakest. It broke support right out of the gate and was struggling for a retest. I decided to short as the 10 period EMA came swooning down. I set my stop 10 cents above the support break. I covered 50% after a 1 pt. gain and I'm swinging the balance with a stop at $66.10.

[url=][/url]
Posted by Jamie at 6/19/2006 08:01:00 PM 0 comments


Sunday, June 18, 2006Trendline Support - 5 Minute View - PAYX, KLAC
PAYX


KLAC


[url=][/url]
Posted by Jamie at 6/18/2006 11:32:00 PM 0 comments


Watch List - KLAC, FFIV, GENZ
KLAC looks like it setting up to close its bearish resistance very shortly, so I'm keeping it on my watch list this week.
FFIV has positive divergence after a steep fall. The bullish gap support has been filled and FFIV looks like it could go into a trading range at this level as the ADX line has flattened. I would like to pick this one up on the first higher low.

Since bottoming in mid May, GENZ has made a series of higher lows and closed it bearish gap. The ADX is crossong over and looks poised to start moving up, adding to the bullish momentum from a nicely formed base. I plan to buy as close as possible to the rising trendline.

[url=][/url]
Posted by Jamie at 6/18/2006 10:39:00 PM 0 comments


Saturday, June 17, 2006Healthcare Sector - Bullish Base or Bearish Pause? CI, AET, UNH
From early 2006, the RSI on the $IXV chart started making lower RSI tops as price continued to make higher highs, creating a negative divergence. In late March the sector broke its trendline and took a steep fall which bottomed in late May. Since that time we have been in a trading range. If we use the RSI to measure the overall sector sentiment, we are still in bear market mode assuming the RSI uses 50-45 as support in a bull market and 50-55 as resistance in a bear market. You can use the trading range for short-term buying and selling, however, until sentiment turns bullish, there is a greater chance, that the sector will break the range to the downside with another wave of selling in the near-term. As long as the ADX line is moving down, the trading range remains intact, however, if it starts to flatten or curl up, get ready for the next wave.

Here are some sector names of interest - CI, AET, and UNH. All of them have RSI readings below 50 and they are all trading in a range after a big fall. Read the chart notes for stock specifics.


Click on charts for larger views and chart notes.


[url=][/url]
Posted by Jamie at 6/17/2006 08:35:00 PM 2 comments


Newer Posts Older Posts Home
金币:
奖励:
热心:
注册时间:
2006-7-3

回复 使用道具 举报

 楼主| 发表于 2009-3-21 11:13 | 显示全部楼层
Friday, June 16, 2006Sharp Bounce from Mid-Week Lows - PAYX, NEW, NIHD


[url=][/url]
Posted by Jamie at 6/16/2006 11:02:00 PM 0 comments


NASDAQ Technical Picture
Today's narrow range bar was contained in the upper half of Thursday's wide range bullish bar and so the corrective bounce remains intact. The technicals show positive divergence versus this week's lower prices. Consequently, we can assume that we have made an interim low and that further upside is likely in the short-term.

[url=][/url]
Posted by Jamie at 6/16/2006 09:53:00 PM 0 comments


Thursday, June 15, 2006NASDAQ Technical Picture


A refreshing broad based rally off of positive econmic data and a relatively relaxed Fed chair. Yesterday's base was enough to bring buyers back in a big way today. The NASDAQ gapped up on the open and never looked back. We had two distinct waves of buying from pre-market until 11:30 and the again from 1:30 EST until the close. The SOX paced the way but all major tech sectors participated in a big way. The NDX heatmap is almost all green with AKAM, NVDA and JOYG all adding 8%+ on the day.

The NAMO and NA50 charts both show that the last two trading days have brought buyers back into the equity market. Resistance is just overhead so we may consolidate some of these gains early next week. Tomorrow is triple witching options expiration and if today is a good indicator, it could be less volatile than usual. Good trading to all those who participate!

[url=][/url]
Posted by Jamie at 6/15/2006 09:15:00 PM 0 comments


Trade of the Day - BRCM, AAPL
As per last night's watch list, I placed two buy orders on BRCM before leaving for work around 8:30. The first was a buy stop order $0.05 above the pre-market high at that time. The second was a buy limit order along the path of the trendline at $30.50. The first order was filled on the open, the second obviously didn't come close because the market opened strong and never looked back. There was no reversal between 10:00 and 10:15 so I knew this was going to be one of those days when the market just keeps going up with little or no pullbacks. My only regret was that I only had one open position on such a bullish day.

AAPL and AMGN were the only two laggards on my Web Trader screen this morning, so when I noticed AAPL was finally in the green in early afternoon, I checked the stockchart and saw a visible uptick in volume. I waited till price was crossing $58.00 and took a chance. As you can see from the chart, it paid off nicely.

[url=][/url]
Posted by Jamie at 6/15/2006 08:25:00 PM 0 comments

金币:
奖励:
热心:
注册时间:
2006-7-3

回复 使用道具 举报

 楼主| 发表于 2009-3-21 11:14 | 显示全部楼层
Wednesday, June 14, 2006Watch List - CMCSK, NVDA, BRCM
CMCSK is forming a bullish flag pattern which held support on a closing basis today.


If the SOX continues to bounce, NVDA is well positioned to retest its broken trendline.

If semis continue to rally, BRCM should get a nice bounce here after all this selling. Look for an uptick in volume to move price above this consolidation range. But, if it can't close above the 10 day EMA, it will be a perfect setup for the next leg down.

The 60 minute view shows a nice shallow base and a series of higher lows. Watch the ADX as it appears poised to crossover.


[url=][/url]
Posted by Jamie at 6/14/2006 10:31:00 PM 5 comments


NASDAQ Technical Picture


The CPI data was as weak as expected and confirmed inflation fears already priced into the market. The NASDAQ didn't rally off of the news, it just sort of consolidated some of yesterday's loss on much lower volume. The SOX was the best performing tech sector. The chart technicals still support further downside and until we get more buyers to participate, it remains a very difficult environment to trade in.

Friday is the quarterly options expiration which has come to be known as the triple witching expiration day. It should provide a lot of volume and I'll be watching from the sidelines.

[url=][/url]
Posted by Jamie at 6/14/2006 08:22:00 PM 0 comments


No Trade of the Day
I didn't take any trades today. The CPI data was really weak and Qs made a series of lower highs in the morning. It started to feel like a repeat of yesterday. The only good thing I can say about today is that it seems like we are starting to carve out a base.

[url=][/url]
Posted by Jamie at 6/14/2006 08:15:00 PM 0 comments


Tuesday, June 13, 2006Watch List - TEK, CTXS
If we happen to get a bounce tomorrow, TEK is a good long candidate. It is holding long-term support and volume has been getting an uptick on bullish days throughout the month of June. Also, we have some positive divergence in the RSI. TEK reports earnings June 22nd.

Again, on the off chance of a bounce tomorrow, CTXS looks well positioned to rally off of support after forming a doji reversal type bar. Target $37.00.

[url=][/url]
Posted by Jamie at 6/13/2006 11:10:00 PM 2 comments


NASDAQ Technical Picture


The market tried to rally off of the slightly lower than expected PPI data this morning, but couldn't find any momentum and ended making a series of lower highs and finally slipped lower midday. Again, all major tech sectors ended the day in the red. Today's lower close took place on significantly higher volume which supports what I said last night, as we get deeper into this second wave of selling, bearish momentum could turn into panic selling.

I'm going to keep posting the NAMO (McClellan oscillator) and NAA50 (Nasdaq stocks above 50 MA) charts every night until we see a change in direction. Only 15% of NASDAQ stocks are trading above the all important 50 MA.

And if you think the American markets are having a rough ride, have a look below at how we fared today in Canada. The TSX is heavily weighted in oil, natural gas and commodities. We shed almost 300 pts or 2.6% and selling momentum, as measured by the ADX line, is accelerating.


[url=][/url]
Posted by Jamie at 6/13/2006 07:58:00 PM 2 comments


Trade of the Day - NEW
As per last night's watch list, NEW slid through support on the open like a hot knife through butter. Within the first 15 minutes it had filled a bullish gap dating back to March 16th and then it bounced. I shorted it on that first bounce at $43.44. A quick check at 11:00 EST saw the stock trading sideways after hitting $42.00 so I covered 50% and lowered my stop to $43.00. The afternoon weakness saw the stock challenge its next bullish gap support at $41.00. I covered the balance of the position into the close because after three consecutive closes at or near the lows of each day, I think NEW may be due for some consolidation.

[url=][/url]
Posted by Jamie at 6/13/2006 07:09:00 PM 0 comments


Newer Posts Older Posts Home
金币:
奖励:
热心:
注册时间:
2006-7-3

回复 使用道具 举报

 楼主| 发表于 2009-3-21 11:15 | 显示全部楼层
Monday, June 12, 2006Watch List - NEW


I'm not sure if this setup qualifies as a H&S top, but nonetheless, the technicals for NEW are very bearish here and I will be short if it breaks $44.00 with decent volume.

[url=][/url]
Posted by Jamie at 6/12/2006 10:04:00 PM 0 comments


NASDAQ Technical Picture
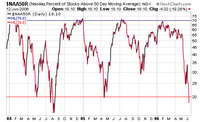


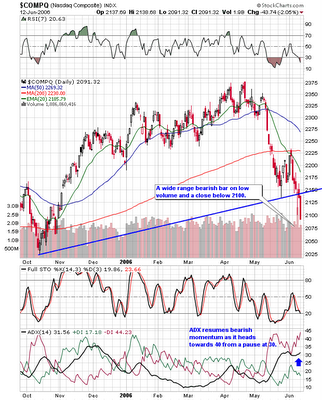
The NASDAQ shed 44 points on relatively low volume and closed below 2100. From the NASDAQ chart above we can see that the ADX line is curling up and likely heading towards 40 from 30 which will really add to the bearish momentum. If this happens we could start seeing some panic selling. All tech sectors ended the day in the red with networking stocks leading the fall, chalking up a 4.7% loss on the day. If we can't bounce here, the next level of support is in the 2050-60 area. From the NAMO and NA50 charts above, we can see that we are deeply oversold and that less than 20% of NDX stocks are trading above their 50 day MAs. Today's NDX heatmap is covered in red with only a handful of names closing above breakeven.

Tomorrow's economic data may shed some light - PPI and retail sales, and Wednesday we get the release of the CPI. Friday is options expiration so it will be interesting to see how we end the week. I'm going to guess lower because it appears to be a losing proposition with respect to the economic data. It's very unlikely that the data will not confirm inflation fears and even if they are slightly dovish, BB is taking the market down anyway.

[url=][/url]
Posted by Jamie at 6/12/2006 08:29:00 PM 0 comments


Trade of the Day - QQQQ
The Qs gapped up in pre-market on low volume. The setup for the short was a confirmed break of the pre-market low. I shorted the Qs at $38.10 and set my stop 10 cents above the pre-market high. At 1:00 EST I lowered my stop to breakeven. A weak afternoon made the trade a winner - good for $0.65. This was my only trade today. Monday's are usually difficult and good setups are often hard to find.

[url=][/url]
Posted by Jamie at 6/12/2006 07:44:00 PM 0 comments


Watch List - QSII, CERN, CELG


Along with the usual suspects I'm also watching CERN and QSII for a possible change in trend direction. QSII came out with a strong earnings report at the end of last week and gapped up. Let's see if the ADX line can break resistance here for a potential swing trade. CERN seems to be in the process of forming a base and its ADX is fast approaching a potential crossover.

CELG has a very low ADX reading despite higher prices. This type of divergence usually foreshadows an explosive move.

[url=][/url]
Posted by Jamie at 6/12/2006 07:08:00 AM 0 comments


Sunday, June 11, 2006Average Directional Index - ADX - Momentum Oscillator
Developed by J. Welles Wilder to measure the strength of the current trend.

Components: +DI, -DI, and ADX. +DI is the positive directional indicator, -DI is the negative directional indicator and the ADX line combines the two with a 14 day moving average to provide the overall trend strength.

The trend strength is measured on a scale of 0-100. Readings below 10 and above 60 are rare. The higher the reading, the stronger the trend.

How can you use the ADX in your trading? Assuming you are looking to buy stocks (either long or short) which have momentum building, you will always look to buy stocks with a rising ADX line. Momentum usually starts to build as the ADX line crosses above 15-20 and continues to strengthen until the ADX line flattens or reverses downwards.

Let's start by looking at a few daily charts on trending stocks from the recent past.

The first chart is a daily view of CMCSK, which has had a lot of bullish momentum lately, despite the weak markets.


Notice how the ADX line (black line) dipped lower in Feb. when price was holding support at $26.00 than it was in Dec. at the same price levels. When the ADX dips lower and price doesn't follow, it is usually an early hint that a big move is going to manifest itself in the near-term so keep the stock on your watch list.
The next area of interest is the beginning of April when price broke out of a decsending triangle pattern at the same time as the 20 and 50 MAs crossed over. The ADX line broke its downtrend line concurrently.
By the time price regained the 200 day MA, the ADX line was crossing 20 and +DI had crossed above -DI. Over the next three weeks, the ADX line went from 20 to 40 and price increased 14% from $28 to $32.
In mid May the ADX curled downward indicating a trading range would come into play, however, the +DI and -DI kissed (see blue arrow) and bounced off of each other reflecting another minor wave of strength.
The following example is a daily chart of ADBE, which has had a similar rise in the ADX line only this time, -DI crossed over +DI, and the momentum was to the downside.


ADBE gapped down on a weak earnings report. What followed was death cross of the 20/50 MAs in conjunction with a bearish ADX crossover and the move was swift - a 21% price move from $36.00 to $28.50 as the ADX line went from 20 to 50 in the space of one month.
Now let's look at an intraday timeframe and see how the ADX can help guide day and swing trades. Here is a chart of CTXS from back in May 2006 which was originally posted on my blog on May 8th and pretty much speaks for itself.


[url=][/url]
Posted by Jamie at 6/11/2006 08:15:00 PM 2 comments


Mastering the Trade by John F. Carter
I first heard about "Mastering the Trade" by John Carter from the The Shark Report. I then navigated to tradethemarkets.com and checked out the ABC - John Carter interview. From there I decided to purchase the book. I couldn't find it at any of the main bookstores here in Montreal, so I ordered it through Amazon. I received it Friday and happily spent a good part of Saturday reading it. And I can't wait to get back to it. Finally, a book with well defined, tangible setups and techniques for day traders.

Some of the Topics/Chapters include:

Opening Gap Plays, Pivot Points, Scapling, Tick Fades, The Squeeze, Catching Trend Reversals, Swing Trades to name a few. He also presents indivudual chapters on the Pre-Market Checklist as well as, the Trader's Business Plan.

I'll do a full review when I'm finished reading the book. But so far, I'm loving it.

[url=][/url]
Posted by Jamie at 6/11/2006 05:07:00 PM 3 comments


The Summer Effect
Interesting Statistics re: the summer effect courtesy of Briefing.com

Two years ago, our May 17, 2004 Big Picture column discussed the fact that the stock market has performed poorly during the May-November period over the past 50 years. It noted that :


"According to the Trader's Almanac, $10,000 invested for the six months of November through April, but then switched out of stocks and into fixed income securities for the May through October period, would have grown to $461,774 through 2002...A similar $10,000 invested in stocks for the May through October period, but moved into fixed income for the other months, actually produced a decline in total assets. The 53-year investment strategy would leave a portfolio of only $8,837."

The total gain in the stock market over the past half has come from the November-May period. The old saying, "sell in May and go away" is based on hard data.

That has not changed over the past few years. In 2004 the market was flat from May through late October. Last year, the market was up slightly over that period.

We expect this pattern to hold again this year.

[url=][/url]
Posted by Jamie at 6/11/2006 04:33:00 PM 0 comments


Friday, June 09, 2006NASDAQ Technical Picture
Even though the Asian and European markets rallied today, we managed to take one step back after going two steps forward yesterday afternoon. However, we have a lot of positive divergence building in the RSI and I still believe we will manage some sort of corrective bounce off of the 2100 level. Let's hope that next week's economic calendar is positive enough to get buyers back in. Tuesday and Wednesday will be the critical release of the latest inflation figures at the producer and consumer levels. BB will be monitoring these closely. Most tech sectors ended the session in the red, however, there was no technical damage.

[url=][/url]
Posted by Jamie at 6/09/2006 08:53:00 PM 0 comments


Newer Posts Older Posts Home
金币:
奖励:
热心:
注册时间:
2006-7-3

回复 使用道具 举报

 楼主| 发表于 2009-3-21 11:16 | 显示全部楼层
Friday, June 09, 2006Swing Trade - AAPL, QQQQ Update

After watching the pre-market gap ups, I decided to move my stops on both of these positions to just under the pre-market lows. The idea was if they couldn't follow through and take out the pre-market highs, chances were high that they would rollover. I didn't want to repeat the same mistake I made last week with AAPL (giving back $1.00 of profit). It turned out to be a good decision as I saved myself $0.80 on the AAPL trade and 0.30 on the Qs. A big thanks to Glenn for forcing me to analyse my mistakes!

[url=][/url]
Posted by Jamie at 6/09/2006 08:35:00 PM 1 comments


Watch List - BRCM, NVDA

Click on charts for larger views and chart notes.


[url=][/url]
Posted by Jamie at 6/09/2006 07:01:00 AM 2 comments


Thursday, June 08, 2006Watch List
I'll try to update this post tomorrow morning, Blogger permitting. I'm favoring the SOX on the heals of TXN's upward guidance. At first glance, I like NVDA, KLAC, and possibly BRCM.

[url=][/url]


I promised to do a post on ADX tonight, unfortunately, due to Blogger problems, I will have to postpone it until the weekend because I want to take the time to explain it in a meaningful way and it's just getting too late.

[url=][/url]
Posted by Jamie at 6/08/2006 10:34:00 PM 0 comments


NASDAQ Technical Picture


I'd like to say that we capitulated here, but the big volume spike came in the afternoon so it doesn't qualify as a capitulation, but it is encouraging to see that buyers are stepping back in at this level with such enthusiasm. As noted here a few times, 2100 was my target for tradable bounce. Today's long lower shadow and big volume spike strongly suggest a reversal so start planning your long entries.

[url=][/url]
Posted by Jamie at 6/08/2006 10:32:00 PM 0 comments


Swing Trade - QQQQ, AAPL

Regular readers of this blog know that I've been saying we could get a tradable bounce at NASDAQ 2100. As recently as Monday, I harped on it aga

So shortly after we hit that magic number, I got long AAPL and the Qs. I'm confident that we are going to bounce here and so I sold 50% of each position into the close and I'm swinging the balance into tomorrow. My stop on the Qs is set at $38.15.

[url=][/url]
Posted by Jamie at 6/08/2006 10:17:00 PM 0 comments


Wednesday, June 07, 2006SOX Update
The SOX closed on its long-term trendline today.

Even with an upgrade to Buy from Caris, BRCM fell hard again today. This is a weekly chart that shows BRCM has multi-year support at this price level.

[url=][/url]
Posted by Jamie at 6/07/2006 10:37:00 PM 3 comments


NASDAQ Technical Picture


There was no reason to go long today as you can see from the 15 minute view of the NASDAQ, the ADX line did not give a buy signal on the morning bounce in price. It only started to perk up a bit in late afternoon trade as prices took out the morning lows. It was another lacklustre day with little momentum in either direction unless you were short semis. We are still hanging on to a higher low for now. And speaking of semis which lost 2.4% today and closed on the low, they are testing a long-term trendline. It will be interesting to see how this plays out in the coming days. The P&F chart has a target of 2060 for the NASDAQ, that's less than 100 pts. away but it could take weeks, if we continue to chop around like this.

[url=][/url]
Posted by Jamie at 6/07/2006 09:49:00 PM 5 comments


Blogger Problems Again


[url=][/url]
Posted by Jamie at 6/07/2006 09:19:00 PM 0 comments


Tuesday, June 06, 2006Watch List - MXIM, MYGN, CTXS, AAPL
The selling pressure on MXIM has subsided and it looks well positioned to test recent resistance levels at $33.00 and possibly $35.00 in the near-term.

MYGN feels like it's about to make an explosive move.

CTXS held its trendline on a closing basis. I noticed some high volume buying in the last half hour of trading so we may get a technical bounce here tomorrow.

AAPL carved out a NR bar and a higher low on a retest of its long-term trendline. If the market reverses up tomorrow, AAPL looks well positioned to bounce from here.

[url=][/url]
Posted by Jamie at 6/06/2006 09:12:00 PM 0 comments


Newer Posts Older Posts Home
金币:
奖励:
热心:
注册时间:
2006-7-3

回复 使用道具 举报

 楼主| 发表于 2009-3-21 11:18 | 显示全部楼层
Tuesday, June 06, 2006NASDAQ Technical Picture

The NASDAQ carved out a hammer like reversal bar and a higher low on slightly stronger volume today. Most tech sectors ended the session in the red, however, many formed dojis or NR bars which could signal a reversal. Technically, we could bounce here and the higher low would be the first step to a corrective, counter-trend bounce. On an intrady basis, the 15 minute view above looks well positioned to rally up to the next resistance levels. Keep an eye on the ADX line at the critical crossover on the 15 minute view for more clues.

[url=][/url]
Posted by Jamie at 6/06/2006 08:32:00 PM 0 comments


Trade of the Day - BRCM
In last night's Technical Picture post, I noted that if the market did not snap back in the early going today, it could be heading towards Nasdaq 2100. With that in mind, I held off trading for the first hour. Shortly after 10:30, it became obvious, that the market was too weak to snap back from yesterday's big loss, so I looked for a weak candidate to short. Since I only have about 10 stocks on my web trader page at work, BRCM stood out from the rest. I put in a sell limit order and was filled right away. I covered near the close - good for 1.25 pts.

[url=][/url]
Posted by Jamie at 6/06/2006 08:19:00 PM 2 comments


Monday, June 05, 2006Watch List - Short
NVDA just broke support on a closing basis and if is does not recapture it on the open tomorrow, its heading back down to its original trendline.

CKFR broke support on a closing basis and is heading towards its rising 200 day MA in the area of $46.50.

[url=][/url]
Posted by Jamie at 6/05/2006 11:29:00 PM 0 comments


NASDAQ Technical Picture

A gap down on geopolitical fears and a wave of selling on Fed speak in the afternoon. The NASDAQ carved out a bearish evening star reversal pattern on lower volume. The lack of volume on these wide range bearish sticks has thus far resulted in immediate snap backs. However, today's action concluded with evening star patterns in several tech sectors including biotechs, semis and networking. The NDX heatmap was a sea of red with only half a dozen names closing the session better than breakeven. If the market does not reverse itself in the early going tomorrow, we could be heading for NASDAQ 2100, at which point I believe we could be in for a tradable corrective bounce. But until we make a lower low, its chop, chop back and forth.

P.S. - I noticed that when Bernanke speaks in the afternoons, the markets head south in a hurry. He usually has a more dovish stance when he speaks in the am. Nonetheless, if you're long when he opens his mouth, set a tight stop.

[url=][/url]
Posted by Jamie at 6/05/2006 11:12:00 PM 0 comments


Blogger Problems
I've been unable to post anything so far tonight due to blogger problems. All of my work has been lost so I have to start all over again. I'm in the middle of The Apprentice now so hopefully I will be able to post something by tomorrow morning.

Sorry for the inconvenience.

[url=][/url]
Posted by Jamie at 6/05/2006 10:13:00 PM 0 comments


Sunday, June 04, 2006Watch List - AMGN, CTXS, LRCX
Last weekend I profiled the Biotech sector and AMGN as potential longs in a weak tech market. I still see the sector as the strongest and AMGN is looking even better now as it crosses its 50 MA.

After a parabolic rise from March to early May, CTXS has come back into its trendline and bullish gap support. Watch this one closely as we could get a bounce here.

LRCX carved out a dark cloud cover bearish reversal candlestick on Friday after retesting its broken trendline. We also have a 20/50 MA death cross pushing price back down. The best way to trade this type of bearish setup is to short on an intraday lower high with Friday's opening high as the baseline.

[url=][/url]
Posted by Jamie at 6/04/2006 11:46:00 PM 0 comments


Friday, June 02, 2006NASDAQ Technical Picture
A gap up on the jobs data followed by a pullback and close near the unchanged line on lower than average volume. Well the summer doldrums are really starting to take root and this is basically why I decided to take on a summer job. This type of trading makes me crazy. From the ADX line , we can clearly see that the bears have lost momentum, however, the lack of any bullish catalyst will stop prices from moving significantly higher before the next wave of selling takes hold.

The only tech sectors that look bullish at this time are biotechs and pharma as highlighted here last week. They've had nice moves this week and could be ideal buys on the next pullback.

[url=][/url]
Posted by Jamie at 6/02/2006 09:48:00 PM 1 comments


Swing Trade - AAPL Update
The markets overreacted to the tepid jobs data this morning in the pre-market. This was a sell signal so I immediately moved my stop on the AAPL swing from $61.50 to $61.95 to protect my profits. Sure enough the Qs started coming in even before 9:30 and I was stopped out just before 10:00.

[url=][/url]
Posted by Jamie at 6/02/2006 09:40:00 PM 2 comments


Thursday, June 01, 2006Using Trendlines to Pick Entry Points
MCHP was profiled in last night's watch list as a buy. It held its steep trendline on the open and again during lunch, presenting day traders two buying opportunities.

BRCM is trading on an intraday accelerated trendline. However, it is coming into a pivot point resistance level at $35.00. If it fails to break through, wait until it pulls back to the original trendline for a potential long entry.

Obviously long-term trendlines on higher timeframes are much more meaningful than intrday trendlines as we saw today with AAPL. But if you have trouble picking your entry points, intraday trendlines can be very useful.


[url=][/url]
Posted by Jamie at 6/01/2006 09:14:00 PM 0 comments


NASDAQ Technical Picture
A nice tech bounce lead by the semis. Since last week's three day rally, we've carved out a higher low and a higher high. Now we have the jobs data to contend with tomorrow. Today's action took place on less than average volume and could be an early warning sign that this may be little more than a relief rally on the way down. We have lots of resistance overhead and we need to protect long profits by keeping tight stops. Today's rally was broad based with all major tech sectors participating except disk drive. The NDX winners were RHAT, JNPR, and SHLD and the losers were SNDK and SUNW. Only seven names on the NDX 100 finished lower today.

[url=][/url]
Posted by Jamie at 6/01/2006 08:22:00 PM 0 comments


Newer Posts Older Posts Home
金币:
奖励:
热心:
注册时间:
2006-7-3

回复 使用道具 举报

 楼主| 发表于 2009-3-21 11:19 | 显示全部楼层
Thursday, June 01, 2006Swing Trade - AAPL, AKAM
As dicussed here last night and in Tuesday's watch list, I was expecting a bounce from AAPL if it held its long-term trendline on a closing basis which it did yesterday. I placed a buy limit order at $59.50 on my way to work. Unfortunately, it did not get filled so I had to chase it. I managed to get in at $59.87. I sold 50% after a 2+ pt. gain and I am swinging the balance with a stop just under $61.50 and a target of $63.50 - $64.00.


I decided to sell AKAM into the close at $32.00 even though the target of $32.40 was not met. The extra $0.40 was not worth the risk of a pullback into the original trendline.

[url=][/url]
Posted by Jamie at 6/01/2006 08:06:00 PM 0 comments


Wednesday, May 31, 2006Watch List - AKAM, LRCX, MCHP


Click on charts for larger views and chart notes.


[url=][/url]
Posted by Jamie at 5/31/2006 10:22:00 PM 0 comments


TZOO - Getting Ready to Bounce

TZOO carved out a star like candle and held support of its 50 day MA. Look for an uptick in volume to move price back up to $32.50 followed by $35.00. Also watch the ADX line for a break in momentum.

[url=][/url]
Posted by Jamie at 5/31/2006 10:04:00 PM 0 comments


NASDAQ Technical Picture


Today's little rally is being attributed to month-end portfolio rebalancing. For sure, the minutes to the FOMC meeting did little to incite any buy interest. However, we did regain 14 points from yesterday's big fall and semis paced the way along with biotechs which tells us that some institutional players view these two sectors as attractive at these oversold levels. Today's NDX winners were ATYT, MEDI and PTEN and the losers were AAPL, MSFT, and MNST. AAPL did hold support of its long-term trendline on a closing basis today and bears watching tomorrow for a potential snap back.

[url=][/url]
Posted by Jamie at 5/31/2006 08:52:00 PM 0 comments


Swing Trade - AKAM
Picked up AKAM on weakness around midday as it appeared to be making a series of higher lows. I sold 50% of the position into the close as it retested the morning highs in the $31.40 range. I'm swinging the balance of the trade into tomorrow and my stop is set at $30.45 just below the afternoon low and my original entry point. My target is $32.40.

[url=][/url]
Posted by Jamie at 5/31/2006 08:42:00 PM 0 comments


Tuesday, May 30, 2006Watch List - CKFR, AAPL, AKAM
Any further weakness could push CKFR towards its rising 200 MA.

This is a daily view of AAPL which is fast approaching its trendline support around $60.00.

AKAM looks like it wants to break its short-term downtrend. From the 15 min. view - support at $30.00.

[url=][/url]
Posted by Jamie at 5/30/2006 09:20:00 PM 0 comments


NASDAQ Technical Picture
The market gapped down on the open on renewed inflation fears and failed to bounce at any of the key reversal times. By late afternoon selling accelerated and the markets lead by small caps and technology had all given back more than half of last week's three day bounce. All tech sectors ended the day in the red. Only 10 stocks in the NDX 100 ended the session on the plus side and 25 names shed upwards of 3% today, lead by MRVL 5.6%, NIHD 5.1% and SNDK 4.7%.

The best we can hope for in the short-term is a higher low, however, it appears increasingly clear that the Nasdaq will not likely get much traction until it tests its trendline around 2100.

[url=][/url]
Posted by Jamie at 5/30/2006 08:08:00 PM 2 comments


Swing Trade - QQQQ Update
I sold the balance of my QQQQ position on the open because the pre-market didn't inspire too much confidence.

[url=][/url]
Posted by Jamie at 5/30/2006 08:04:00 PM 0 comments


Monday, May 29, 2006Biotechs and Pharma - Best Performing Tech Sectors?
Biotechs and Pharma were leaders in last week's tech recovery. Here are the sector charts and some leading names in each.

Biotechs


AMGN made a higher low and looks well positioned to challenge recent resistance levels.

GENZ has room to move higher before running into resistance.

MYGN has recaptured its trendline and 50 MA and looks well positioned to retest recent highs.
Pharma


VRTX has had a significant correction and managed to hold its 200 MA. Now it looks like it will test its downsloping trendline.

ARNA filled its bullish gap support and bounced back with a lot of momentum.


[url=][/url]
Posted by Jamie at 5/29/2006 09:20:00 PM 0 comments


Trade of the Day - ECA-TC
The Canadian markets were open today and they usually don't do too much damage when the U.S. markets are closed. I placed a buy limit order to buy Encana -ECA-TC at $54.00 which was just above the two day trendline. I was filled on the open. At lunch I moved my stop up to $55.50. I was stopped out in early afternoon for a 1.5 point gain.

[url=][/url]
Posted by Jamie at 5/29/2006 07:41:00 PM 0 comments


Newer Posts Older Posts Home
金币:
奖励:
热心:
注册时间:
2006-7-3

回复 使用道具 举报

 楼主| 发表于 2009-3-21 11:20 | 显示全部楼层
Friday, May 26, 2006NASDAQ Technical Picture


The NASDAQ gapped up above 2200 resistance on a fairly benign core PCE figure this morning and traded in a narrow range for the rest of the session. Volume was extremely low due to the long weekend ahead. All major tech sectors were in the green with biotech pacing the way and software just holding the unchanged line. The P&F chart reversed it bearish signal today with a new target of 2360. From today's close of 2210, we have a potential 150 points to the upside. The stochastics are lifting from the extreme oversold level and the ADX line looks like it wants to stabilize, both of which could be bullish short-term for the market.

[url=][/url]
Posted by Jamie at 5/26/2006 09:26:00 PM 0 comments


Thursday, May 25, 2006NASDAQ Technical Picture
Nice continuation from yesterday's close. The Nasdaq gapped up on the open, pulled in to fill the gap and then moved forward from there. All tech sectors finished the day in the green except the SOX with internet stocks and biotechs taking leadership roles. Commodities and energy also had a big recovery today. We are coming into a lot of resistance at NASDAQ 2200. The NDX winnerss were SIRI, EBAY and AKAM. The NDX losers list includes five semis in the bottom ten - MRVL, MXIM, BRCM, LRCX, and XLNX.

[url=][/url]
Posted by Jamie at 5/25/2006 09:10:00 PM 0 comments


Swing Trade - QQQQ
This morning I setup two swing trade buy limit orders before I left for work. The WMT order didn't get filled because I set my price about 15 cents too low. Here is the QQQQ trade which was set well within range. My stop is set to execute only within trading hours.

[url=][/url]
Posted by Jamie at 5/25/2006 08:55:00 PM 0 comments


Trade of the Day - JCOM
click on chart for larger view
As highlighted here this week, JCOM has been very strong despite the markets weakness. I couldn't resist getting into this one post split even though it's a little late for a swing trade. It paid off very nicely.


[url=][/url]
Posted by Jamie at 5/25/2006 08:28:00 PM 0 comments


Wednesday, May 24, 2006WatchList - PALM, WMT, CKFR
PALM could snap back after this high volume drop into the 200 MA. Look for a potential quick retest of $20.00 before it comes back in.

WMT looks like it wants to break higher. Volume has been building to the long side lately and it looks well positioned to go higher in the near-term.

As mentioned in the swing trade update, CKFR is forming a bearish flag pattern. The short-term target is $48 and the second level target is the 200 day MA around $46.

[url=][/url]
Posted by Jamie at 5/24/2006 09:34:00 PM 0 comments


Watch List Winners - CERN, JCOM
CERN was highlighted on Monday's watch list as a potential short candidate because it was taking too long to consolidate. Today it broke out of its bearish pennant pattern for a 6.3% loss. It closed on support but there's still a lot of momentum to the downside.

JCOM was on last night's watch list for its strength despite the weak markets. Today it hit another all time high.

[url=][/url]
Posted by Jamie at 5/24/2006 09:11:00 PM 0 comments


NASDAQ Technical Picture
Some buy interest came back into tech stocks today lead by MSFT which jumped from multi-years lows. It was an up and down day, but it closed on a bullish note and much higher volume. The SOX bounced off of its trendline support to close the day in the green. Looks like tech could stabilize here. Commodities and energy stocks are still on the way down. I'm not expecting a big bounce here because there's far too much resistance just above but maybe we can climb back up to the 200 MA in the near-term.

[url=][/url]
Posted by Jamie at 5/24/2006 07:51:00 PM 0 comments


Swing Trade - CKFR Update
When CKFR moved up above $51.00, this morning, I moved my stop up to $50.75, just 5 cents below support and I was stopped out before midday. CKFR closed just above yesterday's entry point so it was a profitable move. The daily chart looks like a bearish flag pattern is in the works so this could be a good short candidate going forward.

No other swing trades were initiated today as I was too busy at work.

[url=][/url]
Posted by Jamie at 5/24/2006 07:30:00 PM 0 comments


Tuesday, May 23, 2006NASDAQ - Potential Double Bottom on Intraday View
If the NASDAQ can hold support around yesterday's low and bounce back to the 2200 resistance level, we will have a double bottom and a nice base for a potential rally.

[url=][/url]
Posted by Jamie at 5/23/2006 11:05:00 PM 0 comments


Watch List - JCOM, CTXS, LRCX
Buy on weakness as JCOM bucks the trend and continues to challenge recent highs.

Selling pressure is diminishing as volume decreases. Keep an eye on CTXS for a potential reversal.

LRCX had a sharp decline on average volume as investors question their stock option grant policies.

[url=][/url]
Posted by Jamie at 5/23/2006 10:15:00 PM 0 comments


Newer Posts Older Posts Home
金币:
奖励:
热心:
注册时间:
2006-7-3

回复 使用道具 举报

 楼主| 发表于 2009-3-21 11:20 | 显示全部楼层
Tuesday, May 23, 2006NASDAQ Technical Picture
As I was walking the dog in the park this evening, I overheard some market talk. One guy commented that he thought the selling was over, his friend responded oh no, I just heard on ROB (Report on Business television, Canada's slow motion version of CNBC) that futures were down big time on a bird flu epidemic scare. We'll soon see if this story has legs, but as far as I can tell from reading Briefing.com and listening to CNBC's On the Money, this story is already priced in and overpriced given the details of the close knit family relations of the victims involved.

On the plus side, commodities and the energy sector, finally had a positive day. Even the SOX started off on a positive note and looked like it was starting to stabalize until the late day selloff took hold. Maybe this is a double bottom on the intraday charts and we move up from here.

[url=][/url]
Posted by Jamie at 5/23/2006 08:15:00 PM 3 comments


Swing Trade - CKFR
My first swing trade setup was CKFR as per last night's watch list. I placed a $50.00 buy limit order around 8:00 a.m. this morning as I was heading off to work. I was filled on the open. At lunch time I placed stop on 50% of my shares at $50.35, just 5 cents below breakout support. I thought that if price could take out the morning high, it could easily go to $51.00, so I placed a sell limit order on the other 50% of my shares at $51.00. That sale went through easily in the last hour of trade. I'm leaving my stop as is going into tomorrow and hoping that the pink trendline holds. Given the sloppy market conditions, I'm lowering my target to $52.00 and hoping to exit the balance of the trade tomorrow.

In reviewing the trade, I realize that I should have split my buy entry in two: 50% at $50.00 support and the balance around the 200 period MA on the five minute chart. I will implement this type of split buy order on my next swing trade.

This was my only trade today.

[url=][/url]
Posted by Jamie at 5/23/2006 07:27:00 PM 0 comments


Monday, May 22, 2006Watch List - BRCM, CERN, NEW, CKFR, EBAY
BRCM took too long to consolidate and eventually rolled over falling out of its bearish flag. Support levels are indicated by the blue lines.

CERN is taking too long to consolidate. Looks like it could fall to the downside on further weakness.

NEW looks like a potential H&S top in the making. We just need a right shoulder. Buy on a confirmed break of $46.06. The swing target is the upper blue line on the chart above.


Check out the daily and 15 minute charts of CKFR for a potential three day consolidation breakout pattern. The 15 minute view shows a nice base over the last three days. Looking for a break of $50.40 with a swing target back up to the broken trendline between $53-$54.00.


EBAY has also been consolidating for three days and if volume can be trusted, it looks like it wants to go higher from here. Buy on a break of $30 or a pullback to intrady support. The swing target is $32 or the declining 20 day EMA, and the prelim. target is $31.


[url=][/url]
Posted by Jamie at 5/22/2006 08:19:00 PM 1 comments


Money Management
Money management is key under these difficult trading conditions. I am still trading at reduced size and have been throughout this steep decline (since May 4th - as planned and noted in one of my May 3rd posts). Well if you do the math, between the internet problems where I lost almost one week, the reduced size, and the quality of the trades and fequency of stop outs, I'm not making the kind of money I'm used to making at day trading. I realize that this is due, in part because I am a better bull than bear. All this to say that starting tomorrow, this blog will be focused more on swing trades as opposed to day trades. I won't be updating the blog throughout the trading session as I usually do because I've decided to take on some contract work over the next few months. I will still be posting the regular technical picture and watchlist posts and I will post my swing trade charts as well.

Good Trading Everyone!

[url=][/url]
Posted by Jamie at 5/22/2006 08:10:00 PM 6 comments


NASDAQ Technical Picture

Another day of new lows across the U.S. markets with small caps and tech leading the carnage. Sound familiar? Volume was slightly lower, but still above average. And just when you thought it was safe to tread lightly back into semiconductors (after Friday's bullish engulfing bar), surpise another loss of 4.2%. We have a lot of positive divergence on the NASDAQ 60 minute view, however, we still keep making lower lows. Hopefully we can stabilize soon. Once we stabilize it will be easier to assess which direction to focus on. As it is now, we just keep waiting for a pop that never comes.

[url=][/url]
Posted by Jamie at 5/22/2006 05:50:00 PM 0 comments
金币:
奖励:
热心:
注册时间:
2006-7-3

回复 使用道具 举报

 楼主| 发表于 2009-3-21 11:21 | 显示全部楼层
Waiting for a Higher Low
If the Nasdaq and the Qs can make higher lows from Friday's, we could see a bounce in the short-term. No trades so far today. If we must go short again, look for stocks that have already taken out Friday's low. I'm eyeing BRCM on the short side as it falls out of a bearish flag on the daily view.


Update 12:44 EST - Well the higher low will have to wait for another day. I have to teach myself to love scalping, but so far today its making me a little crazy.

I shorted BRCM at $35.80 and covered 50% at $35.16. Stopped out on the balance.

Long CTXS at $38.71 - 50% profit booked when price reached resistance of downsloping 50 period MA on the five minute view. Still hanging in on the balance with a stop at breakeven.

Long AAPL at $63.14 - 50% profit booked after a $0.50 gain, stopped out on the balance.

Update 1:05 EST - Okay I'm all cash - stopped out on CTXS. I'm calling it a day.

Check out the NASDAQ chart below. The ADX line is picking up momentum on the short side and the stochastics can't breakout of the oversold zone. Just a week ago, the ADX line closed at 17.09, and now we are at 28.34 midday. Wow! I'm weary of waiting for a higher low. I'm lowering my expectations and just hoping we can get a really solid bounce from NASDAQ 2100.


Update 1:57 EST - So much for cutting out early. I shorted AKAM at $31.00 and was stopped out at $30.50 for a quick profit. Looks like AKAM has capitulated intraday.


[url=][/url]
Posted by Jamie at 5/22/2006 09:59:00 AM 0 comments


Sunday, May 21, 2006SOX Update and Bullish Semiconductor Setups for the Week Ahead
Click on charts for larger views.

Many factors are at play here including a measured move on the symetrical triangle break which has yet to run its course. However, in the short-term we are bullish and the following semi stocks look well poisitioned to bounce.

ALTR looks well positioned to bounce from this support area. Friday it carved out a bullish hammer reversal pattern on relatively high volume.

AMD gapped up on very high volume on news that DELL will option their duo core processors beginning next year. In doing so it cleared both the 20 and 50 MAs on a closing basis. We have minor reistance at $36 and $38, but I wouldn't be surprised to see AMD retest $42.00 in the near-term.

LCRX has successfully tested its trendline and looks well positioned to bounce from here. Friday's bullish engulfing stick could foreshadow a move back up to the bearish gap resistance area in the short-term.


NVDA has successfully tested its trendline and looks well positioned to bounce from here. Friday's bullish harami stick could foreshadow a move back up to the $27-$28 area in the short-term.

N.B. I believe these are short-term potential bounces, the overall bias is still to the downside for both the SOX and the Nasdaq. Therefore, I recommend caution.


[url=][/url]
Posted by Jamie at 5/21/2006 12:32:00 PM 0 comments


Friday, May 19, 2006NASDAQ Technical Picture


An opening gap quickly faded into a lower low by mid-morning, followed by a bullish multi-wave rally which held until 2:00. As discussed here last night, semiconductors got a big boost from the MRVL earnings and AMD news. The SOX was up 15 points or 3.2% and carved out a bullish engulfing wide range bar. Most major tech sectors ended the session in the green except software. There are still no major technical indicators on the daily chart to signal a reversal, however, we do see positive divergence on the 60 minute view. Next resistance level is 2220. The NASDAQ P&F chart above is now indicating a target of 1980. The NDX winners were MRVL, AKAM, and AMZN and the losers were JNPR, EXPD, and JOYG.

I'm not expecting a big bounce here, nevertheless, it will create another shorting opportunity.

[url=][/url]
Posted by Jamie at 5/19/2006 11:23:00 PM 0 comments


Trade of the Day - AAPL
After making a new daily low in the morning, the Qs reversed course and went into a multi wave rally. What a surprise! By the time I realized what was happening, I had missed the first wave, but I took a long position in AAPL as it bounced off of its rising 10 period EMA on the 5 minute view. I sold 50% of the position as it came into resistance of the declining 200 MA and sold the balance after the next wave signaled a loss of momentum. After a deep pullback, AAPL was able to bounce off of intraday support at $63.50, I decided to take a chance on a rally into the close. Once it got going, it felt like a power scalp and I just kept trailing my stop closer and closer. I happily let it go at $64.50, no need to be greedy.

[url=][/url]
Posted by Jamie at 5/19/2006 04:06:00 PM 0 comments


These markets are incredibly weak. Longs have to be very cautious and breakouts are to the downside.

Short TZOO on a break of yesterday's AH low - entry price $31.10. Covered 100% at the $30.00 support level.

Long FLSH on break of the pre-market high. Sold entire position at the 10:00 reversal time due to market instability. Re-entered at support $36.05 and was stopped out.

I'm thinking I may cut this session short because all of this volatility is too difficult to read.

[url=][/url]
Posted by Jamie at 5/19/2006 11:35:00 AM 0 comments


Newer Posts Older Posts Home
金币:
奖励:
热心:
注册时间:
2006-7-3

回复 使用道具 举报

 楼主| 发表于 2009-3-21 11:22 | 显示全部楼层
Thursday, May 18, 2006TZOO - Giving it all Back?
TZOO seems intent on giving it all back. Looking for a short candidate - next support levels are $30.00 and $27.80.

[url=][/url]
Posted by Jamie at 5/18/2006 09:11:00 PM 0 comments


Watch List - FLSH, AAPL, BRCM
This is a thirty min. view of FLSH which broke out of its bullish flag pattern today. Support at $35.25 and resistance at $36.00.


AAPL has been very bearish since its failed inverted H&S pattern. This week we've had two bearish engulfing patterns. If AAPL breaches the 200 MA on a closing basis, it will signal further price deterioration.

This is a 15 minute view of BRCM. Today's late afternoon session filled yesterday morning's opening gap. However, the AH session brought price just above $37.00. We could open as high as $37.40 and once we take that out we could retest $38.00. After $38.00 is successfully taken, we could go as high as the 20 day EMA on the daily chart which is currently reading $39.45. I know it sounds ambitous, but we've been very patient all week.
Also watch tonight's AH movers - DELL, MRVL, and AMD on the open. Expect a big gap up for AMD in the $35-36.00 area.


[url=][/url]
Posted by Jamie at 5/18/2006 08:04:00 PM 0 comments


NASDAQ Technical Picture

A promising open turned into lacklustre consolidation session until Fed-speak - Richmond's Lacker stated that the Fed's planned rate hike pause was questionable. This sent the markets into a nose dive for the balance of the session resulting in another wide range bearish stick on lower volume. Despite all that, disk drive closed strong and hardware had a second sesion in the green. Biotechs led the way down.

The AH session was also very interesting with DELL and MRVL reporting and trading up in AH. DELL's annoucement regarding optional processors for DELL servers by year-end also gave a big boost to AMD which is up over 10% in AH. Needless to say, INTC is sinking deeper into the gutter.

In the last week and half, markets have been driven mainly by economic and geo-political data. Tomorrow's session has half a chance of being driven more by earnings and semiconductors could get a boost. However, tomorrow is also options expiration so volatility will be part of the package.

I noticed a few bloggers out with the percentage of S&P 500 stocks trading below their 50 MA. The chart above is the same thing for the INDX. As day traders we've felt the steepness of that relentless fall over the past week and half. But as the picture shows, this is not a pullback, its more like falling off a cliff.

[url=][/url]
Posted by Jamie at 5/18/2006 07:31:00 PM 0 comments


In Play
Long BRCM $37.05

Update 1:00 EST - I can't think of any good reason to be trading today. I've been in and out of BRCM three times for tiny profits and a scratch. The only trade that I'm still in at the moment is a long entry on FLSH at $35.38 currently trading just above $35.70. I have a tight trailing stop on this one and if I get stopped out, I'm going to call it a day.

Update 1:35 - Okay, stopped out on the FLSH trade at $35.58.

I'll be back later this evening with the Technical Picture and Watch List posts.

[url=][/url]
Posted by Jamie at 5/18/2006 10:30:00 AM 0 comments


Wednesday, May 17, 2006Watch List
Here are a few additions to yesterday's watch list which is still very much in play.

CELG was very weak today and closed just below its trendline support. If it doesn't regain the trendline in the early going tomorrow, it could be subject to further weakness and could fall as low as $36.00 in the short-term.

BIDU is consolidating its bullish gap up nicely. Buy on a pullback towards the 10 day EMA.

AAPL showed strength during today's weak market and observed a notable support area. Look for a possible bounce tomorrow.

[url=][/url]
Posted by Jamie at 5/17/2006 11:45:00 PM 0 comments
金币:
奖励:
热心:
注册时间:
2006-7-3

回复 使用道具 举报

 楼主| 发表于 2009-3-21 11:22 | 显示全部楼层
NASDAQ Technical Picture


Click on charts for larger views.

A`gap down on the inflationary CPI data and a wide range distribution day on higher volume with all the major markets closing near their lows. Support doesn't hold and the gap downs will represent resistance if we ever get a rally going. The QQQQ's filled a bullish gap support level dating back to November 2005 and held that support into the close. This took place on extremely high volume. Whether or not the Qs capitulated today will be the focus of tomorrow's action because if they did, we should see a rapid bounce. However, the past week feels like a parabolic dive. We're in a serious corrrection and I suspect the bears will be in control for the balance of the year. The only major tech sector in the green today was hardware. The SOX held bullish gap support dating back to Nov. 2005.

[url=][/url]
Posted by Jamie at 5/17/2006 09:06:00 PM 0 comments


Trade of the Day - BIIB
Short BIIB on a break of well defined support from earlier in the morning and yesterday. Around 10:55, I noticed that the Q's were rolling over it was time to short. BIIB fit the profile perfectly as it was testing support. All of my watchlist stocks were too strong to short so I had to scramble quickly to find a potential short. Sandwiched between BIDU and BRCM, two stocks I was watching closely for strength this morning, was BIIB.

[url=][/url]
Posted by Jamie at 5/17/2006 03:54:00 PM 2 comments


In Play
Up until around 11:00, I was patiently waiting for a reversal. Most of my picks from last night were holding up pretty well despite the disappointing CPI data. However, the Qs rolled over once again and its hard to determine if we are going parabolic to the downside or if we are about to capitulate.

Rather than sit out this session I decided to short BIIB on a break of support at $46.50 around 11:00. Locked in 50% after a dollar gain. My stop is now set at $46.10.

Update 1:30 EST - I was stopped out on the balance of the BIIB position. I took a long position in BRCM at noon and was in the position for little more than a half hour as I sensed the Qs weaken again. The Qs may retest this morning's lows. I'm all cash at the moment. This is a very tricky market, so we have to be careful. The Qs are very submissive, as soon as they feel the pressure of the downsloping MA, they roll over like a female puppy in heat.

[url=][/url]
Posted by Jamie at 5/17/2006 11:33:00 AM 0 comments


Tuesday, May 16, 2006Watch List
I'm still holding out for reversal on SNDK and BRCM, both of which had higher lows today. CYMI formed a bullish harami today and would be considered as a strong buy candidate on a confirmed break of $50.00. LRCX formed a bullish engulfing pattern today so we will look for continuation tomorrow. I'm not reposting these charts tonight - refer to last night's review.

CTXS tested and held support of the late April low and bounced nicely from that point. Buy on a successful retest of today's low or a confirmed breakout of $40.50. $40.50 represents the support level which held Friday afternoon and all day Monday. It now represents resistance and is buyable on a successful break.

Click on charts for larger views.

Other Charts of Interest:

ADSK is holding its new trendline and looks well positioned to move higher.

FLSH formed an inside day and closed on notable support as part of a bullish flag pattern.

CERN has held gap support dating back to July 2005 after a deep retracement. Today it carved out a bullish engulfing pattern as part of a three day consolidation pattern and looks like a good long candidate on a confirmed break of $37.50.

[url=][/url]
Posted by Jamie at 5/16/2006 09:29:00 PM 0 comments


NASDAQ Technical Picture
The NASDAQ carved out a narrow range inside day on lower volume all of which suggests a decrease of sell side momentum. I was disappointed to see so little buy interest at this oversold level. Much of the day felt like a repeat of yesterday. Hardware was the weakest tech sector and the SOX was the strongest although all screens are still turning up red.

[url=][/url]
Posted by Jamie at 5/16/2006 09:02:00 PM 0 comments


Newer Posts Older Posts Home
金币:
奖励:
热心:
注册时间:
2006-7-3

回复 使用道具 举报

 楼主| 发表于 2009-3-21 11:23 | 显示全部楼层
Tuesday, May 16, 2006Trade of the Day - BRCM
Today's trade of the day is strangely similar to yesterday's. I was hoping to be able to hold BRCM for a bigger gain on the open, especially given the upgrade. However, the markets were weak again today and tested yesterday's lows. I sold my swing trade just after the open. After a pullback to support, BRCM could not rally so I went short and it retested of yesterday's low followed by a rally back up to yesterday's close. We have another consolidation day with the highs and lows and close matching yesterday's. Maybe we can do this again tomorrow and just keep making the same money over and over again. I had to close off early today so these were my only trades on the day.

[url=][/url]
Posted by Jamie at 5/16/2006 04:51:00 PM 0 comments


The Technical Indicator
I have to agree with Mike Ashbaugh, the NASDAQ is something to avoid these days. Here is his latest take on the U.S. markets.

[url=][/url]
Posted by Jamie at 5/16/2006 11:04:00 AM 0 comments


In Play
There was no follow through on this morning's gap up. I sold my swing BRCM position on the open at $37.10 for nice profit from yesterday afternoon's entry.

CTXS is making lower lows.

CYMI and QCOM are strong but let's see how they handle the 10:00 reversal period.

No new positions so far.

[url=][/url]
Posted by Jamie at 5/16/2006 10:04:00 AM 0 comments


CTXS - Update
In last night's Watch List, I recommended CTXS as a buy above $41.25 even though it has traded slightly higher in the last two days because I see $41.25 as the main pivot point and resistance level (blue arrows in the chart above). It is currently trading above that in pre-market and may test $41.25 on the open. If it tests and bounces, I think that would be a pretty clear buy signal.

A confirmed break for me is when a candle closes above the resistance level using at least a five minute time frame.

[url=][/url]
Posted by Jamie at 5/16/2006 09:08:00 AM 0 comments


Pre-Market
SNDK upgraded at Merrill to Buy from neutral. Currently trading above $62.50.

BRCM upgraded to buy from hold at Needham - tgt $41. Currently trading at $37.00

[url=][/url]
Posted by Jamie at 5/16/2006 08:13:00 AM 0 comments


Monday, May 15, 2006Watch List - QCOM, CSCO, CTXS
Networking stocks looks well positioned to bounce off of this notable support level.

QCOM had a strong finish to close on its support line.

CSCO tested support at $19.50 and looks well positioned to bounce from here.

CTXS has been consolidating for two days. Today's higher low foreshadows a move to the upside. Buy on a confirmed break of $41.25

[url=][/url]
Posted by Jamie at 5/15/2006 08:43:00 PM 4 comments


Review of Last Night's Semi - Watch List
The first chart is a review of the SOX. Despite the 200 MA violation on a closing basis, the SOX looks well positioned to bounce from this notable support level. It is deeply oversold and has retraced 50% of the Oct. - Jan. rally. The long lower shadow on today's candlestick foreshadows a change of direction.

BRCM and SNDK started strong but at midday succumbed to selling pressure, however, they both showed resilience and rallied nicely off of their lows to form doji sticks. I am long BRCM and ready to go long SNDK if it can take out $62.00.


LRCX and CYMI failed to hold support today. I will let them confirm support and/or a reversal before going long. LRCX looks like it wants to retest its trendline and I'm not sure the accelerated trendline on CYMI will hold.


[url=][/url]
Posted by Jamie at 5/15/2006 07:24:00 PM 0 comments


NASDAQ Technical Picture

The NASDAQ was unable to stage any kind of rally after gapping down on the open. It traded sideways all morning and finally succumbed to selling pressure in the early afternoon. A late bounce off of the lows resulted in a solid close above the 200 day MA and the potential for a reversal tomorrow. The biotechs have the early lead on a potential reversal. Hardware was the weakest tech sector. Commodities all fell again today. Notice how oversold the NAMO (McClellan oscillator) is at the end of today's session. The NDX top 10 includes several biotechs - GILD, BIIB, AMGN, ISRG. The losers took big hits today - JOYG, AKAM, JDSU, and MRVL.

[url=][/url]
Posted by Jamie at 5/15/2006 05:13:00 PM 0 comments


Trade of the Day - BRCM
BRCM was the only stock I traded today. Unfortunately, I had to change the strategy along the way because the SOX was not ready to reverse course today. I started and ended long, but the middle and quickest return was on the short side of this trade. I took a slightly different strategy into the close and decided to swing a portion of this into tomorrow. Ideally, I'm hoping for a gap up on the open and a break of resistance at $37.00 in the very early going.

[url=][/url]
Posted by Jamie at 5/15/2006 04:14:00 PM 0 comments


In Play
The biotechs have taken the lead on the reversal. The SOX is still making lower lows. I took a small position in BRCM at $36.40 in the hopes that we would bounce at this level, however, if things don't get going soon, I will scratch the trade and wait for confirmation of a reversal.

[url=][/url]
Posted by Jamie at 5/15/2006 10:57:00 AM 0 comments


Newer Posts Older Posts Home
金币:
奖励:
热心:
注册时间:
2006-7-3

回复 使用道具 举报

 楼主| 发表于 2009-3-21 11:24 | 显示全部楼层
Sunday, May 14, 2006Semis Well Positioned to Bounce - CYMI, LRCX, BRCM, SNDK
CYMI's earnings gap has been filled and Friday's narrow range bar could signal a bounce is coming.

If the SOX bounces from here, LRCX looks well positioned to bounce off of breakout support.

BRCM is perched just above its 200 day MA and has retraced almost 62% of its October - March rally. Friday it formed a star like candlestick which could result in a morning star pattern if it opens above $36.43.

Will SNDK attempt to breakout of its ascending triangle and in which direction?

[url=][/url]
Posted by Jamie at 5/14/2006 10:30:00 PM 0 comments


SOX - Oversold
The SOX has retraced almost 50% of the October - January rally. It has had two successive closes outside of the BB and Friday's close is bang on its 200 day MA. Also the 50% retracement level is significant because it lines up with notable support. Consequently, we should expect a bounce back to the 510 area or the 50 MA in the coming week.

[url=][/url]
Posted by Jamie at 5/14/2006 08:46:00 PM 3 comments


Friday, May 12, 2006Nasdaq Technical Picture


Continuing dollar weakness and interest rate concerns sent the markets down amid high volume (institutional selling) again today. The small caps and technology continued their leadership role in the fall. The Nasdaq gapped down on the open and continued lower, closing on its lows. Internet stocks were particularly weak vs. the SOX which seems to be stablizing on the support of its 200 day MA after a full week of heavy selling. The Nasdaq is closing in on its 200 day MA and we may get a break from all the selling early next week. From the P&F chart above we see that we have a new lower target of 2140, from the current level of 2244, that's another 100 pts. The McClellan oscillator is testing oversold levels set back in October of last year. Today's big NDX losers were EXPE, NVDA, and JOYG and the winners were ADSK, RIMM, and CSCO.

[url=][/url]
Posted by Jamie at 5/12/2006 09:54:00 PM 0 comments


Trade of the Day
No trade of the day today. My personal business took longer than anticipated and when I got back to my screens, I decided to let the markets settle a bit. After briefly looking at some of the daily views, I think we may have some trading opportunities developing for next week.

[url=][/url]
Posted by Jamie at 5/12/2006 04:31:00 PM 0 comments


Pre-Market
NDX futures trading down 11 pts.

S&P futures trading down 5 pts.

I have personal business this morning so I will not be able to trade off of the open.

Good trading!

[url=][/url]
Posted by Jamie at 5/12/2006 07:07:00 AM 0 comments


Thursday, May 11, 2006Watch List - CTXS, AAPL
Last week's resistance becomes this week's support, in theory yes, but let's see how this plays out with CTXS tomorrow.


Although we have a failed inverted H&S pattern, AAPL closed on support and at these oversold levels, it looks like we have the potential for a snap back rally. On the 15 minute view above we have positive divergence and a break of $68.50 could take us back to the broken trendline around $70.50.

[url=][/url]
Posted by Jamie at 5/11/2006 10:22:00 PM 0 comments


Nasdaq Technical Picture


As noted in this post last night, the path of least resistance was down and it played itself out perfectly from just prior to the opening bell. All markets and all sectors (except coal +1.2%) cratered on high volume today. Leading the fall were small caps and technology. Note that the Nasdaq P&F chart signaled a triple bottom breakdown today with a preliminary target of 2200. With a few more sessions like this one, we'll reach that target in no time at all. What a difference a day makes, yesterday's McClellan Oscillator was neutral and now we are in the significantly oversold zone. Very few stocks were spared (weak and strong), my screens are covered in red. Last night I highlighted the SOX's precarious position. It's obvious from today's session that the bears are taking over. However, at these oversold levels, we could stabilize in the short-term.

[url=][/url]
Posted by Jamie at 5/11/2006 08:46:00 PM 0 comments


Trade of the Day - BRCM
As per last night's watch list, BRCM was a good short candidate. In fact, it took out yesterday's low just prior to the market open. Short on the open and I covered 50% after a 1 pt. gain. I covered the balance when my esignal screens died on me. I was unable to make contact with their technical support people but I gather  it was serious.

[url=][/url]
Posted by Jamie at 5/11/2006 04:30:00 PM 0 comments


In Play
Short BRCM on the open, covered 50% of the position after a 1 pt. gain.

Update 11:30 EST - Wow this market is incredibly weak. Just when you think its going to stabalize, it falls some more. Shorted AAPL as a quick scalp but so far there's no reason to cover.


Update 12:50 EST - My Esignal screens have all gone dead ( and its not not my internet this time). I can't manage my trades from stockcharts.com so I'm closing my positions.
I'll be back with my usual evening posts.
Good trading everyone!


[url=][/url]
Posted by Jamie at 5/11/2006 10:00:00 AM 1 comments


Newer Posts Older Posts Home
金币:
奖励:
热心:
注册时间:
2006-7-3

回复 使用道具 举报

 楼主| 发表于 2009-3-21 11:25 | 显示全部楼层
Wednesday, May 10, 2006Still Bullish on CTXS


CTXS is still very bullish. Monday's high of $45.50 marks resistance dating back to 2000. Today's low of $43.20 matches the April high and may hold as support. If not, we have support at $42.00 and the accelerated trendline. I wouldn't hold on to it if it breached the accelerated trendline on a closing basis. On a longer term view, if it takes out Monday's high, the next level of resistance is $50.00. I'll keep covering this one on a regular basis because its one of just a handful of charts, that I really like.

[url=][/url]
Posted by Jamie at 5/10/2006 11:47:00 PM 4 comments


Watch List - RBAK, TZOO, AAPL, AMD, BRCM
RBAK looks very bullish after a successful retest of its trendline.

If support at $40.00 holds, TZOO may attempt to breakout again very shortly.

AAPL needs more volume on the long side in order to complete the inverted H&S pattern.

AMD is struggling and just can't reclaim its 50 day MA. Looks like we have further downside in store.


A very bearish scenario for BRCM. However, after four straight down days, will we pause short-term before the decent continues?

[url=][/url]
Posted by Jamie at 5/10/2006 09:59:00 PM 0 comments


SOX Update

We may retest the symetrical triangle, but this break looks fairly decisive.

[url=][/url]
Posted by Jamie at 5/10/2006 07:39:00 PM 2 comments


Nasdaq Technical Picture


The Nasdaq gapped down on the open and was never really able to bounce. A look at the 15 minute chart shows that it can't recapture its downsloping 20 period EMA and the EMA appears to be pushing prices down. There's no sign of any positive divergence, so the scenario looks like the path of least resistance is down. A comparison of the Nasdaq vs. the S&P 500 shows that since late April the Nasdaq has been underperforming on a fairly consistent basis. But despite all this negativity, we are far from oversold levels as per the McClellan Oscillator above.

Today the Nasdaq shed 17.5 pts. or 0.75%, lead by the SOX which lost 2.5% of its value. Volume was slightly higher as is the trend of late on bearish days. All major tech sectors ended the session in the red. The NDX losers were TEVA, ERICY, and ALTR, and the winners were PETM, EBAY, and CMCSA.

[url=][/url]
Posted by Jamie at 5/10/2006 06:52:00 PM 0 comments


Trade of the Day - ENER
My internet service came back on shortly before the FOMC policy statement. I had been following the market on a dial-up connection all morning but could not execute any trades due to lack of speed. ENER had a great day today as it bounced off of its daily chart trendline on higher volume. I was able to enter a position in the afternoon as it broke its morning resistance on a big volume spike shortly after the FOMC statement.

[url=][/url]
Posted by Jamie at 5/10/2006 03:58:00 PM 2 comments


Trading appears to be very slow ahead of the FOMC policy statement this afternoon at 2:15 EST.

The SOX is leading the Nasdaq down once again. BRCM looks like a potential shorting opportunity on a break of $39.70.

TZOO is attempting to breakout of a shallow base at $41.53 but so far there doesn't appear to be enough volume to support the move.

[url=][/url]
Posted by Jamie at 5/10/2006 07:45:00 AM 0 comments


Tuesday, May 09, 2006BIDU - AH
Wow! I don't know th story behind the numbers, but this could have legs. Internet stocks have been oversold for some time now. Keep an eye on $GIN tomorrow.

[url=][/url]
Posted by Jamie at 5/09/2006 11:57:00 PM 0 comments


Nasdaq Technical Picture
From what I could gather it was another summer doldrums type of session. Most tech sectors were in the red except the internets. Speaking of internet stocks, check out BIDU (as profiled here last night) in AH trade.

[url=][/url]
Posted by Jamie at 5/09/2006 11:27:00 PM 0 comments


Technical Problems
I apologize for not being able to update the blog today, but my internet service provider is having some major problems. When they tell you that they have to order parts in order to solve the probem , you know you're in trouble. I was not able to trade today. I have just now been able to set up a dial up account ( thanks to Sebastian at Videotron) and hope that tomorrow will be more profitable.

A big thank-you to Don and Thomas from Vancouver for all the support and helpful tips!

Good Trading Everyone!

[url=][/url]
Posted by Jamie at 5/09/2006 10:33:00 PM 0 comments


Monday, May 08, 2006Watch List - BIDU, ADSK, OXPS
Unfortunately the speed of my internet prevents me from running scans so we have a very short watch list for tonight.

N.B. - BIDU reports earnings tomorrow AH


Click on charts for larger views.


[url=][/url]
Posted by Jamie at 5/08/2006 10:12:00 PM 2 comments


Newer Posts Older Posts Home
金币:
奖励:
热心:
注册时间:
2006-7-3

回复 使用道具 举报

 楼主| 发表于 2009-3-21 11:27 | 显示全部楼层
Monday, May 08, 2006CTXS - Analysis of a Shallow Base, Tight Consolidation Breakout
Click on chart for larger view.

This is a 60 minute view of CTXS which shows the shallow base, tight consolidation pattern and its very profitable outcome. It also shows how the oscillators and indicators should perform during a bullish momentum move. Note the late day euphoric volume spike at the end of today's session. These euphoric volume spikes usually foreshadow the end of a short-term move.

N.B. - Stochastics on the chart should read overbought as opposed to oversold.


[url=][/url]
Posted by Jamie at 5/08/2006 08:16:00 PM 2 comments


Nasdaq Technical Picture
Not much to say about this session except that it almost put me to sleep. The Nasdaq carved out a narrow range bar, perhaps a star, on lower volume. It felt like the summer doldrums but we'll call it a consolidation day. As noted this afternoon, I noticed quite a few failed breakouts including AAPL, AKAM, and NVDA. The strongest tech sector was disk drive followed by internets. The weakest sector was the SOX which ran into resistance within its symetrical triangle pattern (see chart below). DELL reported reduced guidance for the current ongoing QTR. and is trading down significantly AH. This is also having a negative impact on AAPL and other hardware names. Today's NDX winners were WYNN, MNST and CTXS; the losers were lead by EBAY, LRCX, and XMSR. As noted in Friday's post, the diminshing volume on this latest bounce is worrisome. Wednesday afternoon (2:15 p.m.) we will receive the latest FOMC policy statement from BB. Until then, trading will be likely be very slow, like watching paint dry as Trader Mike so aptly put it.


[url=][/url]
Posted by Jamie at 5/08/2006 07:07:00 PM 0 comments


Trade of the Day - CTXS
Today was shaping up to be a scratch for me until this late day breakout from a flat base on the 15 min. view came along. CTXS broke out of its base on huge volume and went straight up until just a few minutes prior to closing. Good for 1 pt.

I still don't have my high speed internet fixed so every trade is shaky given the slow speed at which I am receiving data. My cable internet service has a monopoly here so they don't seem to be in a hurry to get me up and running properly again. It's not for lack of trying on my part, because I call them two or three times a day. Still they're manana.

[url=][/url]
Posted by Jamie at 5/08/2006 04:01:00 PM 0 comments


In Play
NVDA breaking out on huge volume spike.

Update 2:35 EST - We've had quite a few false breakouts today, including NVDA, AKAM and AAPL, and AMR.

[url=][/url]
Posted by Jamie at 5/08/2006 10:56:00 AM 0 comments


Sunday, May 07, 2006Watch List - Bullish Consolidation Patterns - IDTI, HST, BBY, AMR, AKAM, CYMI, A, NVDA


This is a 60 minute view of CYMI. Buy on a successful test of the trendline around $54.00 or on a breakout around $55.40.


Click on charts for larger view and to read chart notes.


[url=][/url]
Posted by Jamie at 5/07/2006 10:30:00 PM 0 comments


Friday, May 05, 2006AAPL - Bullish Inverted H&S Pattern - Update
AAPL attempted and failed to break the Feb. 24th high on Thursday. The pullback on the failure was immediate. Today it traded in a fairly narrow range on lower volume and carved out another doji stick (indecision). All of the indicators and oscillators displayed in the chart above are bullish except volume. Notwithstanding any major news, I expect that AAPL may pullback to support in the $70.00 area before making another serious attempt at breaking the neckline.

[url=][/url]
Posted by Jamie at 5/05/2006 10:45:00 PM 0 comments


Technical Problem - Update
My internet service provider is still mired in logistical problems with respect to their network upgrade. They still can't get my internet speed up to par so I was not able to trade today. Hopefully, they will resolve the issue over the weekend, so that I, and this blog, can get back in gear. It's no fun sitting on the sidelines during a rally.

Have a great weekend!

[url=][/url]
Posted by Jamie at 5/05/2006 08:30:00 PM 0 comments


Nasdaq Technical Picture
The Nasdaq gapped up 12 pts. on the back of the lacklustre jobs data, the implication being a continued tightening in the labor market and inflation risk. It managed to add 6 additional pts. in a lower volume session to close at 2342. All major tech sectors were in the green at the end of the day with biotechs leading way ahead of the rest. The Nasdaq lagged all the other major averages and they, once again, reached new 52 week highs. Today's NDX winners were ATVI, CELG, and AKAM. Leading the way down were EBAY, CMVT, and ATYT. Next week should interesting because so far this little bounce shows a lack of momentum ie. the volume seems modest for size of the advance - 40 pts.- over the last two sessions.

[url=][/url]
Posted by Jamie at 5/05/2006 08:01:00 PM 0 comments


Watch List
No watch list tonight. As it turns out, my computer system is slow because of a faulty internet cable/modem. I guess the technical expert who came by yesterday was NG. I probably won't get a chance to trade tomorrow.

Good trading!

[url=][/url]
Posted by Jamie at 5/05/2006 01:37:00 AM 0 comments


Thursday, May 04, 2006Nasdaq Technical Picture
The Nasdaq carved out a wide range bar on lower volume ahead of the employment data tomorrow morning. The strongest sectors included disk drive, semis, and biotechs. The Nasdaq and small caps outperformed the DOW and SPX. Today's NDX winners were EXPD, WFMI, and ATYT and the losers were ERTS, JDSU and ATVI.

[url=][/url]
Posted by Jamie at 5/04/2006 08:18:00 PM 0 comments


Newer Posts Older Posts Home
金币:
奖励:
热心:
注册时间:
2006-7-3

回复 使用道具 举报

 楼主| 发表于 2009-3-21 11:28 | 显示全部楼层
Monday, May 08, 2006CTXS - Analysis of a Shallow Base, Tight Consolidation Breakout
Click on chart for larger view.

This is a 60 minute view of CTXS which shows the shallow base, tight consolidation pattern and its very profitable outcome. It also shows how the oscillators and indicators should perform during a bullish momentum move. Note the late day euphoric volume spike at the end of today's session. These euphoric volume spikes usually foreshadow the end of a short-term move.

N.B. - Stochastics on the chart should read overbought as opposed to oversold.


[url=][/url]
Posted by Jamie at 5/08/2006 08:16:00 PM 2 comments


Nasdaq Technical Picture
Not much to say about this session except that it almost put me to sleep. The Nasdaq carved out a narrow range bar, perhaps a star, on lower volume. It felt like the summer doldrums but we'll call it a consolidation day. As noted this afternoon, I noticed quite a few failed breakouts including AAPL, AKAM, and NVDA. The strongest tech sector was disk drive followed by internets. The weakest sector was the SOX which ran into resistance within its symetrical triangle pattern (see chart below). DELL reported reduced guidance for the current ongoing QTR. and is trading down significantly AH. This is also having a negative impact on AAPL and other hardware names. Today's NDX winners were WYNN, MNST and CTXS; the losers were lead by EBAY, LRCX, and XMSR. As noted in Friday's post, the diminshing volume on this latest bounce is worrisome. Wednesday afternoon (2:15 p.m.) we will receive the latest FOMC policy statement from BB. Until then, trading will be likely be very slow, like watching paint


[url=][/url]
Posted by Jamie at 5/08/2006 07:07:00 PM 0 comments


Trade of the Day - CTXS
Today was shaping up to be a scratch for me until this late day breakout from a flat base on the 15 min. view came along. CTXS broke out of its base on huge volume and went straight up until just a few minutes prior to closing. Good for 1 pt.

I still don't have my high speed internet fixed so every trade is shaky given the slow speed at which I am receiving data. My cable internet service has a monopoly here so they don't seem to be in a hurry to get me up and running properly again. It's not for lack of trying on my part, because I call them two or three times a day. Still they're manana.

[url=][/url]
Posted by Jamie at 5/08/2006 04:01:00 PM 0 comments


NVDA breaking out on huge volume spike.

Update 2:35 EST - We've had quite a few false breakouts today, including NVDA, AKAM and AAPL, and AMR.

[url=][/url]
Posted by Jamie at 5/08/2006 10:56:00 AM 0 comments


Sunday, May 07, 2006Watch List - Bullish Consolidation Patterns - IDTI, HST, BBY, AMR, AKAM, CYMI, A, NVDA


This is a 60 minute view of CYMI. Buy on a successful test of the trendline around $54.00 or on a breakout around $55.40.


Click on charts for larger view and to read chart notes.


[url=][/url]
Posted by Jamie at 5/07/2006 10:30:00 PM 0 comments


Friday, May 05, 2006AAPL - Bullish Inverted H&S Pattern - Update
AAPL attempted and failed to break the Feb. 24th high on Thursday. The pullback on the failure was immediate. Today it traded in a fairly narrow range on lower volume and carved out another doji stick (indecision). All of the indicators and oscillators displayed in the chart above are bullish except volume. Notwithstanding any major news, I expect that AAPL may pullback to support in the $70.00 area before making another serious attempt at breaking the neckline.

[url=][/url]
Posted by Jamie at 5/05/2006 10:45:00 PM 0 comments


Have a great weekend!
[url=][/url]
Posted by Jamie at 5/05/2006 08:30:00 PM 0 comments


Nasdaq Technical Picture
The Nasdaq gapped up 12 pts. on the back of the lacklustre jobs data, the implication being a continued tightening in the labor market and inflation risk. It managed to add 6 additional pts. in a lower volume session to close at 2342. All major tech sectors were in the green at the end of the day with biotechs leading way ahead of the rest. The Nasdaq lagged all the other major averages and they, once again, reached new 52 week highs. Today's NDX winners were ATVI, CELG, and AKAM. Leading the way down were EBAY, CMVT, and ATYT. Next week should interesting because so far this little bounce shows a lack of momentum ie. the volume seems modest for size of the advance - 40 pts.- over the last two sessions.

[url=][/url]
Posted by Jamie at 5/05/2006 08:01:00 PM 0 comments


Watch List
No watch list tonight. As it turns out, my computer system is slow because of a faulty internet cable/modem. I guess the technical expert who came by yesterday was NG. I probably won't get a chance to trade tomorrow.

Good trading!

[url=][/url]
Posted by Jamie at 5/05/2006 01:37:00 AM 0 comments


Thursday, May 04, 2006Nasdaq Technical Picture
The Nasdaq carved out a wide range bar on lower volume ahead of the employment data tomorrow morning. The strongest sectors included disk drive, semis, and biotechs. The Nasdaq and small caps outperformed the DOW and SPX. Today's NDX winners were EXPD, WFMI, and ATYT and the losers were ERTS, JDSU and ATVI.

[url=][/url]
Posted by Jamie at 5/04/2006 08:18:00 PM 0 comments


Newer Posts Older Posts Home
金币:
奖励:
热心:
注册时间:
2006-7-3

回复 使用道具 举报

 楼主| 发表于 2009-3-21 11:29 | 显示全部楼层
Trade of the Day - AAPL
AAPL kept me busy all day. The setup was a long entry on a break of the pre-market high. Price stalled at $72.89 which matched the high set on feb. 24th just before it started to tumble towards its 200 period MA. This indicated a likely failed breakout so I sold my entire position. AAPL tried to rally back up but there was no volume to support price so it tumbled. I grabbed a piece of the short and covered after it capitulated on a big volume spike. My last trade was a long entry as AAPL tried to recover and failed again when it ran into its intraday downtrend line. For the day we have doji bar with a longer upper shadow. It will be interesting to see where AAPL goes from here.

[url=][/url]
Posted by Jamie at 5/04/2006 04:20:00 PM 4 comments


In Play
Long AAPL and CKFR on the open. Not surprisingly, AAPL could not take out the top of its inverted neckline on the first attempt. It formed a doji evening star on the 15 minute timeframe and is pulling back in an orderly fashion.

[url=][/url]
Posted by Jamie at 5/04/2006 10:53:00 AM 0 comments


Pre-Market
Amtech has downgraded NVDA to hold - trading down in pre-market. This is a watch list stock from last night so we can scratch it off the list for the open.

[url=][/url]
Posted by Jamie at 5/04/2006 09:14:00 AM 0 comments


Wednesday, May 03, 2006Nasdaq versus SPX

This chart shows the relationship between the COMPQ and the SPX. It looks like we are on the verge of a fall which will be led by the NAZ. So starting tomorrow, I'll be reducing my average share size per trade.

[url=][/url]
Posted by Jamie at 5/03/2006 11:34:00 PM 0 comments


Watch List - CKFR, NVDA, RHAT
This is a 15 minute view of CKFR and we'll be watching tomorrow to see if we can break $55.00 (the daily chart was posted in last night's watch list).


NVDA on break of 3 day consolidation pattern.

RHAT - a potential continuation play.
I'm also watching AAPL, and TZOO as have been discussed frequently on this blog lately.


[url=][/url]
Posted by Jamie at 5/03/2006 11:00:00 PM 0 comments


Watch List - Bullish Flag Patterns - TXN, ZRAN, SYNA


[url=][/url]
Posted by Jamie at 5/03/2006 10:45:00 PM 0 comments


Nasdaq Technical Picture
The Nasdaq breached the April low on an intraday basis, but managed to save itself into the close on. Despite all of the afternoon choppiness, the morning session was good for semiconductors and the DDX. Software was the weakest tech sector weighted down by ADBE. Today's NDX winners were GRMN, CTSH, and LRCX. In addition to ADBE, the big losers included BEAS, and XMSR. The only other positive of note was that the last hour of buying took place on higher volume than the rest of the session.

[url=][/url]
Posted by Jamie at 5/03/2006 07:27:00 PM 0 comments


Trade of the Day - TZOO by default
TZOO was the trade of the day by default. I was not aware of how bad my internet connection really was until after I got in the trade and that's why I sold early. The original setup was a buy stop order on a break of the pre-market high which lined up nicely with yesterday's resistance. I couldn't really manage the trade once in, because I was in a complete fog. IB, my execution broker was showing different prices than Esignal (my trading platform).

TZOO made a higher high and higher low today, so it will be on the watch list again for tomorrow.

[url=][/url]
Posted by Jamie at 5/03/2006 04:08:00 PM 0 comments


Mid-day Update
I'm back in business. A faulty modem was causing my internet service to fade in and out several times daily, and we all know how fatal that can be for day traders.

Although I wasn't able to trade, I noticed some nice moves from the Watch List - CYMI did a perfect pivot this morning and is up $2.50. TZOO hit the ground running and I thought I had sold near the high this morning. Not quite, shy by almost a point. It has pulled back sharply. We probably won't get another move from TZOO today, but it could be on the watch list again for tomorrow. AAPL took a dive off of the open this morning but is recovering nicely.

We also had two big winners from the Focus List published early yesterday morning:
LRCX and OVTI have had nice breakouts and are up 2.5 pts each.

The SOX is finally having a good day!

Update 2:30 EST - The NAZ has violated the April low on an intraday basis. Let's see how we close.

[url=][/url]
Posted by Jamie at 5/03/2006 12:57:00 PM 0 comments


Newer Posts Older Posts Home
金币:
奖励:
热心:
注册时间:
2006-7-3

回复 使用道具 举报

 楼主| 发表于 2009-3-21 11:30 | 显示全部楼层
ADSK - Corrective Phase After Big Move
Keeping an eye on ADSK as we approach oversold levels and an imminent ADX crossover. If and when ADSK resumes its uptrend, we should get a nice big move.

[url=][/url]
Posted by Jamie at 5/03/2006 01:03:00 AM 0 comments


TZOO - Don't Miss the Next Big Move


I promised to keep monitoring TZOO for the next big move. So far everything is lining up perfectly. We've had a low volume, orderly pullback. Today's action resulted in a higher low and a spinning top type candlestick. So far, the 10 day EMA has held as support on a closing basis. Stay tuned.

[url=][/url]
Posted by Jamie at 5/03/2006 12:36:00 AM 2 comments


ENER


I posted this chart of ENER in the Watch List two days ago. The comments are the same and it won't surprise me if this stock retests $57.50 in the very short-term.

[url=][/url]
Posted by Jamie at 5/03/2006 12:23:00 AM 0 comments


Tuesday, May 02, 2006Watch List - AAPL, CYMI, CKFR, CTXS
AAPL needs more volume to bring this pattern home.


Click on charts for larger views and to read chart notes.


[url=][/url]
Posted by Jamie at 5/02/2006 07:53:00 PM 0 comments


Nasdaq Technical Picture
A narrow range consolidation day on lower volume for the Nasdaq. Although most major tech sectors ended the day in the green, most were just hugging the unchanged line and did little to recapture yesterday's late day losses. The exceptions were networking which had a gain of 1.6% and biotechs which added more losses (1.3%). The RSI, MACD and ADX are all signalling continued weakness so I will be trading cautiously until the situation resolves itself in one direction or another. Today's NDX winners were ATYT, SIRI, and FLEX (all priced under $20) and the losers were GILD, CELG ( way up in AH), and ADSK.

[url=][/url]
Posted by Jamie at 5/02/2006 05:26:00 PM 0 comments


Trade of Day - AAPL and PALM

Another boring day for tech and the Nasdaq. After the first hour, I couldn't find any really suitable trade setups. Both AAPL and PALM were on last night's bullish focus list. The AAPL entry was an upside break of the narrow pre-market trading range (low risk). We had a little shakeout in the 5 minutes pre-ceding the open. I love when this happens. Better before the open than after the open. AAPL was very strong up until 10:30 when the Q's took a quick turn down. The balance was stopped out well before lunch.


PALM's pre-market high lined up nicely with yesterday's high so I placed a buy stop order just above the high. I locked in 50 % profit as the stock weakened shortly after 10:00 and was stopped out on the balance.

[url=][/url]
Posted by Jamie at 5/02/2006 04:08:00 PM 0 comments


In Play
Internet access problems this morning.

Long AAPL and PALM on a break of the pre-market high. Have since locked in 50% profit on both trades.

The fact that the NAZ can't seem to take back its 50 MA on the daily chart is worrisome.

[url=][/url]
Posted by Jamie at 5/02/2006 11:14:00 AM 0 comments


Watch List
Most charts look quite bearish after today's late session fall.

Here is my short list of stocks with bullish potential in the short-term: AAPL, AKAM, BIDU, CKFR, CTXS, CYMI, ENER, INTU, JCOM, LRCX, NVDA, OVTI, PALM, QLGC.

Sorry, no charts tonight.

[url=][/url]
Posted by Jamie at 5/02/2006 12:27:00 AM 0 comments


Monday, May 01, 2006Nasdaq Technical Picture
Click on chart for larger view.

Not that we had a great session going before Maria Bartiromo upset the markets with surprise comments she had with Ben Bernake over the weekend, however, stupidity breeds contempt and that's how I feel towards the M.B., B.B. and CNBC. All tech sectors ended the session in the red. Today's NDX winners were NVDA, AKAM and CMVT and the losers were XMSR, ESRX, and ATVI.

[url=][/url]
Posted by Jamie at 5/01/2006 11:10:00 PM 0 comments


Newer Posts Older Posts Home
金币:
奖励:
热心:
注册时间:
2006-7-3

回复 使用道具 举报

您需要登录后才可以回帖 登录 | 立即注册

本版积分规则

本站声明:MACD仅提供交流平台,请交流人员遵守法律法规。
值班电话:18209240771   微信:35550268

举报|意见反馈|手机版|MACD俱乐部

GMT+8, 2025-7-21 10:26 , Processed in 0.069420 second(s), 9 queries , MemCached On.

Powered by Discuz! X3.4

© 2001-2017 Comsenz Inc.

快速回复 返回顶部 返回列表