- 金币:
-
- 奖励:
-
- 热心:
-
- 注册时间:
- 2006-7-3
|
|

楼主 |
发表于 2009-3-21 10:19
|
显示全部楼层
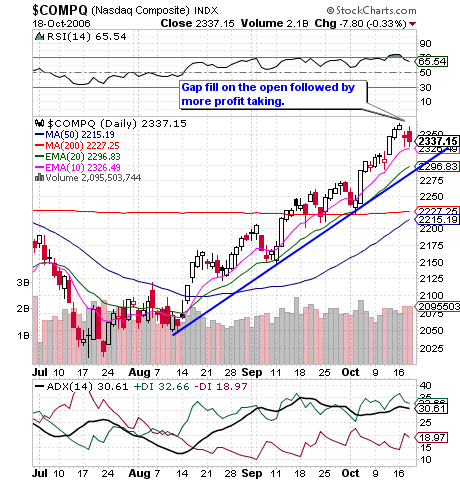
Pre-Market - Thursday November 30th
Indication on RMBS is that news released last night about PS3 inclusion was already well known. Stock continues to go up anyway. Not making a call, just letting you know the situation. Stock now trading at $22.68.
Jefferies notes that the Internet and New Media segment has had a strong performance in the last few weeks, with many stocks approaching their price targets, driven by early signs of positive seasonality and good 3Q results. The firm continues to see upside in Aquantive (AQNT 23.38), Google (GOOG 484.65) and Yahoo (YHOO 27.04); they are buyers of VCLK, NFLX, RATE, VPRT and SFLY on pullback.
Yet another AAPL target increase - Needham raises their tgt on AAPL to $115 from $90 based on a more realistic reading of the switch rates among Windows users that should ensue from the Mac's forthcoming ability to run Windows.
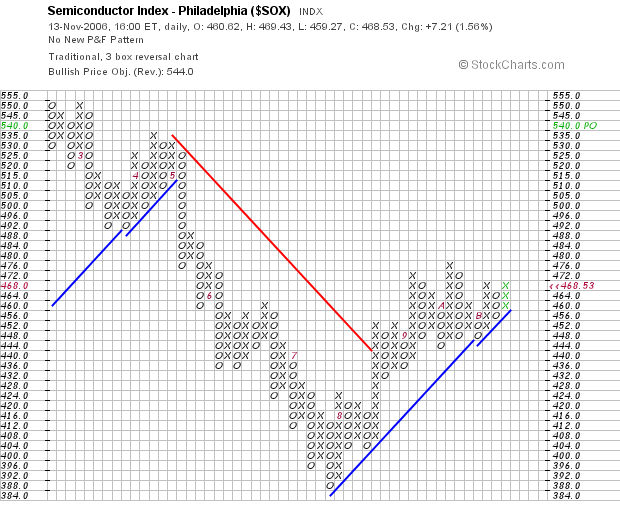
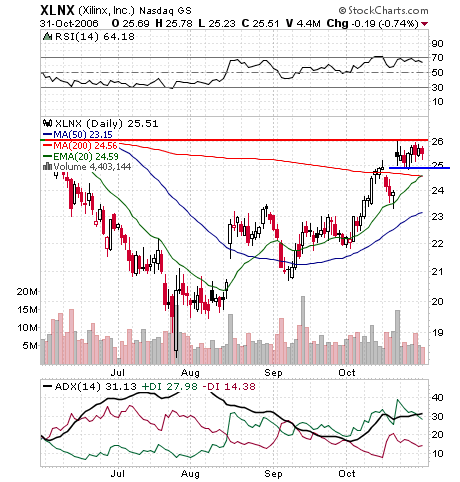
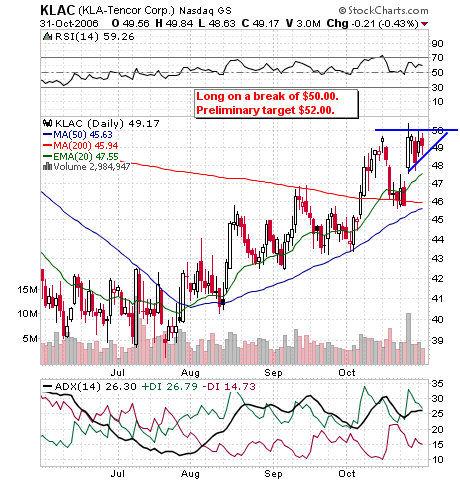
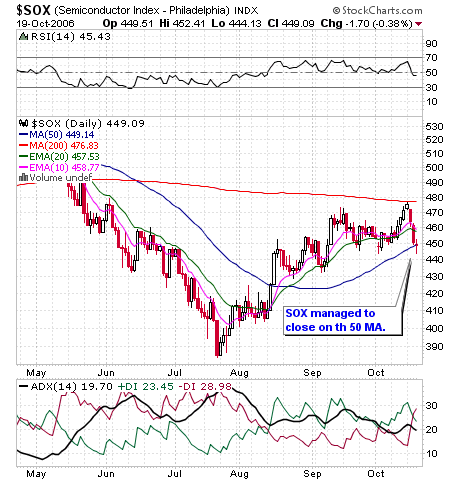
Cautious on semis - Susquehanna say with semi equipment stocks continuing to perform relatively well despite negative data flow, they review their near-term cautious stance on the group (based on deteriorating industry fundamentals). Firm notes that inventory issues still linger across the semiconductor landscape, with the problem particularly acute in microprocessors (where the INTC/AMD price war continues), and analog (where the handset and high-performance analog markets seem poised to continue to disappoint relative to outsize growth expectations). They expect this capacity overhang to ripple quickly through the supply chain in the form of more severe wafer start reductions in C4Q06/C1Q07 at foundries such as TSM and UMC, and believe that plans to idle tools or even entire production lines over the year-end holiday season, as well as the Lunar New Year, are already in place. Firm notes that NVLS is their favorite short ahead of mid-quarter update on Dec. 4.
So far same store sales are disappointing as a whole.
Courtesy of Briefing.com
[url=] [/url] [/url]
Posted by Jamie at 11/30/2006 07:55:00 AM 0 comments 
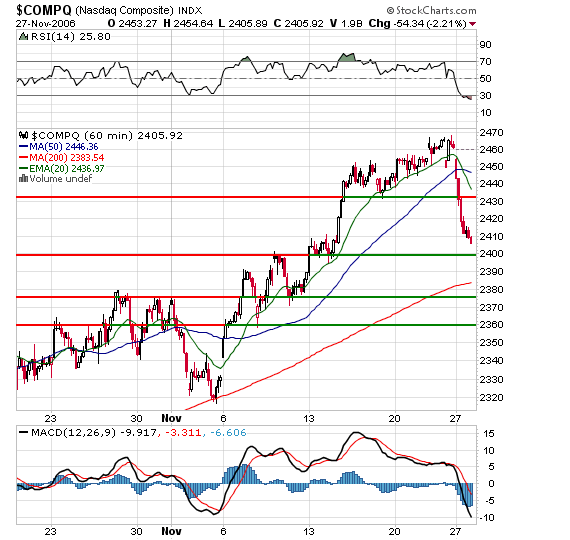
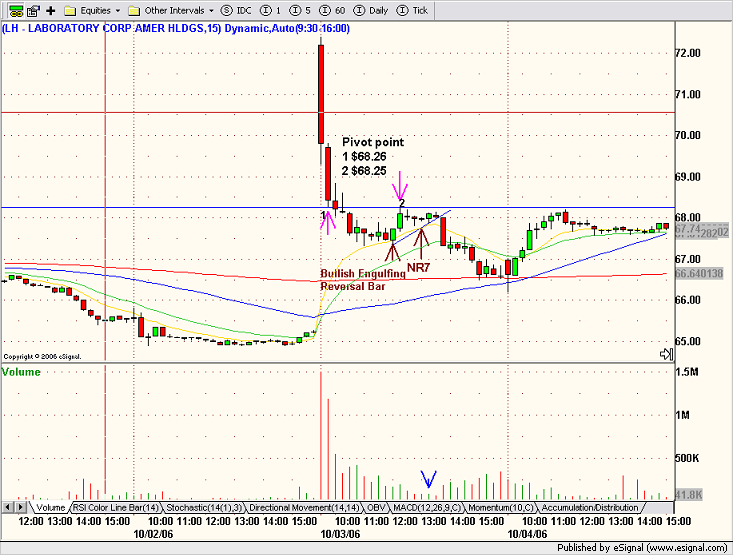
Wednesday, November 29, 2006Support and Resistance
A few days ago, David asked me for some knowledge sources regarding support and resistance and I recommended Stockcharts.com - chart school as well as two books that cover the subject thoroughly:
 Martin Pring
 John Murphy
Here's another good article "Support and Resistance Reversals" that I found courtesy of Trader Mike's daily feed. Thanks Mike!
[url=][/url]
Posted by Jamie at 11/29/2006 08:35:00 PM 0 comments
Labels: Support_Resistance
Trade of the Day - None
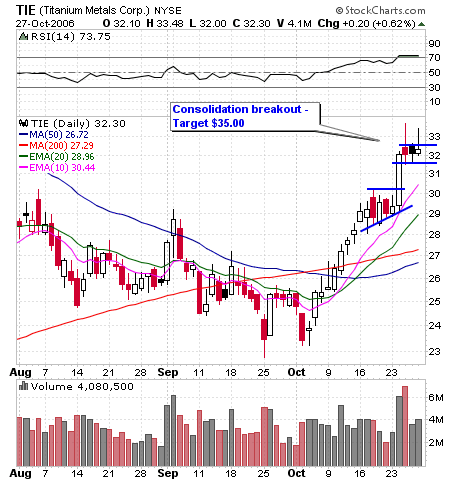
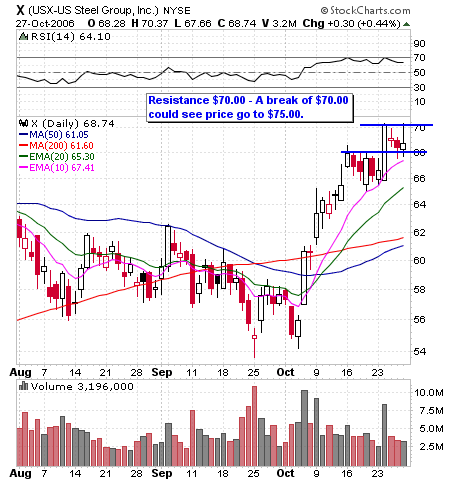
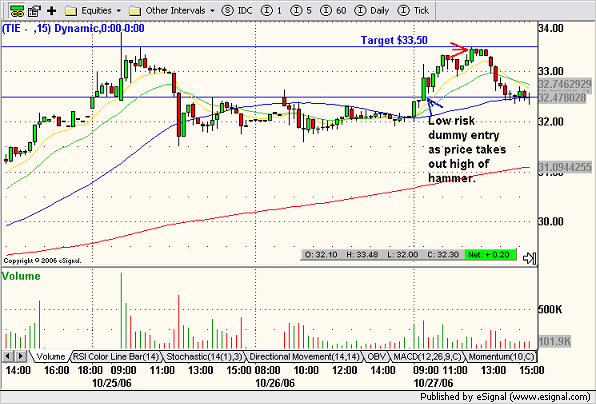
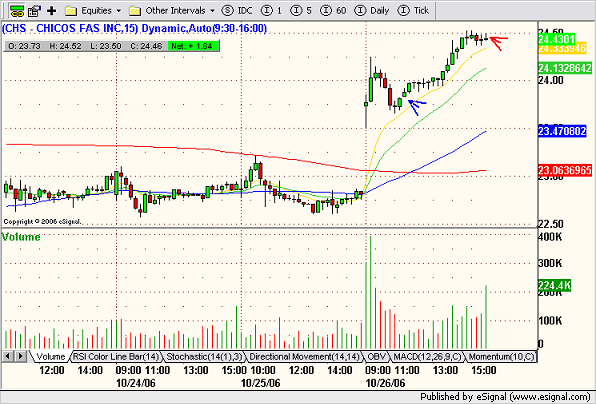
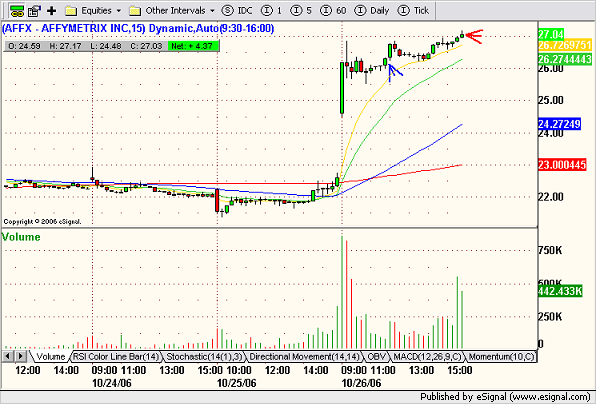
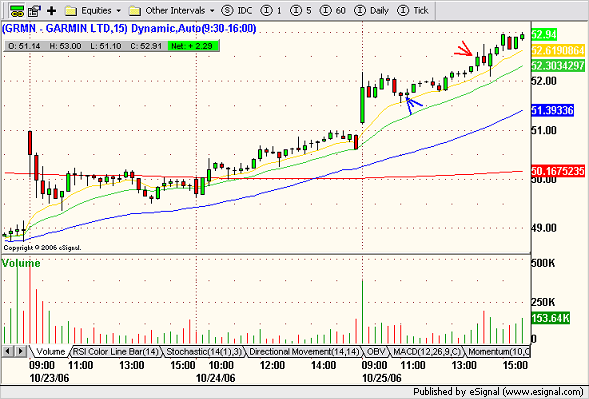
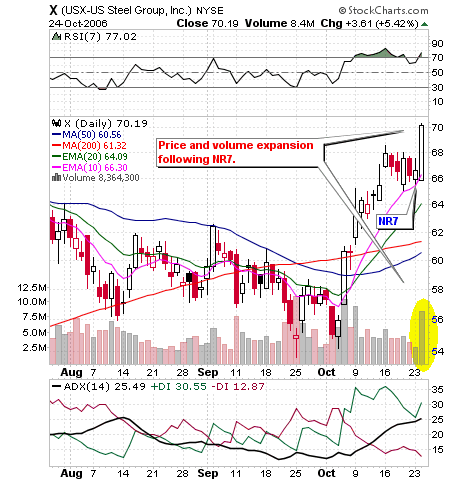
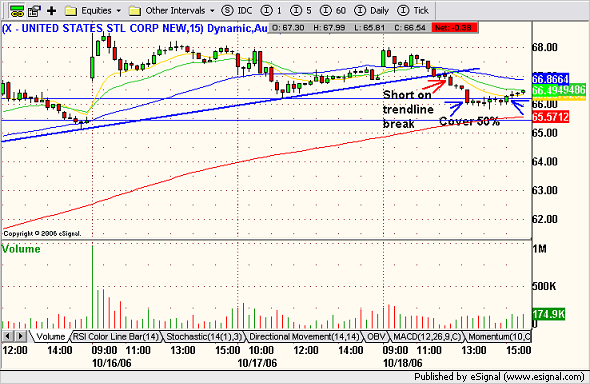
Not for lack of opportunity. I was stalking the metals sector early on and was hoping to get long Titanium Metals Corp. (NYSE:TIE) after the gap consolidation. Unfortunately, the consolidation took too long and I wasn't around when the break took place. Here are the charts - 15 minute and the 5 minute, the latter accentuates volume contraction during consolidation and expansion on the price break. Also check out the charts for IPS and X. Now that tech is losing its leadership, XLB might offer some strength.
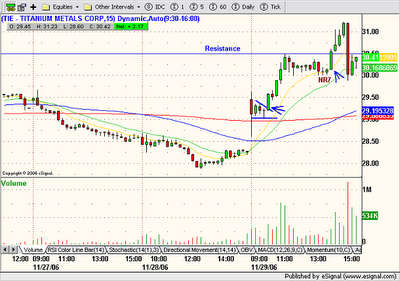
 Notice how sharply TIE fell after it failed to stay above $31.00. I try to always move my stop just above the dollar number in late day trading because when price fails at the dollar level, it can cause a lot of slippage. Notice how sharply TIE fell after it failed to stay above $31.00. I try to always move my stop just above the dollar number in late day trading because when price fails at the dollar level, it can cause a lot of slippage.
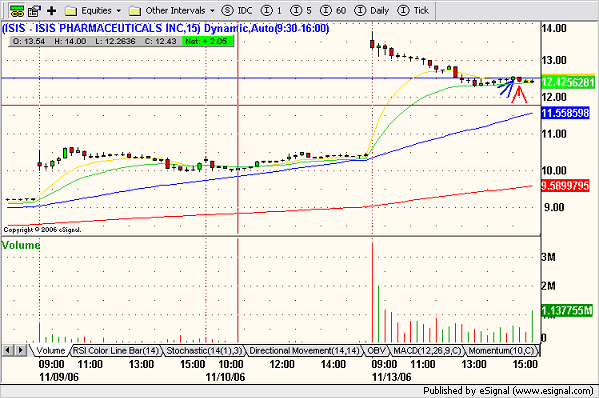
On another note, if anybody followed up on my pre-market post - (NASDAQ:MSCS) - Insider Buying - here's the chart:

[url=][/url]
Posted by Jamie at 11/29/2006 07:08:00 PM 2 comments
Labels: Dummy, Gapper, NR7
Pre-Market - Wednesday November 29th
Another slow news day.
Momos in play:
AAPL up in pre-market - another target raised, this time at Bear Stearns; NYX sellers pushing this one down on JP Morgan downgrade.
Very nice-sized insider buys posted last night for MSCS, it'll be one to keep an eye on again today. CEO buys 115k shares in the $13.43 to $13.60 range. President of the co buys 20k shares at $13.52. We see the insider buys as important, given that we see MSCS as a value play, and a possible acquisition. Thinking this could be the day the stock closes above resistance at $14. - Courtesy of Briefing.com
[url=][/url]
Posted by Jamie at 11/29/2006 08:11:00 AM 0 comments
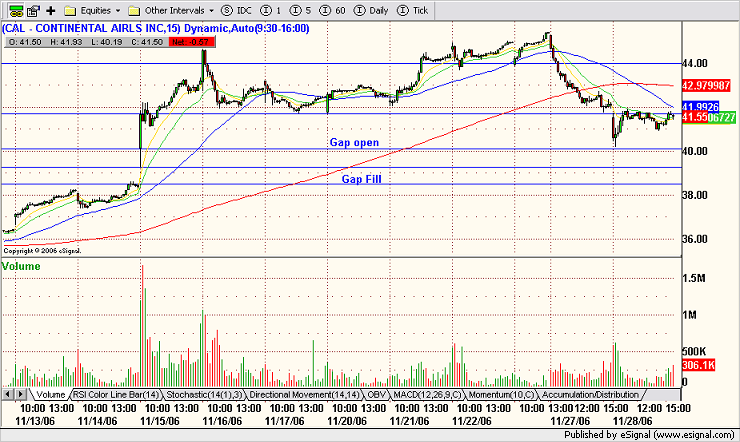
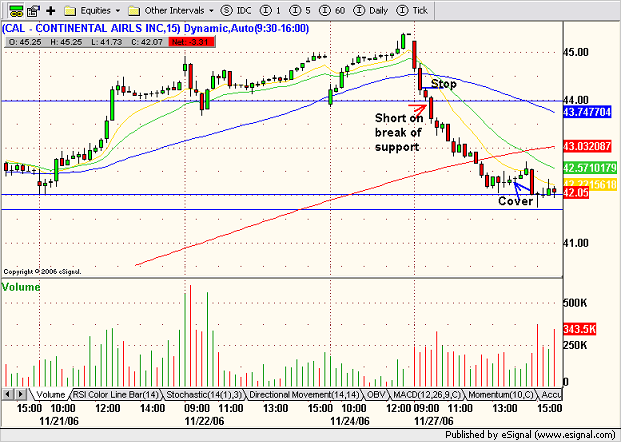
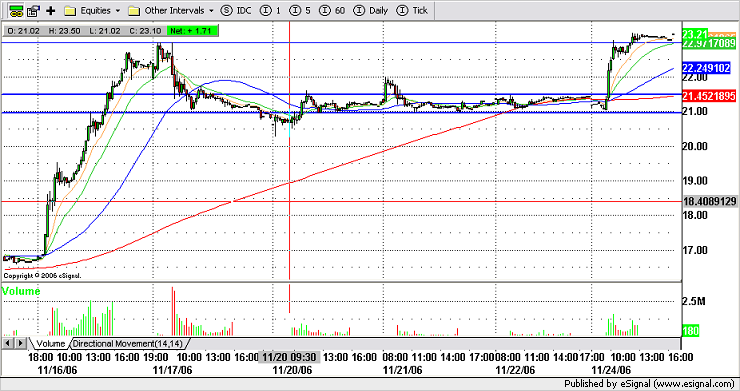
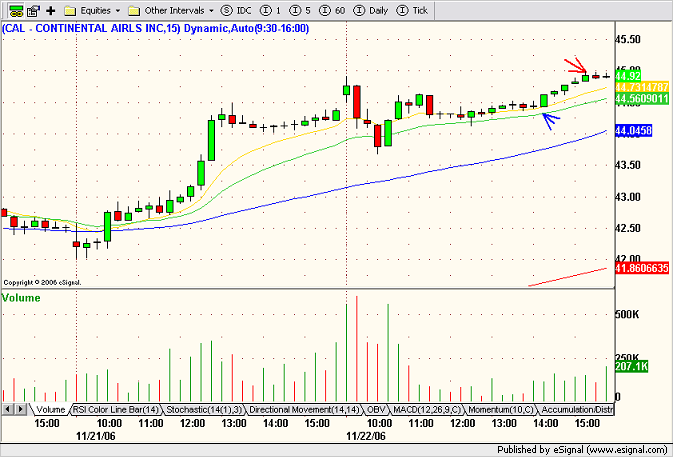
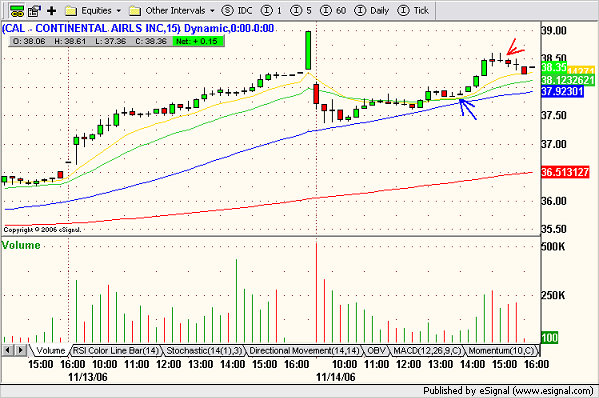
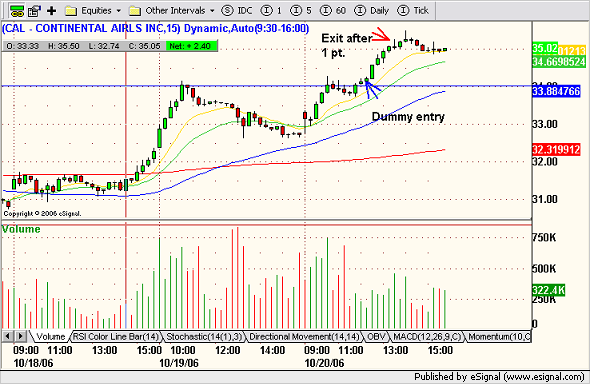
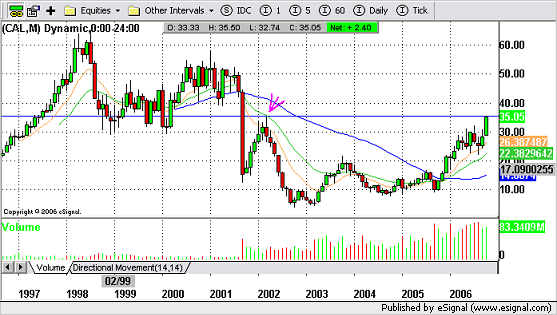
Tuesday, November 28, 2006Trade of the Day - Continental Airlines, Inc. (Public, NYSE:CAL)
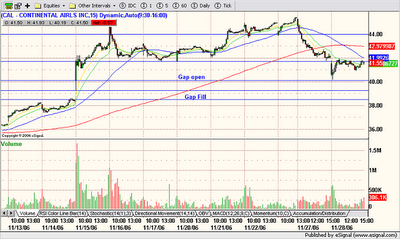
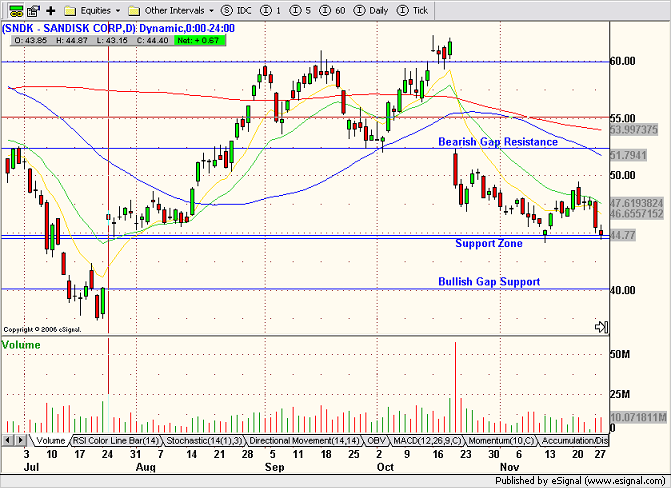
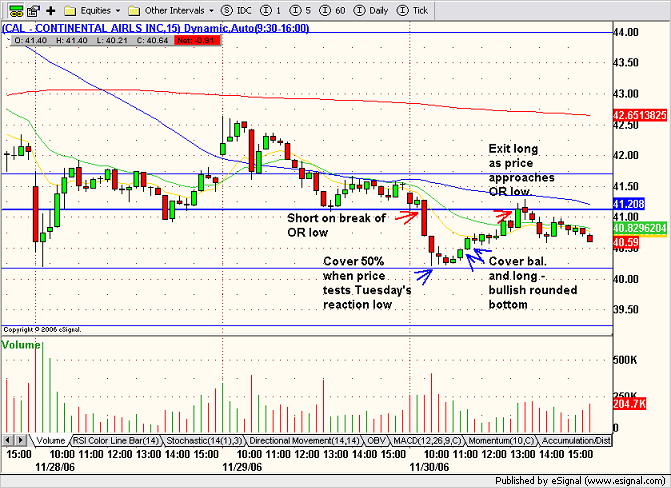
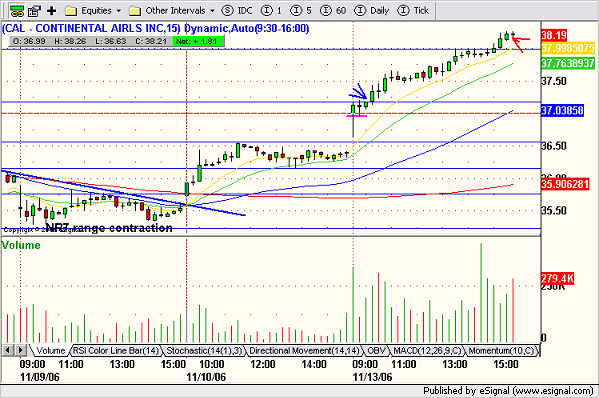
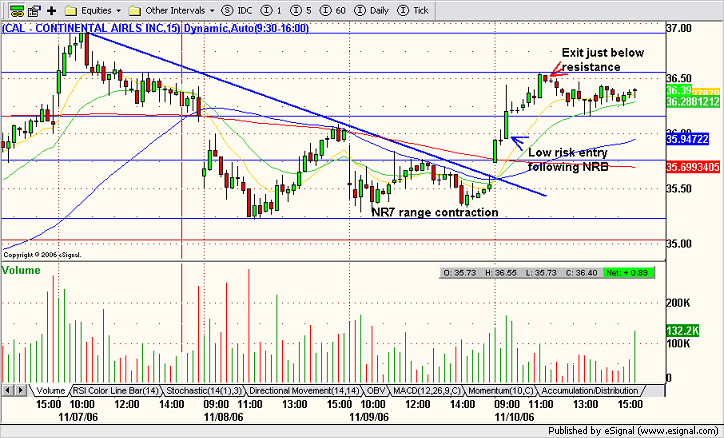
 The first chart is a wide range view of CAL over the last few weeks. The blue lines are key support and resistance levels. Of course, when support is broken, it becomes resistance. So yesterday's support is today's resistance. The first chart is a wide range view of CAL over the last few weeks. The blue lines are key support and resistance levels. Of course, when support is broken, it becomes resistance. So yesterday's support is today's resistance.
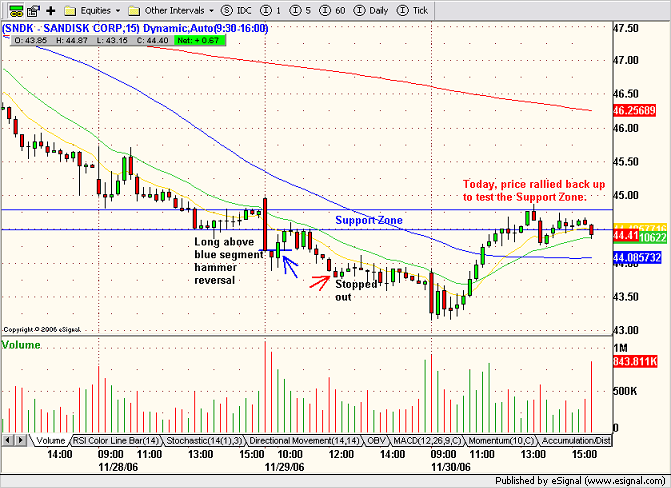
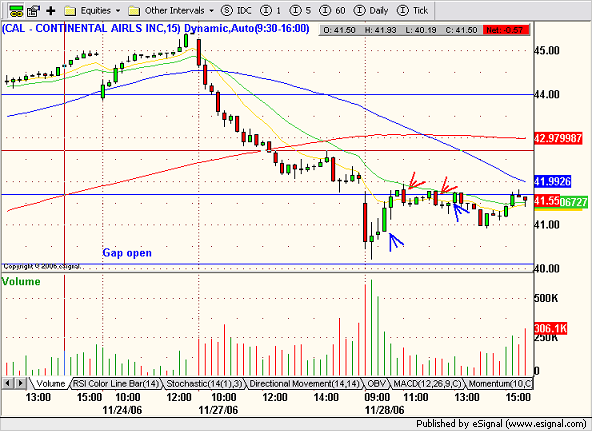
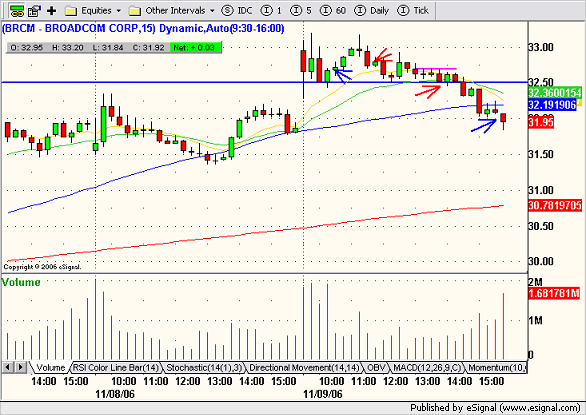
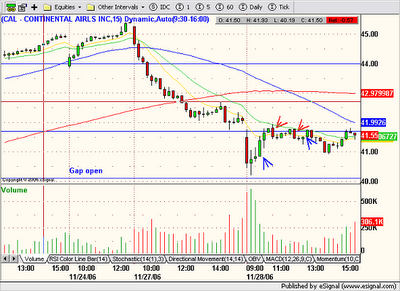
The second chart is a closer view of the same 15 minute timeframe. CAL gapped down on the open and quickly fell towards the gap open support level dating back to November 15th. The next bar signaled indecision and the third bar moved slightly higher. Volume on the second and third bars was very bullish, so I took a low risk, long entry as the fourth bar opened up. My target was a gap fill. As soon as price tagged the downsloping 20 period EMA, I took my profit.
I shorted CAL on a lower high about an hour later. Midday it formed a perfect hammer, signaling a potential reversal. I immediately, tightened my stop to breakeven just in case and I was stopped out on the next bar. I waited to see if another long entry would setup, but decided to call it a day when the stock came into a third wave of weakness. The chop chop game is a no win situation when it comes to trading.
[url=][/url]
Posted by Jamie at 11/28/2006 07:13:00 PM 2 comments
Labels: Gapper, Short, Volume
Pre-Market - Tuesday November 28th
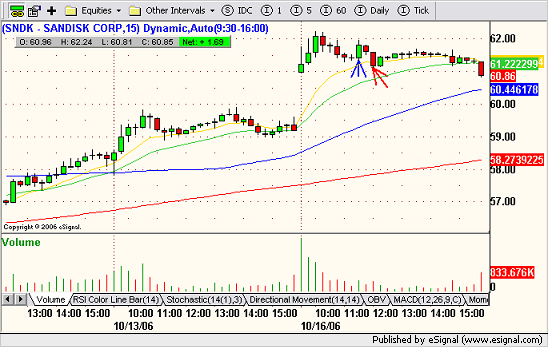
WSJ reports on Amazon.com's Top 10 selling list for electronics yesterday, seven of the 10 products were digital media players. Nowhere did the Microsoft or Zune names appear. "That's a pretty good indicator of consumer interest," Michael Gartenberg of industry group Jupiter Research said yesterday, one of the busiest days of the year with online shoppers. The 30-gigabyte Zune player from Microsoft was on the Top 10 list of Amazon (AMZN) for several days after its release on Nov. 14 before dropping off. But yesterday, the most popular model of the Zune, the black version, was at No. 76. The Top 10 digital media players included six iPods from top-seller Apple Computer (AAPL) and one MP3 player from SanDisk (SNDK). "The product [Zune] wasn't particularly attractive. At the end of the day, you put it on a shelf and it just didn't compare," said Rob Enderle of research firm Enderle Group. Sales of Zune in the first week after the Nov. 14 launch were "exactly within our expectations," a Microsoft spokeswoman said. She added that she is still awaiting information for holiday weekend sales.
WSJ reports Google's video-sharing Web site YouTube agreed to bring its popular content to cellphones through a partnership with Verizon Wireless (VZ)(VOD), a move that will give the wireless carrier a selling point for its subscription multimedia service and a temporary edge over competitors. Verizon Wireless will have exclusive rights to YouTube's mobile content for a "limited" time. The cos won't say for how long. Over time, YouTube is likely to seek similar partnerships with the other leading cellular operators, including Cingular Wireless (T)(BLS), Sprint Nextel (S), and T-Mobile USA. Steve Chen, chief technology officer and co-founder of YouTube, declined to comment on discussions with other wireless carriers but said the co would "roll out more exciting partnerships and features for the mobile user over the coming year."
Courtesy of Briefing.com
My note: Lack on any real compelling news items so far this morning. Some stocks such as AAPL are trading up in pre-market and may be setting up for more short plays.
[url=][/url]
Posted by Jamie at 11/28/2006 08:15:00 AM 0 comments
Newer Posts Older Posts Home |
|
|
 [复制链接]