Sunday, October 15, 2006Watch List - ENER, BRCM, JOYG, SNDK
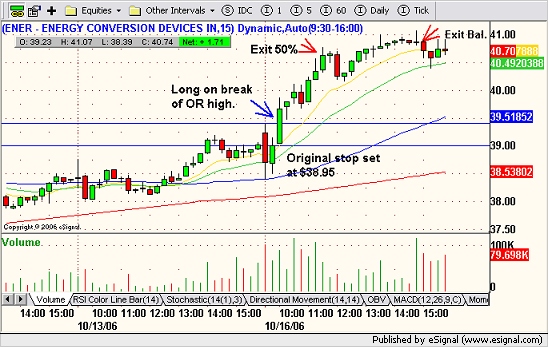
 Energy Conversion Devices, Inc. (Public, NASDAQ:ENER) could move higher after consolidating its recent gains. Target the 200 MA. Energy Conversion Devices, Inc. (Public, NASDAQ:ENER) could move higher after consolidating its recent gains. Target the 200 MA.
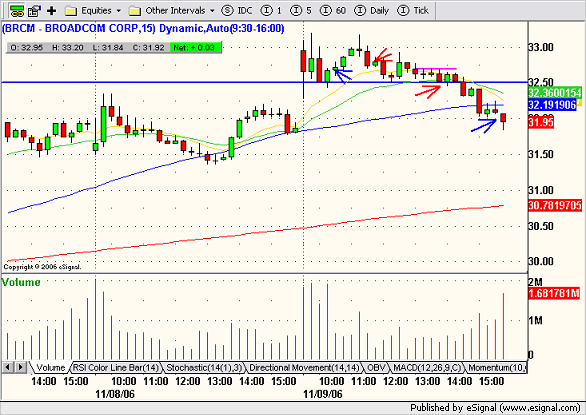
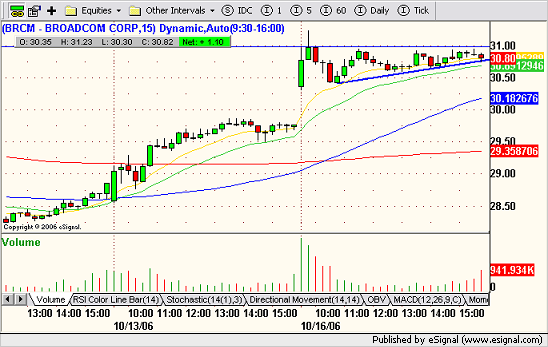
 Broadcom Corporation (Public, NASDAQ:BRCM) looks poised to test resistance ahead of earnings on Thursday AH. Broadcom Corporation (Public, NASDAQ:BRCM) looks poised to test resistance ahead of earnings on Thursday AH.

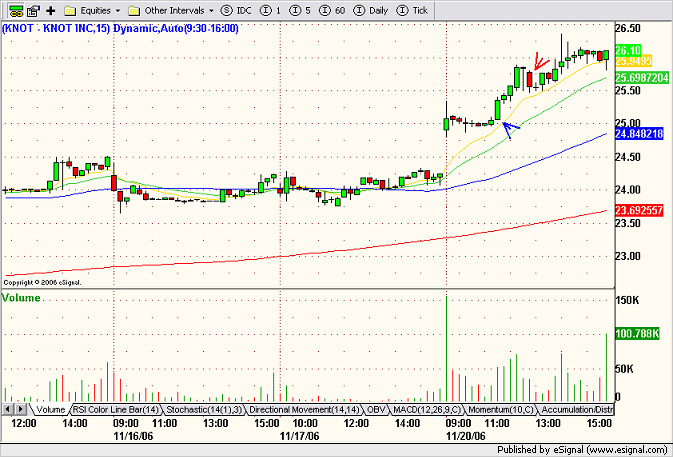
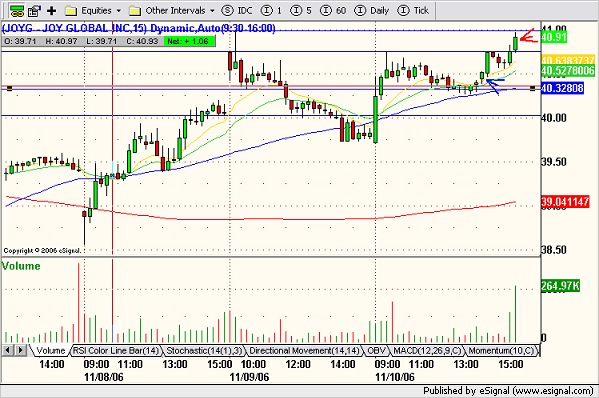
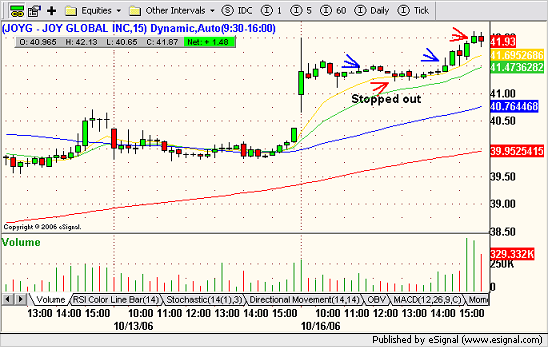
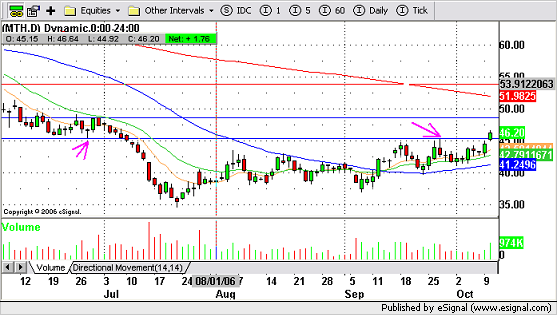
Joy Global Inc. (Public, NASDAQ:JOYG) is currently consolidating its last leg up from $36.00 to $41.25. Friday it carved out a NRB which could be NR7. Look for a high volume break of reistance at $41.25 with a target of $46.00 (not necessarily all in one session).
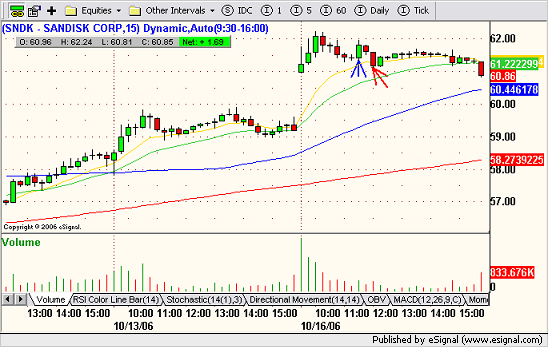
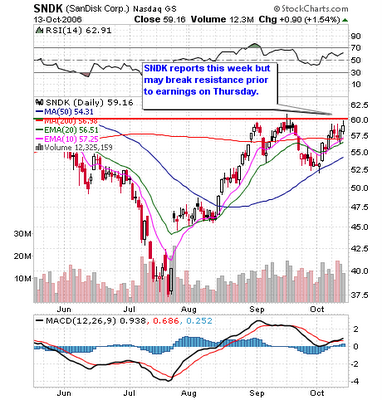 SanDisk Corporation (Public, NASDAQ:SNDK) looks poised to break resistance at $60.00 anytime soon. SNDK reports Q3 earnings on Thursday AH. Unlike the last test of this level, the MACD now looks bullish. SanDisk Corporation (Public, NASDAQ:SNDK) looks poised to break resistance at $60.00 anytime soon. SNDK reports Q3 earnings on Thursday AH. Unlike the last test of this level, the MACD now looks bullish.
[url=] [/url] [/url]
Posted by Jamie at 10/15/2006 10:14:00 PM 0 comments 
Labels: Watchlist
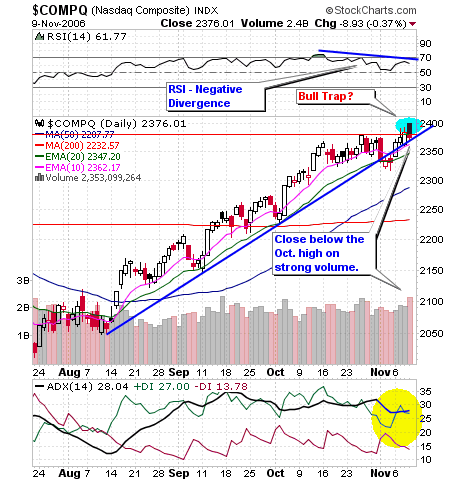
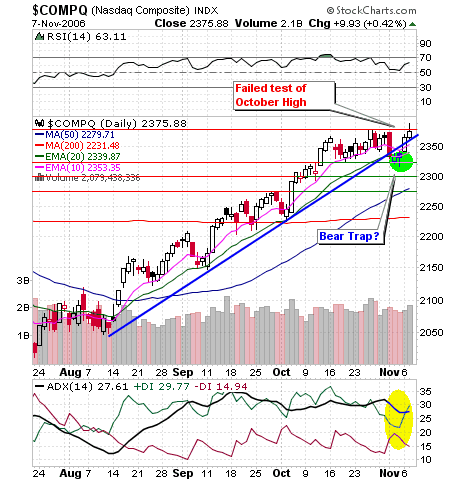
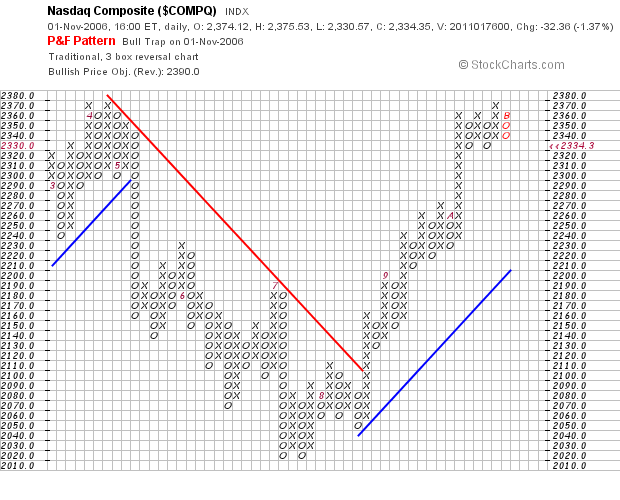
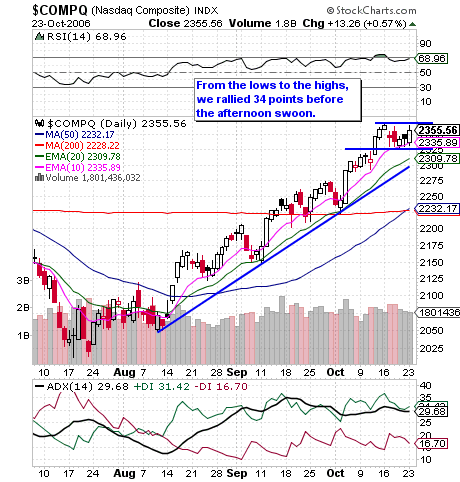
NASDAQ Technical Picture - Technical Resistance Looms Large
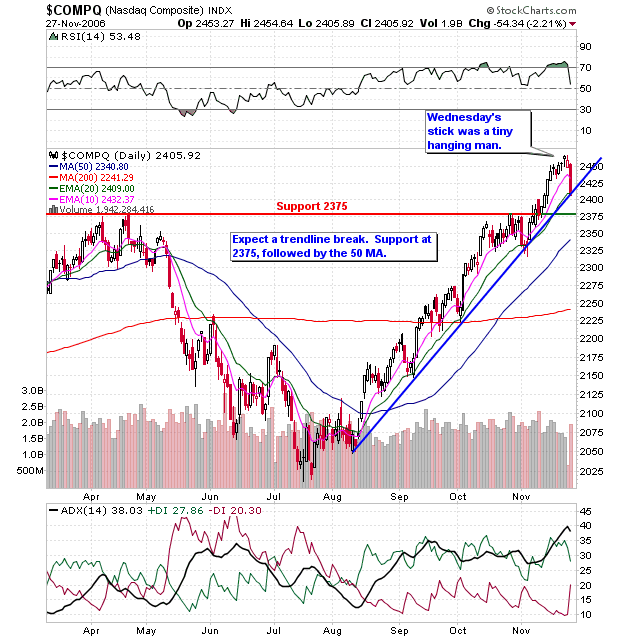
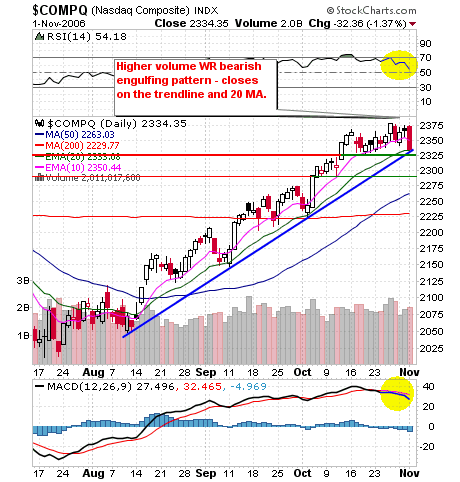
Daily Timeframe

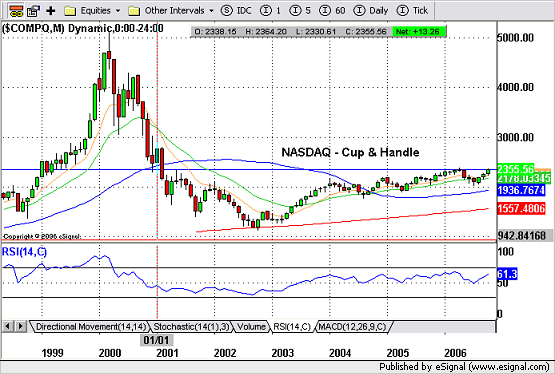
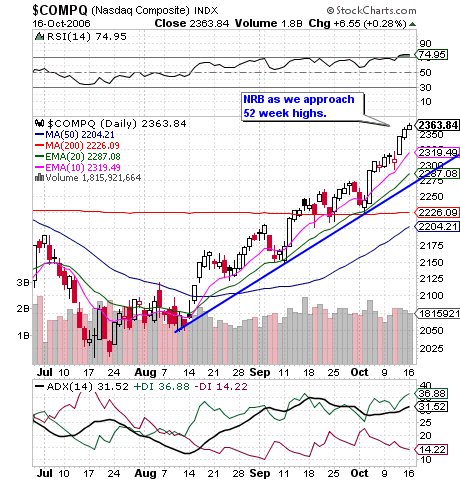
Weekly Timeframe
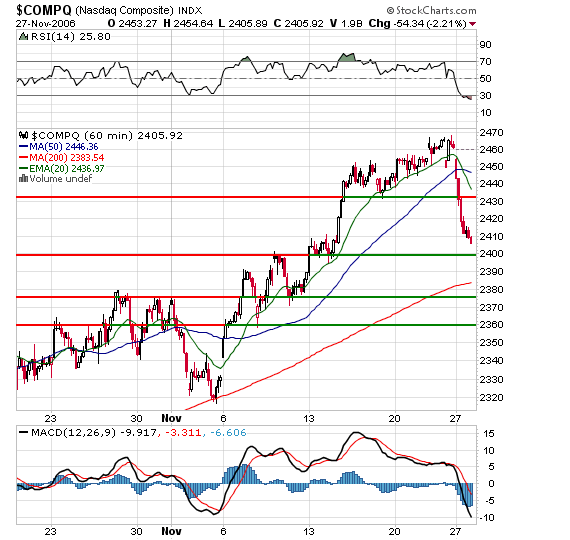
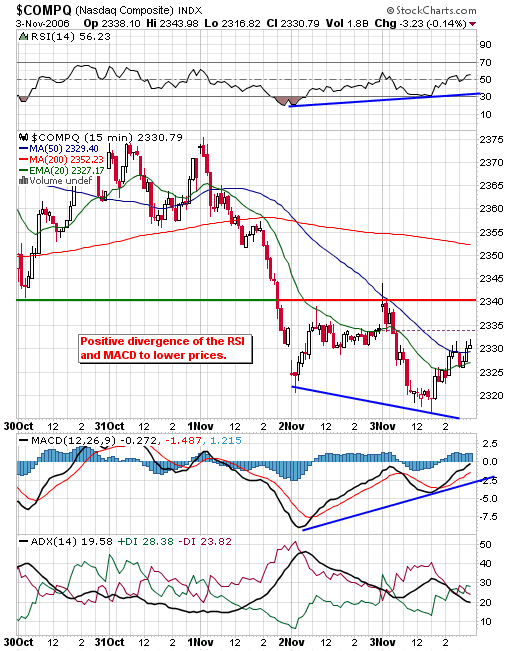
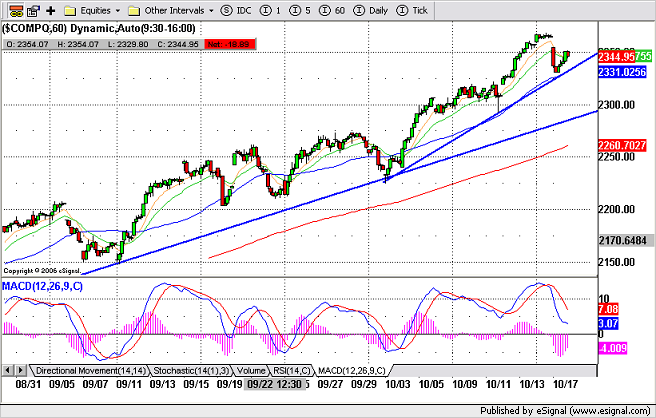
 60 Minute Timeframe
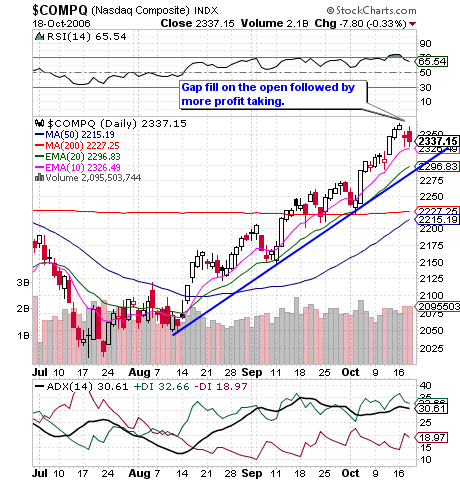
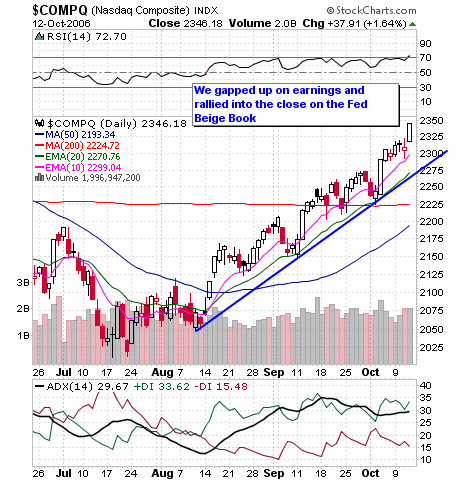
From the weekly timeframe, we can see that the NASDAQ is fast approaching the 52 week high set last April. The 60 minute timeframe shows that the delta between price and the trendline is extremely wide, so much so that an accelerated trendline is in play. I'll be watching this trendline closely to see if and when, a tradable pullback or trend reversal comes into play.
In the meantime earnings rule, and the big ones to watch this week are:
Tuesday AH: IBM, INTC, MOT, YHOO
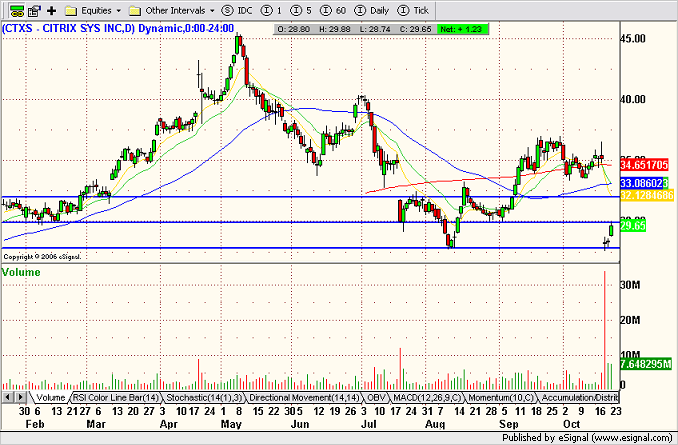
Wed. AH: AMD, AAPL, CTXS, EBAY, GILD, JNPR, NVEC, PLCM
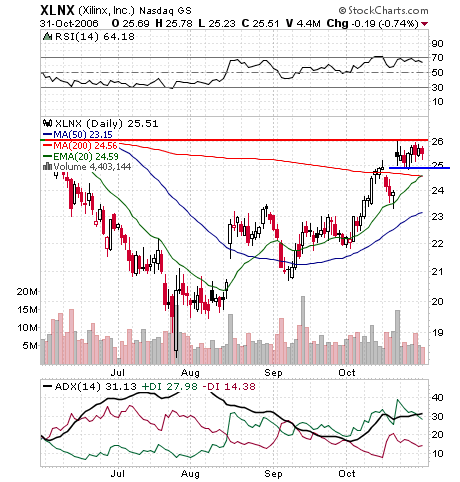
Thurs. AH: BRCM, GOOG, SNDK, RBAK, XLNX
We have no major economic data tomorrow.
[url=][/url]
Posted by Jamie at 10/15/2006 04:53:00 PM 0 comments
Labels: NASDAQ
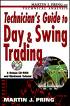
Anatomy of a Gap Down Reversal - Polaris Industries Inc. (Public, NYSE:PII)
A reader asks how to play the gap down and reversal on PII. Before analysing a possible setup, let's look at a little background and the technical aspect of the daily chart.
PII gapped down on Thursday October 12th on an earnings miss and downside guidance. It was trading down more than 5% in the pre-market.
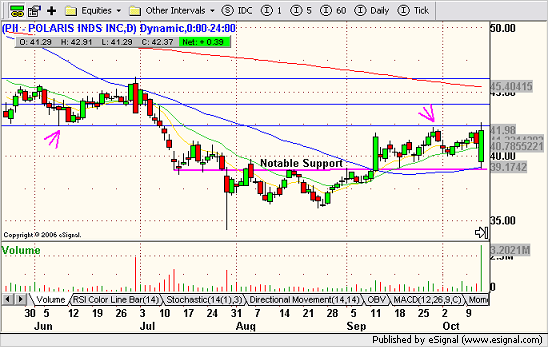
A quick look at the daily timeframe showed that PII would likely open near notable support (pink segment) and the 50 day MA which had little or no slope (flat). The two pink arrows mark pivot point resistance on the long side.
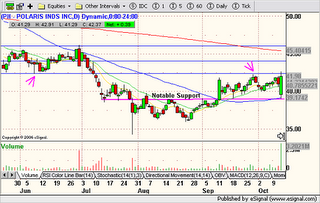 Daily timeframe
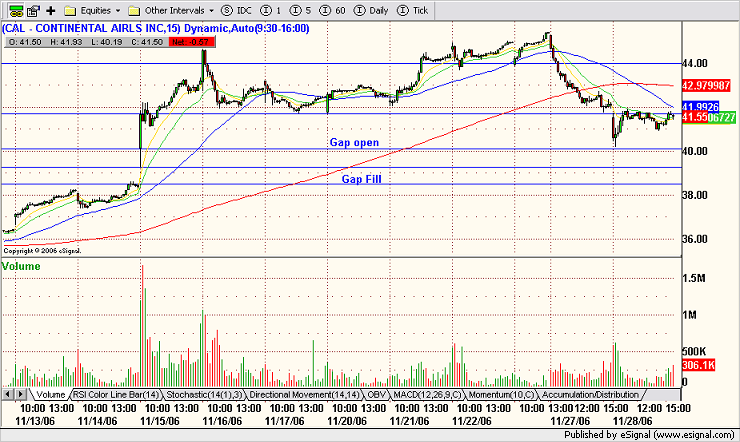
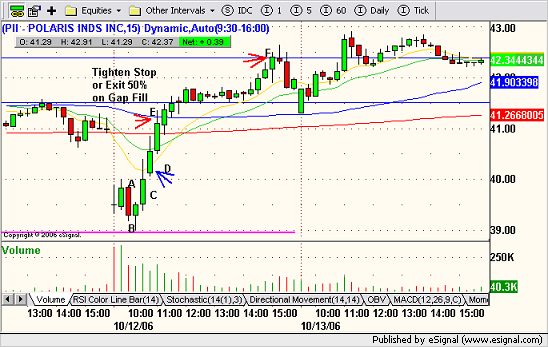
Now if we move to the 15 minute timeframe, we see that PII opens just 50 cents shy of technical support carving out a doji with a long upper shadow. The next bar is bullish and takes out the high of the OR but closes below the OR high, however it generates a higher low.
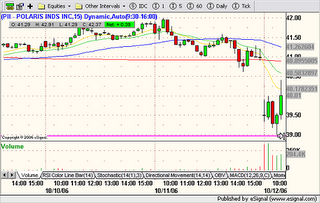
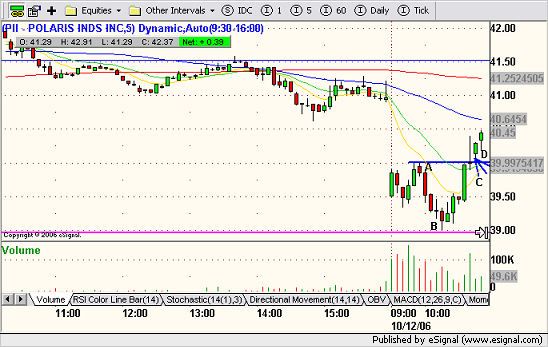
15 minute timeframe If we flip over to the 5 minute timeframe, we see that the downsloping 10 period MA is coming down to help push price lower. The first half hour of trade has been NR basically trading between $40.00 and $39.50. At point A, where the 10:00 bar takes out the low of the 9:55 bar, we might decide to take a short position with a preliminary target of $39.00 because the risk reward ratio is very favorable. Our risk is approx. $0.25 and out reward $0.75. As price approaches point B, we would lock in 50% of our profit and hope for a tight consolidation before breaking technical support (pink segment). At point C, we are starting to have doubts because the technical bounce has legs ie. more price momentum than typically corresponds to a consolidation or pullback. Inevitably, we are expecting to get stopped out, but still hoping that the downsloping 20 MA will be observed as resistance. When that doesn't happen, we get stopped out, however, we still have a 50% profit on the trade.
Now getting back to the reader's original question, how to play PII long on a gap fill scenario. Once price has closed above $40.00, it seems clear that a gap fill is in play, so a long entry would be taken around point D, with a stop 10 cents below the 20 MA. This an aggressive play and I would not have taken it, especially with the 50 MA swooning down midway between $40 and $41.oo
 5 minute timeframe
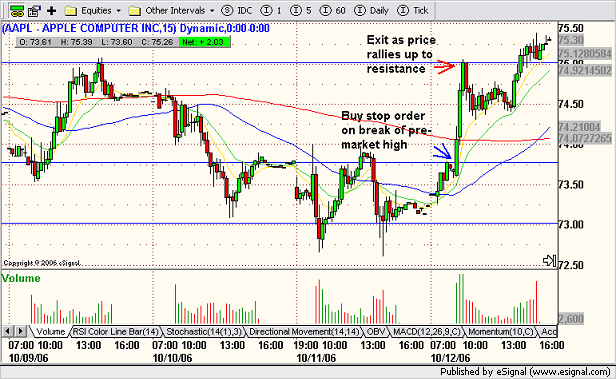
Going back to the 15 minute view, we can manage the trade from this longer timeframe once the long is safely underway. Exit 50% on the gap fill and set a tight stop as price approaches the previous day's afternoon high. The uppermost blue line marks pivot point resistance from the daily view, so if you are still in the trade beyond the gap fill, this is an ideal exit target.
 15 minute timeframe Technical bounces can be very powerful trading opportunities, however, given the fundamental scenario of missed earnings and lowered guidance in the case of PII, it is unlikely that most traders could have predicted the ultimate outcome. In analysing this trade setup, I tried to put myself in the trade at the time it happened, without the benefit of hindsight. As indicated above, it is very unlikely that I would have pursued the long side of the trade after being stopped out on the second half of my original short. Also notice that there were no real low risk entry opportunities on the 15 minute timeframe leading into the gap fill.
[url=][/url]
Posted by Jamie at 10/15/2006 10:01:00 AM 2 comments
Labels: Gapper
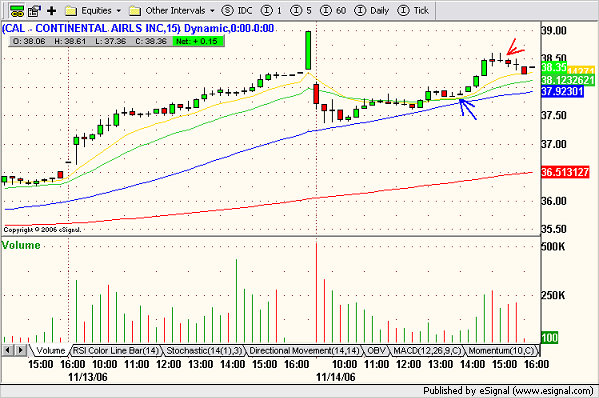
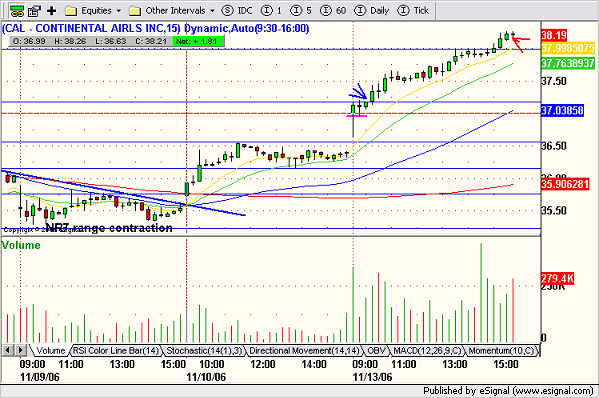
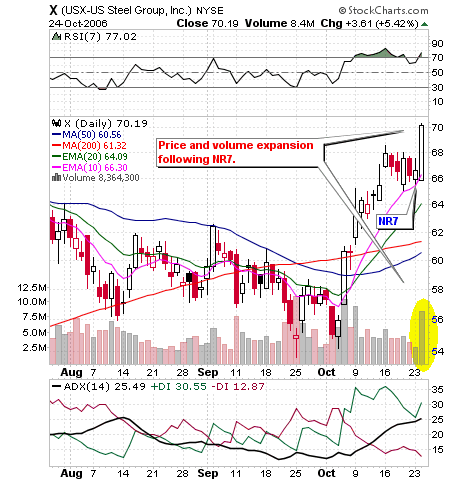
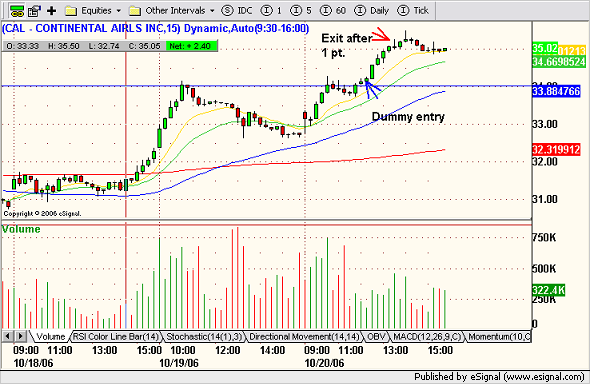
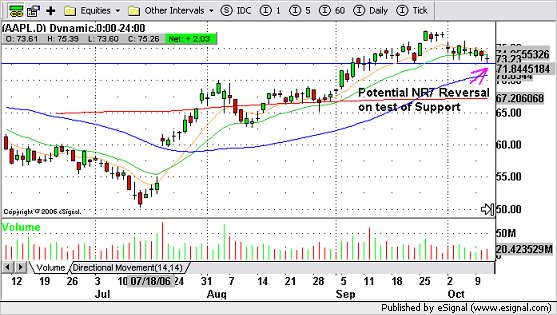
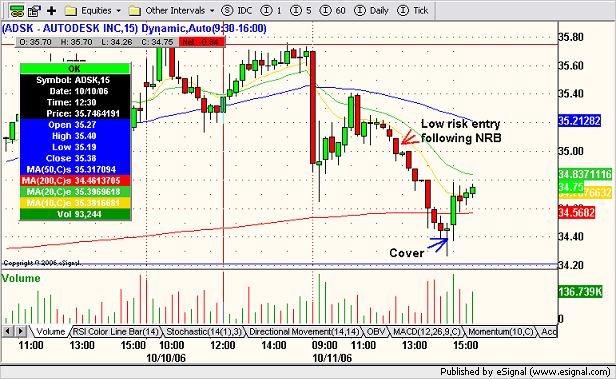
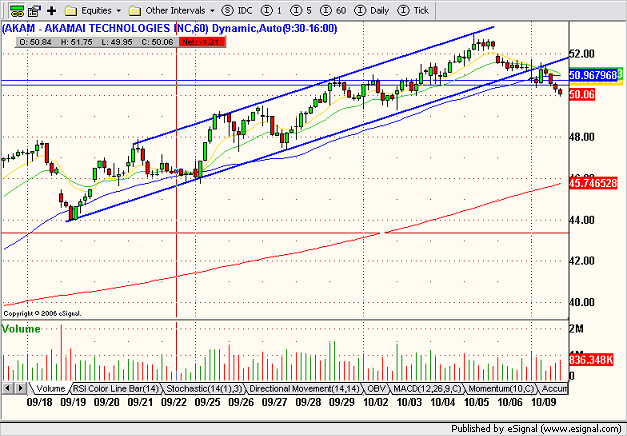
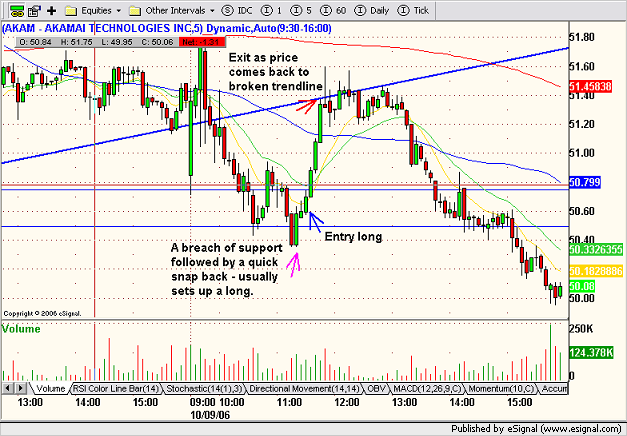
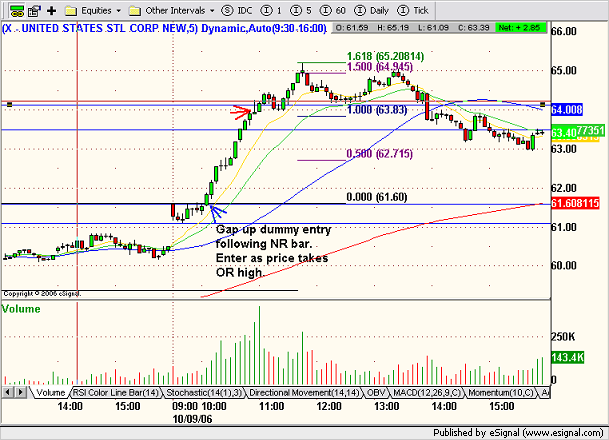
Friday, October 13, 2006Trade of the Day - United States Steel Corporation (Public, NYSE:X)
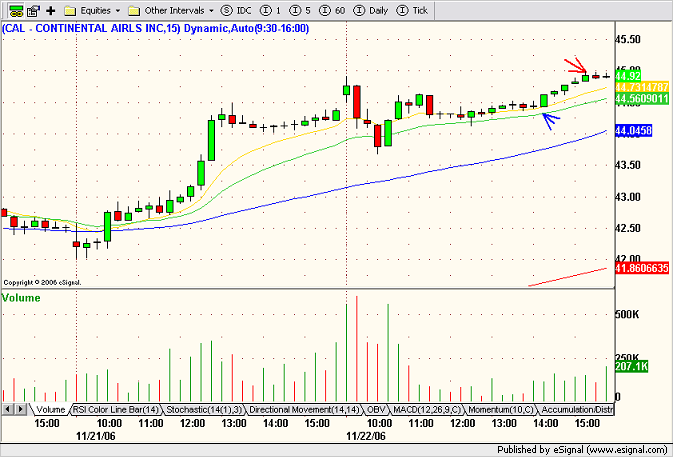
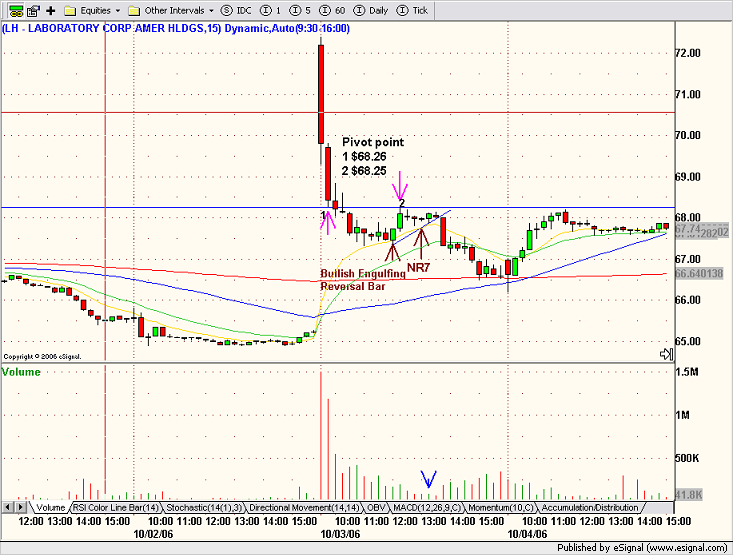
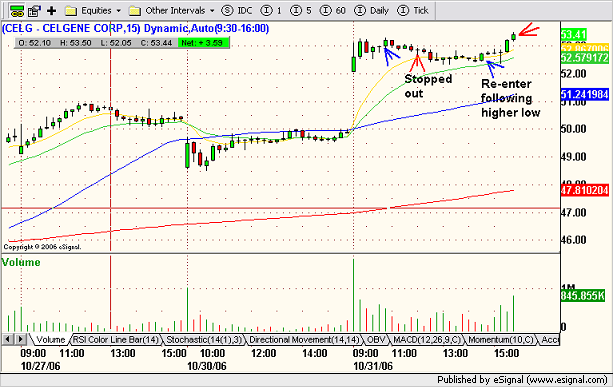
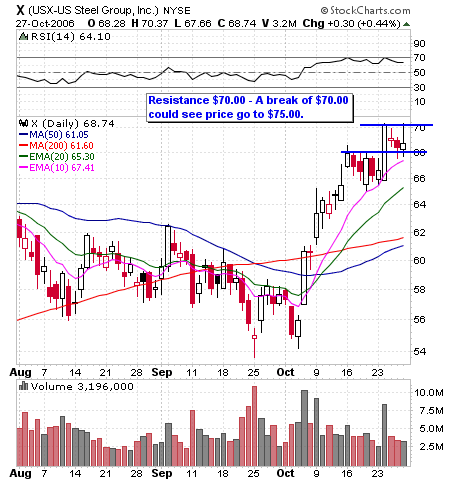
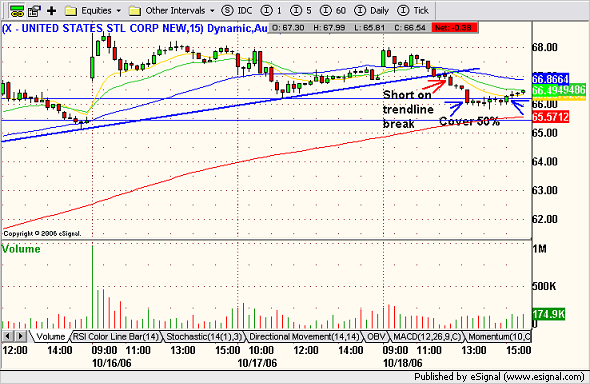
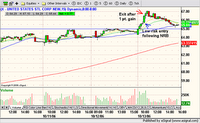 I couldn't find any good gapper setups this morning so I quickly ran through my usual suspects. After a quick look at X, I realized that I had missed one of my classic bread and butter entries on a three day consolidation breakout. The only thing I could do at that point was wait for a consolidation as the move was well underway and I didn't want to chase it. I took a long entry after a NRB printed on the 15 minute timeframe. Since X was already up a dollar, I kept a close eye on it as I didn't know how much further it could go on a Friday. As soon as I had a dollar gain, I closed my entire position. That was it for me. I don't particularly care for Friday afternoon trading as it is often narrow and choppy. My exit was almost perfectly timed because after tagging $67.00, volume dried up and X had a stair step decline for the balance of the session. I couldn't find any good gapper setups this morning so I quickly ran through my usual suspects. After a quick look at X, I realized that I had missed one of my classic bread and butter entries on a three day consolidation breakout. The only thing I could do at that point was wait for a consolidation as the move was well underway and I didn't want to chase it. I took a long entry after a NRB printed on the 15 minute timeframe. Since X was already up a dollar, I kept a close eye on it as I didn't know how much further it could go on a Friday. As soon as I had a dollar gain, I closed my entire position. That was it for me. I don't particularly care for Friday afternoon trading as it is often narrow and choppy. My exit was almost perfectly timed because after tagging $67.00, volume dried up and X had a stair step decline for the balance of the session.
Three day consolidation breakout - After a sizable price rally, the stock consolidates the move in its upper range for three (or more) days, before breaking out again.
[url=][/url]
Posted by Jamie at 10/13/2006 07:51:00 PM 0 comments
Labels: NRB
Thursday, October 12, 2006NASDAQ Technical Picture - Earnings Season
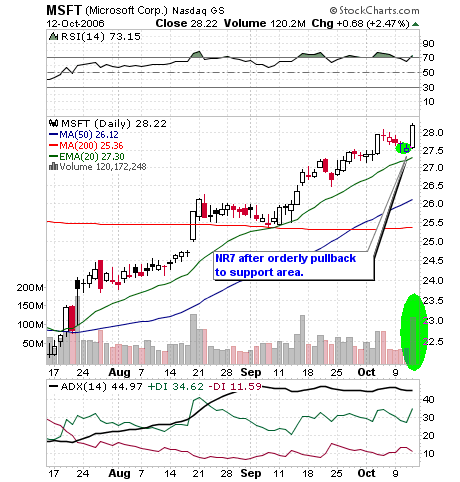
 Stocks rallied across the board as earnings improved and the Fed beige book provided more evidence that the economy is on track. All tech sectors participated in the rally. Software and MSFT (mega market cap.) had a big hand in today's big move. For a perfect NR7 setup, take a look at MSFT daily chart (below). Stocks rallied across the board as earnings improved and the Fed beige book provided more evidence that the economy is on track. All tech sectors participated in the rally. Software and MSFT (mega market cap.) had a big hand in today's big move. For a perfect NR7 setup, take a look at MSFT daily chart (below).
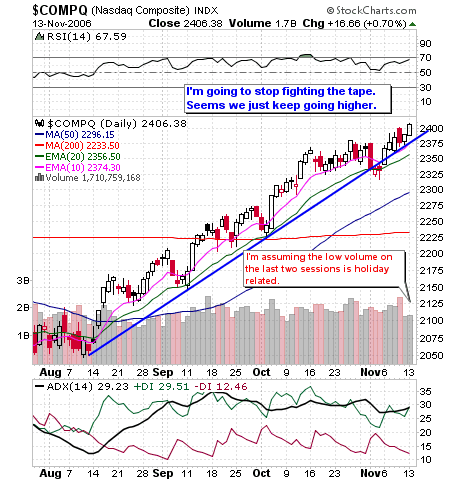
So last night's technical picture was off because of earnings. And next week earnings season really kicks in, making the writing of this post a bigger challenge. As indicated here earlier this week, the market is priced to perfection so we need big earnings to keep the bears at bay. For the moment it looks like we are heading higher since we closed at the top of the session. However, GE, another mega market cap, reports BTB and could set the tone for tomorrow's trade.
Tomorrow's economic calendar includes import/export and retail sales BTB, Michigan sentiment at 9:50, and Business inventories at 10:00. Oh, and tomorrow is also Friday the 13th!

[url=][/url]
Posted by Jamie at 10/12/2006 09:27:00 PM 2 comments
Labels: NASDAQ
Newer Posts Older Posts Home |
 [复制链接]


 楼主
楼主