- 金币:
-
- 奖励:
-
- 热心:
-
- 注册时间:
- 2006-7-3
|
|

楼主 |
发表于 2009-3-20 17:36
|
显示全部楼层
Sunday, August 26, 2007Base & Break - Biogen Idec Inc. (Public, NASDAQ:BIIB)
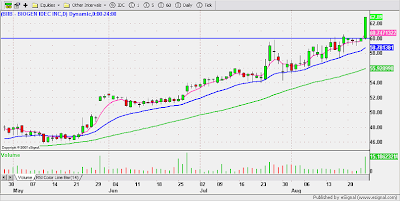 The first chart is the daily timeframe. We see that BIIB has been basing at the $60.00 level for a long time. Thursday's NRB (green) was the perfect setup leading into Friday's break. As mentioned in my pre-market post this was one to watch. If you watched too long though, it ran away, so decisive action was required in the early going. The first chart is the daily timeframe. We see that BIIB has been basing at the $60.00 level for a long time. Thursday's NRB (green) was the perfect setup leading into Friday's break. As mentioned in my pre-market post this was one to watch. If you watched too long though, it ran away, so decisive action was required in the early going.
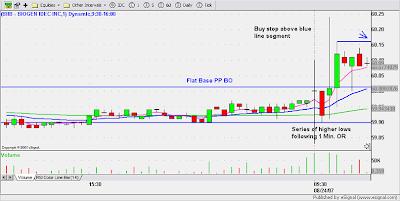
I used the 1 minute chart for my entry. After the OR, BIIB carved out a series of higher lows and I quickly picked a WR green bar as my base because the open was a bit choppy. I used a buy stop order and set my stop just below the lower blue line.
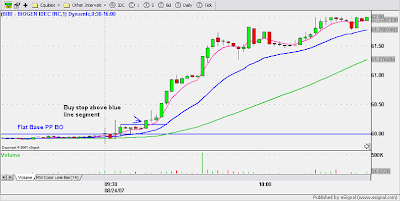
 The next chart is the expanded view of the 1 minute timeframe, which shows how quickly price took flight once the initial choppiness was out of the way. The next chart is the expanded view of the 1 minute timeframe, which shows how quickly price took flight once the initial choppiness was out of the way.
 The last chart is the 15 minute timeframe. After a vertical move and three WRBs, I took a partial and tightened my stop a few pennies below the third WRB. The last chart is the 15 minute timeframe. After a vertical move and three WRBs, I took a partial and tightened my stop a few pennies below the third WRB.
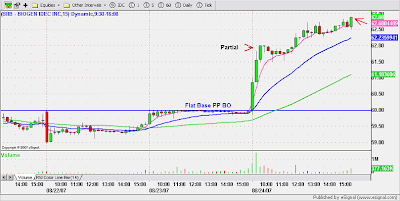
B&B patterns at pivot point resistance often result in vertical moves. In general, the longer the basing period, the better the BO. If you're not comfortable trading the open, you can try paper trading these at first or just entering with very small size until you develop a good feel for the pattern and the BO.
[url=] [/url] [/url]
Posted by Jamie at 8/26/2007 05:10:00 PM 8 comments 
Labels: Base and Break, Pivot Point
Saturday, August 25, 2007NASDAQ Technical Picture - Trendline Breach - Bullish Bias Intact


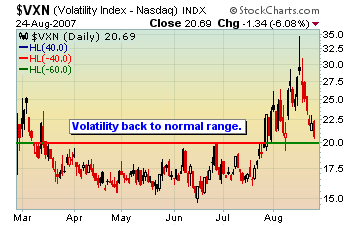
The fear factor as measured by the VXN is clearly well off of last Thursday's multi-year high and the bulls are temporarily back in control with a trendline breach. We are back in the overbought zone and month-end is just a heart beat away. A pullback in the early part of next week would help alleviate the extended short term technicals and allow a bit of room ahead of the end/start of the month positive bias. Don't want to get ahead of myself but the Fed move last Friday certainly has had a big impact in dissipating the fear factor. We've had very little in the way of pullbacks all week and the weekly chart looks like a bear trap.
Stock over $5 posting the largest percentage gain over the last five sessions include: BCSI +51, ACH +40%, WX +31%, TNH +29%, BTM +29%, BRP +29%, VMW +28%, TBSI +27%, RDYN +27%, HDNG +26%, IDP +26%, FWLT +26%, NEON +26%, ANTP +25%, SNCR +25%, NM +25%, CALM +25%, IVN +25%, FMT +24%, DRYS +24%, AXR +24%, VSEC +24%, LNDC +24%, BYI +24%, MEA +24%, GME +24%, AVCI +23%, ASIA +23%, VII +23%, LGCY +23%, MENT +21%, GTI +21%, TCHC +21%, DFC +21%, ANSV +21%, CKSW +20%
Stock over $5 posting the largest percentage loss over the last five sessions include: SNIC -25%, TWB -25% UNG -20%, GMTN -19%, FLML -19%, SBP -18%, ETEL -17%, CSUN -16%, PLCE -15%, GMET -14%, VC -14%, TDSC -14%, DEEP -14%, BIOF -14%, GSAT -14%, CCBL -13%, TMA -13%, TWP -13%, BECN -13%, TMTAD -13%, MNCP -12%, JRN -12%, SR -12%, LAD -12%, ZGEN -12%, OREX -12%, WNS -12%, OPLK -11%, JAV -11%, ICTG -11%, AAUK -11%, KNSY -11%
Companies reporting earnings the week of Aug 27th-31sth include: Monday: SNDA Tuesday: CMED, COCO, SAFM, TUES, ANEN, APSG, BGP, DY, MCRS, PEC, SMTC, LNUX, NCTY... Wednesday: BIG, BWS, CYBX, DLTR, ENER, FRED, JOYG, LAYN, WSM, CHS, CTRN, CWTR, FCEL, GEF, HEI, JAS, UEPS, NOVL, PSS, SIGM, and TIVO... Thursday: CIEN, CONN, DLM, FRE, GCO, HRB, KIRK, TIF, UNFI, VIP, ZLC, CPWM, CMOS, DLIA, DELL, ESL, LTXX, OVTI, OTEX, RSTO, SEAC, and WIND... Friday: No companies are scheduled to report.
Earlier this week NYSE released its August short interest data, which was collected on the 15th. The stocks with the largest short interest as a percentage of the float are as follows: AXR 103%; NFI 93%; BZH 73%; TOA 73%; HOV 63%; FED 60%; MWA 60%; IMB 60%; BHS 51%; TWP 51%; WCI 48%; DSL 48%; MTH 47%; HEI 45%; GDP 44%... The biggest increases in short-interest as a percentage of the float, from mid-July to mid-August, are as follows: NFI's short interest rose to 93% of the float from 67%; BZH is up to 73% from 57%; RAS up to 31% from 17%; ACA up to 21% from 10%; GDP up to 44% from 33%; RDN up to 18% from 8%; RWT up to 21% from 10%; AFN up to 26% from 16%; MTG up to 32% from 21%; FED up to 60% from 50%... The biggest decreases in short-interest from mid-July to mid- August are as follows: CDL's short interest dropped to 11% from 62%; XJT down to 15% from 33%; TSS down to 11% from 26%; TIE down to 9% form 21%; UA down to 26% from 38%; PPP down to 5% from 16%; TLB down to 38% from 47%; DJO down to 11% from 20%; AXR down to 103% from 112%; EYE down to 11% from 19%... This information is reported on a monthly basis. Not surprisingly, some of the biggest increases took place in stocks related to the mortgage/housing markets... NASDAQ short interest data for August does not appear to be compiled out yet.
Data courtesy of Briefing.com
[url=][/url]
Posted by Jamie at 8/25/2007 09:09:00 PM 4 comments
Labels: NASDAQ

Aislin - Montreal Gazette August 22, 2007
[url=][/url]
Posted by Jamie at 8/25/2007 08:25:00 PM 0 comments
Labels: Entertainment |
|
|
 [复制链接]


