搜索
楼主: hefeiddd

一个笨蛋的股指交易记录-------地狱级炒手

  [复制链接]
 楼主| 发表于 2009-3-20 16:55 | 显示全部楼层
Sunday, April 06, 2008NASDAQ Technical Picture - Resistance Overhead


The jobs data came in worse than expected on Friday (payrolls -80k, the worst since March 2003 vs. consensus -50k and unemployment of 5.1% vs. consensus of 5.0%) but the stock indices held up relatively well off the open with a mixed start and only limited morning pressure. The Fed made it clear prior to the release of the reports that they will be ready to act forcefully which helped to mitigate the early pressure.

Cont'd

Technically no damage was done on the retreat as the NASDAQ extended the sideways consolidation off Wednesday's high. A steady rally off the morning low into the afternoon resulted in a new weekly high, but that was it for the bulls on the day as late session/week profit taking, trimmed the gains. Major sector winners were led by Coal +5.5%, Steel +3.1%, and Clean Energy +3.1%.

I expect the market to take a breather coming into resistance, after the sizable gains off of the March lows. The 15 min. chart clearly shows negative divergence of both the RSI and MACD to higher prices. The McClellan oscillator is overbought and we need to consolidate/retrace before attempting to take out resistance, otherwise it will likely fail.

Stocks over $5 posting the largest percentage gain over the last five sessions include: IPCS +67%, PMII +51%, USU +42%, VRTX +40%, OWW +39%, GHM +38%, ITMN +37%, HA +35%, TLB +35%, ANST +34%, NXTM +32%, ESI +32%, XIN +31%, CECO +31%, SPF +30%, COCO +29%, DDS +29%, EXFO +28%, CIT +28%, NEWS +28%, JTX +27%, MEE +27%, IDIX +26%, TRR +26%, SFI +25%, HOV +25%, CTDC +25%, BZH +24%, MU +23%, SLM +23%, CLAY +23%, LDK +23%, CAO +23%, PGNX +23%, MRB +22%, CSUN +22%, MF +22%, IDRA +22%, BLUD +22%, DRAX +22%, ONNN +22%, MTH +22%, XING +22%, SNDK +22%, PIR +22%, SOLF +21%, TSL +21%, ADY +21%, CRD.B +21%, BX +21%, NT +21%, YGE +21%

Stocks over $5 posting the largest percentage loss over the last five sessions include
: VCGH -27%, OFIX -24%, FRP -22%, LOJN -18%, IUSA -18%, RVBD -18%, SGP -17%, DMAN -16%, SLRY -16%, FXP -15%, PAY -15%, CHRD -15%, FED -14%, XRIT -14%, SGP-B -13%, SKF -13%, TSFG -13%, SMN -13%, AZZ -13%, SRS -13%, RICK -12%

Companies reporting earnings the week of April 7th-11th include: Monday: AA... Tuesday: CHTT, LAYN, MSM, and ZZ... Wednesday: ACGY, CC, GBX, ISCA, MERX, PGR, SGR, APOG, and CBK... Thursday: FCSX, PIR, RAD, DNA, and INTV... Friday: FAST, GE, and PKX.

[url=][/url]
Posted by Jamie at 4/06/2008 08:36:00 PM 0 comments
Labels: NASDAQ


Trading Failed Patterns - Research In Motion Limited (USA) (Public, NASDAQ:RIMM)
RIMM from the WL, was setting up, what appeared to be a potential C&H pattern from an orderly rounded base. I took an early entry off of NR7 bar, which carved out a mini base on the 5 min. time frame below.

Everything was beautiful and just as the C&H pattern was set to go, it didn't. It printed a shooting star on the 5 minute time frame. I closed the long position and feeling a Friday afternoon sell-off about to get underway, I setup a short entry.

I had a wide stop, so size was small. Luckily, RIMM paused at the trend line and carved out a bearish flag on the 5 min., so I was able to add to my position. After the C&H pattern failed, price made a decisive and fast move lower. It paused at the trend line and printed several consecutive NRBs, as it attempted to bounce, it carved out a tweezer top, that signaled more selling to come. As I watched the bear flag develop, I placed a sell stop order two cents below the first green stick. And as each stick completed itself, I adjusted the price on the sell order, two cents below the last completed candlestick. As the flag sticks begin to look more bearish, you gain confidence in the setup. The target was the morning swing low and I covered as price approached the target.

Brian Shannon of Alpha Trends often reminds us on his video blog that failures can result in fast moves. If you're a long time viewer of his daily videos like I am, you know what I'm talking about. I'm trying to incorporate that idea into my trading. So if I see a perfectly formed bullish pattern fail, I'm going to try and profit from it on the short side.

[url=][/url]
Posted by Jamie at 4/06/2008 02:39:00 PM 2 comments
Labels: Bearish_Flag, Cup-and-Handle, Failed_Pattern, Tweezer_Top


Thursday, April 03, 2008Dummy Trade of the Day - Apple Inc. (Public, NASDAQ:AAPL)


I got a late start to my trading day so I concentrated on support/resistance moves. Notice the BO move AAPL made in late morning taking out resistance from yesterday after NRBs. The result was 3 WRBs up to R2. The next candle was bearish and that's when I decided to short.


My target was the blue line - former resistance should act as support. After a steep and wide retracement from support, AAPL carved out a lower high and set up another short below the red baseline.

Nice C&H pattern for APOL today. Hope Alex got in on that one (mentioned in the comments a couple of days ago). My alert went off while I was away.

Trader MD caught a C&H with WFR.

Anarco was in on another C&H pattern with CROX


[url=][/url]
Posted by Jamie at 4/03/2008 08:57:00 PM 2 comments
Labels: Support_Resistance


Wednesday, April 02, 2008Consolidation Day - Apple Inc. (Public NASDAQ: AAPL)
RIMM was the first trade of the day. I saw an IB on declining volume with no overlapping bodies in close proximity to the rising 5 period ema. The only caveat was R2 and the round number $120.00 just overhead. The real reason this trade failed was Fed speak - Bernanke telling congress that the U.S. would fall into recession later in the year. I had contemplated not trading during the congress economic session. Should listen to my inner voice next time.

HANS - An obvious setup - morning star reversal pattern at the base of the early swing low and yesterday's ORH.

The first AAPL chart is the 5 minute timeframe. There was early strength followed by an inverse C&H. The handle was choppy and I was still stinging from the RIMM loss, so I decided to pass on the setup. Too Bad.
About two hours later, I got a second chance in the form of a bear flag. Price quickly fell back to support at $146.00. Price has a memory and so do I, $146.00 is where I went long yesterday. I covered and went long. At first price started going against me ( oh, where's my stop? - decided to give it 30 cents), but quickly snapped back (whew). Took a partial after a 1 pt. gain.

The 15 min. chart shows a wider view of the base at $146.00.
AH both RIMM and AAPL are trading up on RIMM's earnings beat and guidance.


[url=][/url]
Posted by Jamie at 4/02/2008 07:01:00 PM 6 comments
Labels: Bearish_Flag, Inside Bars, Morning_Star, Support_Resistance
金币:
奖励:
热心:
注册时间:
2006-7-3

回复 使用道具 举报

 楼主| 发表于 2009-3-20 16:56 | 显示全部楼层
NASDAQ Technical Picture - Coiled Spring Leads to Expansion
Last night I said "The IB at the base of support could lead to expansion tomorrow. At the moment we look well positioned to bounce technically, but news and economic data will, no doubt factor in. "

The move of fresh institutional cash into the market at the start of the new month/quarter led to a steady uptrend following the Finance (LEH, UBS) related gap higher and strong economic data. So the retracement was a coiled spring and today's higher high on bigger volume was expansion.

I like the convergence of the MAs around price. This is the second break above the 50 MA which is now flatter than the last time. This break has a better chance of sticking.

[url=][/url]
Posted by Jamie at 4/02/2008 12:31:00 AM 0 comments
Labels: NASDAQ


Tuesday, April 01, 2008Bullish Momentum Day - Apple Inc. (Public, NASDAQ:AAPL)
I was bullish AAPL going into the session because while the markets were pulling back, AAPL was holding its gains and consolidating sideways (see daily chart above).

After gapping up above yesterday's range, AAPL retraced and chopped around before carving out a bullish morning star reversal pattern. I took a partial when it couldn't hold $148.00 allowing for a 38% Fib retracement which would bring price back in the area of R2. After retracing, it carved out a bullish green hammer and thrust back up, but couldn't break the morning swing high. I stuck with it because today was the first day of the month/QTR and lots of fresh institutional money was being put to work. I was not expecting another retrace, but now I was stuck. My only hope now was that the rising 20 ema would provide support.

AAPL retraced the full 38% this time and reversed with a tweezer bottom and wide bullish engulfing bar. That morning swing high was formidable resistance, but the bulls prevailed.


SNDK was picture perfect - 3 IBs on declining volume, the last of which was NR. How momo is that? Too bad, even price and volume contraction can't turn a loser stock in a weak sector into a super hero. SNDK just couldn't break the daily pivot at $25.00, so I eventually dumped it out of frustration.

HANS had a choppy base but I couldn't help myself. It carved out a low risk green bar which closed at the base of resistance, so I jumped in. It did not extend fully. When I realized it had printed a perfect gravestone doji, I said goodbye.


Only one short today. The shooting star is outside, followed by an inside bar. I used the high of the IB as my stop and the low of the OB as my entry. Exit on volume spike at base of support.

[url=][/url]
Posted by Jamie at 4/01/2008 08:37:00 PM 8 comments
Labels: Fibonacci_retracement, Gapper, Gravestone_Doji, Morning_Star, NRIB, Pivot Point


Monday, March 31, 2008

A generally positive session on the last day of the month/quarter but trade was choppy and confined - inside day. The IB at the base of support could lead to expansion tomorrow. At the moment we look well positioned to bounce technically, but news and economic data will, no doubt factor in.

After Hours Summary: LEH -3.0% (to offer 3 mln shares of convertible preferred stock; Moody's downgrades some Lehman XS Alt-A deals); IBM -1.4% (learns of temporary suspension from new business with U.S. Federal Government); DELL -1.2% (is undertaking a strategic assessment of ownership alternatives for its Dell Financial Services financing activities).

[url=][/url]
Posted by Jamie at 3/31/2008 10:59:00 PM 0 comments
Labels: NASDAQ


Dummy Retracement Trade - Garmin Ltd. (Public, NASDAQ:GRMN)
The first chart is the daily for GRMN. Key support at $55.00 was tested in early trade. We had a wide opening range and I was waiting for a tradable NRIB, but things were disorganized and choppy so I passed.

As we can see from the 15 min. time frame, GRMN eventually broke down and carved out a tweezer bottom reversal at S2 (red dotted line). This led to an orderly Fib. retracement of
38% from the ORH to the midday swing low, and a retest of the BO point.

Former support at $55.00 now acted as resistance and we had a perfect opportunity to get short with an orderly setup.

On the 5 minute time frame below, GRMN carved out a bearish evening star and I shorted on the next bar, using the doji high as my initial stop. I took a partial on the retest of S2 and covered the balance when price approached $53.00.

After taking out $53.00, price capitulated on a huge volume spike and GRMN printed yet another tweezer bottom, which set up another retracement, so I went long at $53.02 and stayed with it until $54.00.


The rest of my day was frustrating due to scratches and stop outs, but GRMN more than made up for it. Here's an example of one of my frustrating trades:


[url=][/url]
Posted by Jamie at 3/31/2008 08:34:00 PM 4 comments
Labels: Bearish_Flag, Fibonacci_retracement, Pivot Point, Support_Resistance, Tweezer_Bottom


Saturday, March 29, 2008Gapper Double Play - Apollo Group, Inc. (Public, NASDAQ:APOL)
The first two charts are 15 min. and the third chart is a 1 min. time frame and the last chart is the daily which highlights key support. APOL from the Briefing.com gapper list, opened with a huge earnings gap down. The key takeaways from the first 15 min. chart are that Fib. extensions are often not useful for very wide gaps. Also, the wider the gap, the longer the gap consolidation period, so don't try to get in too early, wait until the down sloping 5 period ema approaches price.

The 2nd 15 minute chart shows how I executed the trade. After breaching the ORL, APOL carved out a tweezer bottom which failed to reverse. Eventually price printed an orderly bear flag pattern comprised of NRIBs. All three bars observed the ORL as resistance on a closing basis. The third bar met the down sloping 5 period ema and closed weak (almost a gravestone doji). I placed a dummy sell stop order a few pennies below the trigger bar and it took a while before the actual execution because price was moving very slowly. The high of the trigger bar is the initial stop ( plus a few pennies).

From the daily chart I had established support at $40.00 followed by $37.50. I took a partial at $40.00 and covered a while later as it appeared to be forming a bullish doji morning star. I entered long just before the star pattern completed itself as depicted on the 1 min. chart below.

Notice the perfect double bottom pattern and also note how the 20 EMA acts as support on the 1 min. time frame.


Related Post: Morningstar Reversal Pattern

[url=][/url]
Posted by Jamie at 3/29/2008 09:07:00 AM 7 comments
Labels: Bearish_Flag, Gapper, Morning_Star


Friday, March 28, 2008NASDAQ Technical Picture - Profit Taking


Extended pullback following yesterday's modest corrective action, with the market closing on its lows. Catalysts included ORCL earnings and GOOG price target cut. Technology outperformed on the downside. Will the bulls be ready to defend this support level (15 min. chart)?

After Hours Summary: BSC -5.2% (Chairman James Cayne discloses sale of 5.6 mln shares at $10.84 on 3/25); APOL -19.0% on earnings/guidance.


[url=][/url]
Posted by Jamie at 3/28/2008 12:08:00 AM 0 comments
Labels: NASDAQ


Newer Posts Older Posts Home
金币:
奖励:
热心:
注册时间:
2006-7-3

回复 使用道具 举报

 楼主| 发表于 2009-3-20 16:57 | 显示全部楼层
Thursday, March 27, 2008Watch List Short - Hansen Natural Corporation (Public, NASDAQ:HANS)
We talked about shorting HANS on Monday. We said we wanted to short HANS on the next test of support at $37.00. HANS tested $37.00 three times before breaking down. The first chart is 1 min. The first test swoons from far away so we do nothing because price will consolidate and we want to hold out for a better setup. The second test holds our number and bounces. The third test carves out a NR which is perfect for a low risk entry. Cover when price fails to hold S2.
Price retraces 62% of the move from the ORH to the morning swing low. It fails to close above the 20 EMA and carves out an inverted hammer. Short as price takes out inverted hammer. Partial at the whole $ number on a huge volume spike which marks the end of the move for now. Still think that this one is going lower.


[url=][/url]
Posted by Jamie at 3/27/2008 11:33:00 PM 7 comments
Labels: Base and Break, Fibonacci_retracement, Scalp


Gapper - Huron Consulting Group (Public, NASDAQ:HURN)
Wide earnings gap from Briefing.com gapper list. The first chart is the daily and it highlights significant support at $40.00.


The second chart is 15 min. and we can see a perfect bear flag on declining volume which carves out a lower high.
I shorted the bear flag break using the 5 minute to narrow the size of the stop. I liked how the down sloping 20 EMA acted as resistance. Price reversed shortly after taking out the target so I covered the balance.


[url=][/url]
Posted by Jamie at 3/27/2008 11:09:00 PM 0 comments
Labels: Bearish_Flag, Gapper


Wednesday, March 26, 2008NASDAQ Technical Picture - Narrow Range Consolidation


A gap down on Wednesday following weak Durables data, cautious comments and estimate cuts in Financial, and a short term overextended technical posture in the wake of the recovery extension. So far the consolidation is narrow range and on lower volume, typical of a bullish consolidation. Financials led the way down and energy/commodities provided strength.

After Hours Summary: ORCL -8.5% on earnings/guidance; CCU +7.4% (Bain Capital and THL Partners sue banks to demand completion of CCU acquisition); RMBS +4.6% (confirms that the co wins coordinated trial against Memory Manufacturers; RMBS was awarded $133.6M in damages)

[url=][/url]
Posted by Jamie at 3/26/2008 10:32:00 PM 2 comments
Labels: NASDAQ


Gapper Dummy Trade of the Day - Alpha Natural Resources, Inc. (Public, NYSE:ANR)
ANR gapped up on the open and quickly rose to the top of my Watch List in terms of % gain. I missed the open, so by the time I got back, it was already printing some red. As it retraced, I saw an orderly pullback towards the rising 5 period EMA. By orderly I mean small, tight, red candles with no overlapping bodies on declining volume (retracement candles should be smaller than the trend candles otherwise it might be a reversal).

I was watching it on the lower time frames as well. On the 1 min. chart, I look for price to carve out a higher low to indicate that the retracement is over. Then I look for a base. The circles on the chart below mark areas where price pivots and changes direction. This is the base and as soon as I identify a higher low, I prepare to enter if it makes sense on the 15 minute time frame above. I use the previous bar low on the 15 min. as my initial stop.

As you can see everything gelled. Price retraced 50 % of the move from the ORL to the swing high on declining volume. The 5 period ema and price came together at that level.

Today was a down day for the market with most of the WL printing red ink so I wasn't looking for a home run, just a retest of the morning swing high. That target was achieved very quickly. I was hoping for a C&H pattern to develop later on, but that fell through around 2:00.


[url=][/url]
Posted by Jamie at 3/26/2008 07:40:00 PM 6 comments
Labels: Fibonacci_retracement, Gapper, Pivot Point
金币:
奖励:
热心:
注册时间:
2006-7-3

回复 使用道具 举报

 楼主| 发表于 2009-3-20 16:57 | 显示全部楼层
Tuesday, March 25, 2008Dummy Trade of the Day - Hansen Natural Corporation (Public, NASDAQ:HANS)
It was a very choppy session and I noticed several failures and mediocre extensions. My first trade was the best in that it reached 100% Fib extension of the ORL to the base. The first chart of HANS is the 15 min. and you can see 2 IBs, the second of which is NR7 in price only (volume does not contract). That looks like a mini triangle on the 15 min., but on the 5 min. below we see a shallow retracement from the base and nice , low risk setup where all of the MAs converge.


Originally, I thought GRMN would set up a bearish flag on the retest of S2 (red dotted line) as price moved towards the down sloping 5 period EMA. But instead it continued to rally off of its V bottom. Eventually, it paused at the base of the high of 2/15 and I traded it like a C&H pattern. It was very slow to get going, and then after all that, it didn't extend the full 100%.

Related Posts: NRIBs Revisited
Inside Bars

[url=][/url]
Posted by Jamie at 3/25/2008 04:39:00 PM 13 comments
Labels: 2_Inside, Cup-and-Handle, Fibonacci, NR7


Monday, March 24, 2008Chart Watch - CELG, HANS
A full extension on the CELG C&H pattern would take out all time highs.

HANS was 2nd last on the NASDAQ 100 today. Feels like the next test of support will fail.

[url=][/url]
Posted by Jamie at 3/24/2008 08:38:00 PM 4 comments
Labels: Cup-and-Handle, Support_Resistance, Watchlist


NASDAQ Technical Picture - Bulls Own It

Yesterday, I mentioned that we were just 60 points away from recapturing the 50 DMA, which is a must for a market reversal. Today we recaptured the 50 on a closing basis. Now let's see if we can hang on to it!

The NASDAQ outperformed the DOW and S&P 2:1 with leadership provided by Internet, disk drive and hardware. Lots of stocks that had previously broken lower support, came back strong today - BIDU, NTAP, and SNDK to name a few.

One day does not a trend make, but it was a welcome relief after all those offset bars last week.


[url=][/url]
Posted by Jamie at 3/24/2008 08:08:00 PM 0 comments
Labels: NASDAQ


Dummy Trade of the Day - Apple Inc. (Public, NASDAQ:AAPL)
AAPL gapped up on the open and carved out a bullish green bar. The 2nd bar was almost inside (breach by a few cents). I entered long on a break of the whole $ number $135.00. I used the 5 min. timeframe below to set my stop (red line segment plus a few cents). I booked a partial profit after 3 WRBs on the 15 min.. This lined up nicely with the 62% Fib. extension of the previous day low to the ORH. I tightened the stop below the last WRB and exited the balance as price approached the next round $ number $140.00.

As you can see from the daily timeframe below, AAPL has carved out a bullish rounded base at the gap level. The next step will be a gap fill, but I'd like to see price consolidate before that happens, either with a couple of inside bars or a C&H pattern. But since this is AAPL, I won't be surprised if it just goes straight up.


[url=][/url]
Posted by Jamie at 3/24/2008 04:28:00 PM 6 comments
Labels: 3_WRBs, Fibonacci, Gapper, Inside Bars


Sunday, March 23, 2008NASDAQ Technical Picture - Week Ends on Bullish Note


A strong finish to the week, after a near fatal start. I'm feeling cautiously bullish.


[url=][/url]
Posted by Jamie at 3/23/2008 07:45:00 PM 0 comments
Labels: NASDAQ


Friday, March 21, 2008Dummy Trade of the Day - Visa Inc. (Public, NYSE:V)
As noted in Wednesday's pre-market post, Visa's IPO was the largest ever, and based on MA's success since its IPO, this stock was worth watching. Yesterday's open was promising and I set an alert just below the base at $60.00. Price quickly rallied into the base and I waited to see if it would consolidate in a narrow range for easy entry. That's exactly what happened and the setup was picture perfect as you can see on both the 5 and 15 min. timeframes. Don't buy after price rallies a great distance to reach the base. Price invariably will consolidate the at the base, either before or after the BO. Give it time to set up a low risk entry, otherwise if you jump in too soon, you'll get stopped out or start doubting yourself.

I placed Fib. extension from the previous day's late day swing low to the base. My target was 100% extension, at which point a booked a partial profit. This level, as it turned out, also equated to our signature BO target of 3 WRBs.

The 4th bar was WR as well and then suddenly it retraced quickly and I was stopped out on the balance. After the sharp retracement, V started printing lower highs and higher lows and eventually carved out another tradable base.


As you can see from the 1 minute timeframe below, $65.00 proved to be formidable resistance and price retraced sharply after the third attempt failed. That marks the pivot point. I'm adding V to my WL and I suspect that $65.00 will be taken out soon.

The key takeaway from the 1 minute chart, is that a strong stock will pull back to the 20 EMA and bounce, and then it will often find support at 50 SMA and bounce. But when both of those fail to hold, it's a fast move lower. If you want to get back in after that, wait for a higher low, or a base to form.


[url=][/url]
Posted by Jamie at 3/21/2008 11:45:00 AM 11 comments


Newer Posts Older Posts Home
金币:
奖励:
热心:
注册时间:
2006-7-3

回复 使用道具 举报

 楼主| 发表于 2009-3-20 16:58 | 显示全部楼层
Wednesday, March 19, 2008NASDAQ Technical Picture - Profit Taking


We've retraced all of the post FED gains and almost 62% of the surge off of Monday's lows. Oil, gold and commodities in general led the way down. Tomorrow is options expiration which may account for some of the volatility. It's up to the bulls to defend either of these green support lines.


[url=][/url]
Posted by Jamie at 3/19/2008 10:25:00 PM 2 comments
Labels: NASDAQ


TSX Down 415 Pts. (Ouch) - Gold /Oil Drubbing - Short ABX/CNQ
Late entries on these commodity plays, but better late with some sort of trigger, than miss the whole thing.

ABX - I waited until price closed below S2 (red line). Took a partial as price approached whole $ number. I kept a safe stop above the inside bar following my partial. Eventually, I tightened it above the WR green bar.

I missed the best part of this trade because of that sloppy consolidation following the initial decisive move lower. Then it consolidated midway setting a low risk entry point but I wasn't there at the right time. Jeez, finally I took a chance in the afternoon on a lame setup following an inside red bar.

ESRX, as I mentioned yesterday, is good for C&H patterns. This is an inverted C&H coming off a top. As the handle formed I saw two IBs, the second of which was a hanging man, so I entered early. It didn't move fast and vertical like a regular C&H, but by the EOD, it got the job done. The target was 100% Fib extension from the high of the cup to the base. Move stop after each significant trending stick in the direction of the trade, in this case WR red bars)

[url=][/url]
Posted by Jamie at 3/19/2008 04:31:00 PM 10 comments
Labels: Cup-and-Handle, Fibonacci


Tuesday, March 18, 2008Cup & Handle - Express Scripts, Inc. (Public, NASDAQ:ESRX)

ESRX from the WL is good for C&H patterns lately. This is not a perfect C&H because the handle forms above the base of the rim and the volume pattern is not great, but the IB followed by the NRB was too good to pass up.

I took a partial when the third BO bar closed just under the 100% Fib extension from the low of the cup to the base of the handle. I closed the balance as price tagged the blue resistance line.


ESRX did not lose its composure after the Fed rate cut. It was orderly and seemed to be setting up for another move so I stuck with it.

[url=][/url]
Posted by Jamie at 3/18/2008 04:51:00 PM 14 comments
Labels: Cup-and-Handle, Fibonacci, Volume, Watchlist


Monday, March 17, 2008Dummy Trade of the Day - Akamai Technologies, Inc. (Public, NASDAQ:AKAM)
Both of these gappers are from my watch list. I was looking for easy setups given today's news. AKAM gave me a trader friendly base and break in the direction of the trend following Friday's bearish engulfing daily stick. R2 and the 38% Fib. extension of the previous day high to the ORL were in sync for this setup. After consolidating at support (R2), it carved out a bullish base and an inside bar, triggering a long for a full retracement back up to my initial entry level.


ACI was a little more subtle. Initially, it carved out a tweezer bottom at the ORL. The reversal lost momentum and couldn't close above the down sloping 5 period ema. I waited until price traded below the 62% Fib retracement of the ORL to the mid-morning swing high in order to ensure this was not going to form a C&H pattern long. I placed my stop just above the 50% retracement level to give it some room. Partial at R2 and cover balance when price starts to bounce above the round $ number $40.00. Eventually it printed a tweezer bottom reversal with a perfect green hammer, so I entered long.

Price does not fully extend to the 38% Fib. ext. level here because of significant daily support at $40.00.


[url=][/url]
Posted by Jamie at 3/17/2008 08:39:00 PM 13 comments
Labels: Base and Break, Fibonacci, Gapper, NRIB


Thursday, March 13, 2008Cup & Handle - Arch Coal, Inc. (Public, NYSE:ACI)


ACI formed a high quality C&H pattern. On the 15 min. timeframe we see and orderly pattern with 2 IBs on declining volume. On the 5 min. we get a better view of the price and volume contraction as the handle forms.

The base of the handle sets up at P and the whole $ number. The target is a measured move or 100% Fib. extension from the low of the cup to the base. The extension is perfect with lots of volume supporting the move, so I decide to partial out at the target and hold the balance for a bigger move. I tighten my stop below the last WRB on the 5 min. timeframe and exit the balance as price approaches R1.


[url=][/url]
Posted by Jamie at 3/13/2008 09:43:00 PM 8 comments
Labels: 2_Inside, Cup-and-Handle, Fibonacci
金币:
奖励:
热心:
注册时间:
2006-7-3

回复 使用道具 举报

 楼主| 发表于 2009-3-20 16:59 | 显示全部楼层
Wednesday, March 12, 2008NASDAQ Technical Picture - Profit Taking after the Surge

Following a morning rally, normal profit taking after the huge surge came into play in the afternoon. We saw a 38% Fib. retracement from Monday's low to the midday high and a weak close. Support at the 50% retracement level.


[url=][/url]
Posted by Jamie at 3/12/2008 10:49:00 PM 0 comments
Labels: Fibonacci_retracement, NASDAQ


Trade of the Day - priceline.com Incorporated (Public, NASDAQ:PCLN)
I added PCLN to my watch list after YR mentioned it in the comments in mid February re: its earnings gap. Today it carved out a NRIB - NR7 at the base of R1 and setup a perfect momo move. I took a partial after it approached and retreated from $122.00. I moved my stop under the spinning top once the candle was concluded and was stopped out. I was expecting a deeper retracement, but a while later it took out the HOD and set up another quick scalp.

The 5 minute chart of the initial trade below.


AKNS was a solar gapper from the Briefing.com list. I set a buy stop above the ORH after the second bar printed inside. I was expecting the third bar to be an IB as well, but just seconds before it closed it broke out. I usually use the previous bar low as my stop, but in this case I used the BO bar. The target was the 38% Fib. extension of the previous day low to the ORH. This level lined up with resistance on the daily.

[url=][/url]
Posted by Jamie at 3/12/2008 09:44:00 PM 16 comments
Labels: Fibonacci, Gapper, NR7, NRIB


Tuesday, March 11, 2008NASDAQ Technical Picture - FED to the Rescue


The Fed's (surprise - (GS did mention yesterday that Fed could act before next meeting)) announcement triggered a strong reaction in pre-market trade and a gap higher open. Three plus hours of backing and filling began shortly after the open but the 62% Fib. retracement of the run off of yesterday's low to the opening range high (ORH) held in early afternoon trade with the market putting together an aggressive extension into the close.

Leading US markets higher were Bank +10.1%, Housing XHB +7.9%, Broker +7.3%, REIT +7%, Chemical +5.8%, Coal +5.3%, Oil Service HOLDRs +5.2%, Clean Energy PBW +5.1%, Commodity (DBA +4.4%, DBC +1.5%), Casino +4.5%, Gold/Silver +4.5%, Insurance +4.2%, Oil +4.1%, Paper +4.1%. The aggressive reversal was accompanied by above average volume and a strong up/down volume ratio (NYSE 9-1, Nasdaq 7.75-1) which suggests that a short term bottom is in play with the indices for now, at least, back in the Jan/Feb range trade mode.

[url=][/url]
Posted by Jamie at 3/11/2008 09:59:00 PM 0 comments
Labels: NASDAQ


Cup & Handle - Express Scripts, Inc. (Public, NASDAQ:ESRX)
Cautious trading following the huge opening gap due to the Fed intervention. JOYG, a WL stock, set up a typical sideways gap consolidation until price and the rising 5 period ema come together. I used a buy stop order and almost missed the exit at R2.


ESRX was setting up as a C&H pattern. I spotted 3 NRIBs and decided to get in early. I took a partial at the 100% Fib. extension from the low of the cup to the base. I didn't see any resistance until S1 so decided to hold half my position. That target was well exceeded on the momentum rally into the close.


I saw many C&H patterns in the afternoon. JASO was quick to achieve the measured move target. This one is a 5 min. chart.
Also managed to catch a sweet move in my beloved RIMM this afternoon!


[url=][/url]
Posted by Jamie at 3/11/2008 08:22:00 PM 16 comments
Labels: Cup-and-Handle, Fibonacci, Gapper, NR7, NRIB


Monday, March 10, 2008NASDAQ Technical Picture - Bears Own It
The measured move from the break of the symmetrical triangle is about half way done.

Every bounce is a shorting opp.

We're oversold but I'm not holding my breath for a tradable bounce just yet.

Put buying testing January highs.


[url=][/url]
Posted by Jamie at 3/10/2008 08:03:00 PM 2 comments
Labels: NASDAQ


Newer Posts Older Posts Home
金币:
奖励:
热心:
注册时间:
2006-7-3

回复 使用道具 举报

 楼主| 发表于 2009-3-20 17:00 | 显示全部楼层
Monday, March 10, 2008Bear Flag Breakout - First Solar, Inc. (Public, NASDAQ:FSLR)
FSLR, from the watch list, attempted to rally but couldn't recapture the down sloping 20 ema and eventually carved out a bearish flag following a doji falling star and a second star with upper shadow. I shorted as price took out 7/15. The BO bar (8/15) closed near its lows which is a key success factor. The next bar also closed on its low and I was planning to take a partial at S2, but got stuck in a consolidation. I moved my stop above the previous bar high and waited it out.

When price finally hit S2, I decided to hold. I trailed a stop above each completed bar and took a partial as price approached the round number $180.00. I was stopped out on the next bar textbook style.

Had I not been so anxious to book my profit on the second half, I could have left my stop above the last WR red bar and profited from the late day swoon.

With all the excitement of the FSLR trade, I forgot about HANS. I set a sell stop order on HANS well ahead of the actual inverse C&H break. I don't normally like to take an entry on a WRB. But once it triggered I just managed the stop and eventually, it got the job done.

Unlike the HANS trade, I was in control on this JOYG inverse C&H entry. I liked how orderly the inverse C&H pattern looked and had high expectations to reach the target following the BO bar. I took a partial after price recaptured S2 on the first test. After the test of S2 things seem to get disorderly. Eventually, it retested the swing low but just wouldn't fall down.


[url=][/url]
Posted by Jamie at 3/10/2008 04:21:00 PM 2 comments
Labels: Bearish_Flag, Cup-and-Handle


Sunday, March 09, 2008NASDAQ Technical Picture - Test of January Low


The NASDAQ was the only one of the three major averages that breached the January lows intraday on Friday. Yet despite that, it performed better overall than the DOW(-1.22%) and SPX (-0.84%). Weakness in those two indexes was propelled by Materials XLB -4.2%, Chemical -4.1%, Coal -4%, Steel -2.8%, Airline -2.8%, Gold/Silver -2.5%, Oil Service -2.2%, Clean Energy -2.2%...

From the 15 min. chart we see that the weak jobs data precipitated a gap down, followed by a fade, then a reversal, and finally an uptick late in the session. The McClellan oscillator shows that we are approaching oversold levels. The daily chart shows that we are testing support on higher volume. Fear, of course can drive those levels considerably lower, so we won't be surprised by anything going into a new trading week. As noted last week, the symmetrical triangle is usually a continuation pattern, and, so far it is executing according to theory.

Companies reporting earnings the week of March 10th-14th include: Monday: AMC, BX, XJT, GOK, HITK, HYGS, IGTE, LCUT, LMIA, SIX, SEH, MTN, CSR, DWRI, FL, HOV, IPAR, JSDA, FACE, RSCR, SAFT, and SYKE... Tuesday: CAS, BONT, DKS, ESLT, GIGM, GSOL, GPX, KR, PLUG, RCNI, SGK, SSI, STEI, SWSI, BKE, WMAR, BLTI, PSS, DMND, DIVX, EXLS, ICFI, JCG, MBLX, OPMR, SVNT, and TTWO... Wednesday: AEO, CTIC, CGPI, FSIN, JASO, JMP, PMI, SBSA, TRK, TTES, TLB, TLCV, VSE, VIP, AFCE, AIRM, CHCI, GDP, GYMB, HOTT, JAS, JUPM, MED, MW, VITA, PRSC, SIGM, STAN, and VM... Thursday: AMT, BNT, EPEX, GCO, HDIX, TMR, MEI, NGPC, SURW, TICC, TRGL, ARO, ABTL, CHDN, COGO, HILL, HIBB, IFON, INTX, KNTA, NTN, PSUN, POWR, SEAC, SRSL, ZIPR, and ZUMZ... Friday: ANN, GEL, NVAX, LIZ, and STRL.

Stocks over $5 posting the largest percentage loss over the last five sessions include: JTX -39.7%, ANGO -39.7%, TA -39.6%, SOA -39.5%, ANH -37.8%, FRZ -36.6%, TSRA -36.3%, ABK -34.7%, OMRI -34.3%, OMPI -34.2%, AMSWA -34.2%, NOBL -33.0%, THRX -32.0%, PDLI -31.6%, GCO -30.8%, PSPT -29.0%, NCS -28.5%, CMO -28.0%, WM -27.7%, NLY -27.7%, ANH-B -26.9%, REM -26.5%, RAS -26.1%, LCAPA -11.7%.

Stocks over $5 posting the largest percentage gain over the last five sessions include: DBD +55.6%, COINW +34.6%, COINZ +27.7%, SMSI +27.3%, FLOW +25.1%, BIG +24.4%, BZP +19.7%, GEOI +19.6%, COIN +18.9%, PBT +16.3%, LVB +15.2%, PDC +15.0%, CRMT +13.6%, PSYS +13.5%, LF +13.2%, HMY +12.9%, GFI +12.8%, ACIW +12.7%, OME +12.4%, JRCC +12.3%, OMEX +12.1%, AXL +12.0%, MFB +12.0%, FXP +12.0%.

Scans courtesy of Briefing.com

[url=][/url]
Posted by Jamie at 3/09/2008 10:00:00 PM 0 comments
Labels: NASDAQ


Inverted Cup & Handle - Express Scripts, Inc. (Public, NASDAQ: ESRX)
ESRX from the watch list, formed an inverted C&H pattern around 1:00 EST. The pattern became interesting during lunch when ESRX carved out 2 NRIBs on declining volume. This was during the handle formation which eventually formed a shallow, inverted, rounded base. The key success factor in the C&H pattern is price and volume contraction during the handle formation. Also note that the 2nd IB is NR7.

Sell stop on a break of the C&H base. Partial at 100% Fib. extension from the high of the cup to the base. Friday was a race to the bottom so I decided to hold some to see if I could get more than the typical measured move for this pattern. ESRX extended to 138% before staging a 62% retracement of the last leg down.

[url=][/url]
Posted by Jamie at 3/09/2008 04:05:00 PM 4 comments
Labels: 2_Inside, Cup-and-Handle, NR7, NRIB


Thursday, March 06, 2008Dummy Trade of the Day - Celgene Corporation (Public, NASDAQ:CELG)
The first chart is a wide range 15 min. view of CELG. I map out all of the key S/R lines ahead of time. When I see a nice setup in close proximity to the S/R lines, I can easily execute the trade.

After a strong opening range, price weakened and made a decisive move into the next support level. It consolidated this move sideways. My first entry was a short as price crossed support. It started out very nicely, but then I got fooled by two hammer reversal bars. It turned out to be just a retest of the former support which now acted as resistance. This lead to a bearish flag pattern allowing me to get back in. I booked some profit at the next support level and exited the balance at the lower level.


CROX was a low volatility BO from the depths of the gutter after a multi day swoon. I really liked the price and volume contraction which formed shortly after the tweezer bottom reversal bars. I did not trust longs today, so I exited as soon as price tagged the 32% Fib. retracement of the last leg down. I'm keeping CROX on the focus list for tomorrow because it's long due for a correction.

Today was really choppy with wild swings up and down. Needless to say, I had more than my usual share of stop outs. I'm managing this by reducing my usual risk in half.

[url=][/url]
Posted by Jamie at 3/06/2008 09:28:00 PM 5 comments
Labels: Bearish_Flag, Low_volatility_BO, Support_Resistance, Tweezer_Bottom


Wednesday, March 05, 2008Dummy Trade of the Day - TBS International Limited (Public, NASDAQ:TBSI)
TBSI gapped up on the open and held the previous day high on a closing basis. The 2nd bar was a NRIB and the setup looked great on the 5 min. time frame below. Partial after 3 WRBs. Exit balance after lower high.


ICE was a gem from the High Chart Patterns newsletter last night. This is a 1 minute chart and I entered when price took out R2.

HANS was a failed C&H pattern. I had an idea this would fail because of the lunch hour and it was too slow. Thanks to Anarco who sent me a screen shot of what he was looking at today. CSIQ was gravy late in the session with this C&H pattern.


[url=][/url]
Posted by Jamie at 3/05/2008 08:18:00 PM 9 comments
Labels: Cup-and-Handle, Gapper, NRIB
金币:
奖励:
热心:
注册时间:
2006-7-3

回复 使用道具 举报

 楼主| 发表于 2009-3-20 17:01 | 显示全部楼层
Tuesday, March 04, 2008Dummy Trade of the Day - Research In Motion Limited (USA) (NASDAQ: RIMM)
RIMM Trilogy


The first chart is the daily. As I mentioned yesterday, after testing the lower pivot point, I expected RIMM to bounce.

Well, nothing comes easy in this market, so it took three trades to get this thing off the ground, but at the EOD we have a tweezer bottom reversal plus a bullish engulfing on the daily, so we are well positioned to retest the upper PP in the near-term. The only disappointment on the daily is the volume. It really felt like a lot more volume, especially in the last hour.

The first trade came shortly after RIMM retested yesterday's low and held. The TI scanner flagged 4/15 as NR7 and it was an IB, so I took a long on break of the previous IB. I set my stop on the 5 min. timeframe. Price retested the ORH and retraced sharply, so I exited the trade.

The second trade was a C&H pattern on the 5 minute timeframe. My target was the usual 100% Fib. extension from the low of the cup to the base of the handle. It failed to extend fully because of Fed speak.

At some point, IB crashed and I had to use the IB Web Trader. I really felt strongly that we would bounce before the end of the session, however, the choppiness intraday and broker problems were more than a little frustrating. Finally, RIMM carved out a tweezer bottom which set up the third trade.

My initial target was yesterday's ORH, but I took a partial after three successive WRBs and moved my stop up to the midday swing high, after which I moved it below the shooting star. Sweet!

[url=][/url]
Posted by Jamie at 3/04/2008 08:34:00 PM 5 comments
Labels: 2_Inside, Cup-and-Handle, Fibonacci, NR7, NRIB, Tweezer_Bottom, Volume


Monday, March 03, 2008NASDAQ Technical Picture - Test of February Low
Another 52 week closing low for the NASDAQ, but technically we managed to test and close above the Feb. low with a hammer-like reversal stick. After a three day slide, and taking into account late day strength, we are due for some corrective action. The strength, or lack thereof, of the next bounce will provide some clues as to the likelihood of a retest of the January lows.

Today's movement came from lower than avg volume ( 2183, vs. 2309 avg), with decliners outpacing advancers (1098/1903) with new lows outpacing new highs (41/290).

[url=][/url]
Posted by Jamie at 3/03/2008 09:40:00 PM 0 comments
Labels: NASDAQ


Dummy Trade of the Day - Hansen Natural Corporation (Public, NASDAQ:HANS)
HANS tried to bounce following a weak open but couldn't close above the down sloping 20 period ema. After a full retracement back to the ORL, it consolidated sideways and eventually set up a low risk dummy short following 3 inside bars. On a choppy day like today you don't want to take anything for granted, so partial out at obvious S/R levels.

My target was S1 and I covered the balance as price approached that level. The markets finally bounced in the last hour and HANS was good for another 45 cents.

TBSI was a failed C&H pattern that just couldn't close above $35.50.

The daily chart for RIMM is very orderly and easy to read. The two blue lines are S/R pivot points. The red line is the broken trendline. After gapping up above the trendline, RIMM closed the gap from early January, carved out a tweezer reversal, and retraced to retest the trendline.
After three consecutive down days, I was waiting for price to bounce on the tag of the lower pivot point. That's exactly what happened late in today's session. as depicted on the 5 min. chart below.
Now, I'm expecting RIMM to move higher, notwithstanding any unfavorable news or analyst downgrades.


[url=][/url]
Posted by Jamie at 3/03/2008 06:49:00 PM 15 comments
Labels: Cup-and-Handle, Dummy, Inside Bars, Pivot Point, Support_Resistance, Trendline


Sunday, March 02, 2008NASDAQ Technical Picture - Lowest Close Since Oct. 2006

Friday's close was the lowest since October 2006. The NASDAQ has been carving a symmetrical triangle for 5 weeks. Symmetrical triangles are generally continuation patterns, so Friday's action was no surprise, and probably a welcome relief after all the narrow range trade as price moved closer to the apex. Prices gapped some 20 points lower and continued lower on higher volume in afternoon to end the session off by 60 pts. or 2.6%. All major sectors participated in the drubbing.The Feb. low is less than 20 pts. away, followed by a retest of the January lows.

The TRIN, a measure of selling pressure, closed at 2.54. According to Briefing.com a close above 2.00 suggests potential for a rebound the following session (17 out of the last 20 ended higher). But this does not preclude a downside extension.

Broad market volatility moved higher this past week with the VIX up 9.5% from last Friday's close now at 26.34, and the tech-focused VXN (Nasdaq Volatility Index) higher by 7.6% on the week at 28.31. The "fear gauges" declined early in the week as the stock market rallied, but they are moving sharply higher Friday as equities came under heavy pressure, trading at their lows for the week (SPX -1.6% on the week, Dow -1.0% and Nasdaq -1.2%). The CBOE put/call ratio, closed at 1.27, indicating higher put trading than call trading.

Stocks over $5 posting the largest percentage gain over the last five sessions include: TTWO +50%, OME +48%, MNTA +36%, COINZ +32%, GYI +31%, BRKR +30%, HURC +29%, CGPI +29%, COINW +28%, GTLS +27%, CISG +27%, JRJC +26%, VIT +26%, OVTI +26%, GTXI +26%, SHZ +25%, OCNW +24%, MTEX +24%, CHNR +23%, PAR +23%, SYNP +23%, NZ +22%, ASGN +22%, ANV +22%, ERES +21%, SONE +20%, PRGX +19%, CRME +19%, LEAP +19%, TESO +19%, OHB +19%, HSII +18%, EOG +18%, SAPE +18%, KGN +18%, MEMS +18%, ASTE +18%, AMSC +17%, DNN +17%, OMCL +17%, MINI +17%, KONG +17%, IHP +16%

Stocks over $5 posting the largest percentage loss over the last five sessions: RHD -59%, FMT- -50%, ENOC -44%, BZ -39%, TSRA -39%, MF -38%, ABH -36%, DUCK -31%, CRDN -30%, USU -28%, PDGI -28%, CRI -27%, SEED -26%, PBKS -24%, COMV -24%, BGFV -22%, HWAY -22%, WPCS -21%, IMA -21%, CAVM -21%, PMII -21%, SMSI -20%, NT -20%, DY -20%, LHCG -20%, BKR -19%, DIVX -19%, ADSK -19%, ODP -19%, IRIS -19%, S -18%, GFG -18%, URS -17%, CLWR -17%, TYM -17%, DAL -17%, CMED -17%, NWA -16%, TMA -15%

Companies reporting earnings the week of March 3rd -7th include: Monday: FVE, GEHL, HBC, JOBS, ABM, BEXP, CMOS, LF, MWY, SUPG, and OVEN... Tuesday: CLWR, JRCC, PRFT, PMI, SPLS, TSL, RMIX, WRES, CHS, DIET, GOLF, HLYS, IDSY, and SMTC... Wednesday: BJ, BWS, CSIQ, COST, FTEK, SKS, TRMP, FCEL, MATK, HRB, PETM, TIVO, UDRL, and CHIP... Thursday: BBI, FLE, JOYG, KFY, OMRI, RIO, DEPO, BOOM, HRAY, MRVL, PSPT, and WIND... Friday: CIEN, EBS, and HEES

[url=][/url]
Posted by Jamie at 3/02/2008 09:17:00 PM 2 comments
Labels: NASDAQ, Retest, Symmetrical_Triangle


Thursday, February 28, 2008Dummy Gapper Trade of the Day - Canadian Natural Resource Ltd (USA) (Public, NYSE:CNQ)
CNQ gapped up and held the daily pivot high from the last two sessions on a closing basis as it consolidated the gap sideways. It printed a series of higher lows. The fifth bar was NR7 and finally, it carved out a perfect green hammer which closed at the base of all those inside bars. I entered long and it started out perfectly then consolidated sideways again like a stair step pattern, before the next leg up. I took a partial at the 50% Fib. extension of the previous day low to the ORH. It extended 100% before retracing - Sweet!


I had high hopes for AAPL going into the session, but was not inspired by the early price action. I took a second look after Anarco mentioned it. Long on break of $130.00. Partial after 3 consecutive full green sticks. Stopped out on balance at $31.50.


ACOR and SIGM - two focus list names mentioned in the comments last night. ACOR was a H&S top on the daily. SIGM was a trendline breach followed by NRIB. I exited as price approached my target of $29.75 which is a long-term pivot point on the daily.

A really good day!


[url=][/url]
Posted by Jamie at 2/28/2008 07:05:00 PM 14 comments
Labels: Dummy, Fibonacci, Gapper, Hammer, NRIB


Newer Posts Older Posts Home
金币:
奖励:
热心:
注册时间:
2006-7-3

回复 使用道具 举报

 楼主| 发表于 2009-3-20 17:01 | 显示全部楼层
Wednesday, February 27, 2008Trade of the Day - Arch Coal, Inc. (Public, NYSE:ACI)
Talked about this ACI setup in the comments last night. Yesterday's failed B&B BO could result in a breakdown.

Here's my trade on the 5 min.

I was watching ESRX for a C&H pattern yesterday afternoon but it didn't pan out. This morning my alert went off. But I didn't react quickly enough.
Just managed a scalp.

My gapper trade started off nicely. Thought it might form a C&H when it stalled, but it retraced too deeply.


Interesting little video on GOOG


[url=][/url]
Posted by Jamie at 2/27/2008 08:34:00 PM 5 comments
Labels: Cup-and-Handle, Gapper, Scalp


Tuesday, February 26, 2008Dummy Base & Break - Hansen Natural Corporation (Public, NASDAQ:HANS)
HANS was a B&B at the intra day I took a partial as price consolidated above R1 and exited balance as price approached R2.


The 5 min. time frame below shows a low risk short following shooting star on 15 min. I love making the same money twice.


DO was an HCPG pick from last night's newsletter. I missed the actual breakout, but managed to get in on part of the move as price consolidated. Intra day pivots had been cleared by the time I entered.

TEX consolidation above R1 leading to a sprint to R2.
GRMN was a failed C&H pattern. I'm sure this one would have worked if not for Fed Speak by Mr. Poole. Every time he opens his mouth it's time to get out of the market.


[url=][/url]
Posted by Jamie at 2/26/2008 07:36:00 PM 6 comments
Labels: Cup-and-Handle, Inside Bars, Pivot Point


Dummy Gapper Trade of the Day - Foster Wheeler Ltd. (Public, NASDAQ:FWLT)
If you miss the big move, sometimes you get lucky with a NR consolidation and a nudge from the 5 period ema. Exit after 3 WRBs.


MarketClub Education Page Click Here


[url=][/url]
Posted by Jamie at 2/26/2008 07:28:00 PM 4 comments
Labels: 3_WRBs, Dummy, Gapper


Monday, February 25, 2008Cup & Handle - Alpha Natural Resources, Inc. (Public, NYSE:ANR)
ANR gapped down on the open and shortly after swooned towards recent lows. It promptly reversed after tagging $39.50 and then carved out a a choppy handle as part of a C&H pattern. My target was 100% Fibonacci extension from the low of the cup to the base of the handle. Some may argue that the base of the handle is in line with ORH, in which case I entered on a base break within the bigger base.

Price stalled just 15 cents shy of the target after filling the opening gap. I took a partial and watched price retrace sharply. I moved my stop to the reaction low and waited to see what would happen. I closed the position when price reached the target and tested its all time high.

A while later, I re-entered as it became obvious that ANR wasn't finished.

I've been watching MDR for a few days, waiting for a B&B above the blue line. Finally, mid-morning it carved out 2 inside bars at the base.


[url=][/url]
Posted by Jamie at 2/25/2008 04:30:00 PM 10 comments
Labels: Base and Break, Cup-and-Handle, Fibonacci, Gap_Fill
金币:
奖励:
热心:
注册时间:
2006-7-3

回复 使用道具 举报

 楼主| 发表于 2009-3-20 17:02 | 显示全部楼层
Sunday, February 24, 2008Mail Bag - DryShips Inc. (Public, NASDAQ:DRYS)
A reader submitted this trade from Friday as depicted in the chart below. He was targeting S1 on break of 2 inside bars (NR7). "I was in the money but didn't book any hoping that it would at least test S1 at 82.50. I have a hard time telling when to book profit or let it trade. Your advice is always greatly appreciated."

The chart above maps out the areas of support and resistance. There's no obvious PP that stands out, but it's important to know where S/R levels are as well as the intraday PPs because they don't always line up.

In the early going, support turned into resistance as price based below, but could not take back the upper blue line. Two inside bars (NR7) is a common setup on this blog, but it is important to distinguish 2 inside versus NRIBs. These are not narrow range bars, even the NR7 bar is not narrow, but given what has preceded, it is the narrowest of the last seven bars. NRIBs are more powerful than regular inside bars.

The last chart is a 5 minute time frame and the point I want to highlight here is the wide swings in price leading into the trade. This is not a high quality setup despite the inside bars. After breaking out, DRYS carves out three consecutive 5 min. red bars with lower shadows, the third of which is a hammer-like. The high of the hammer bar is a whole number -$84.00. After taking out $84.00 by almost 50 cents, you have to protect that whole dollar level and plan to book some profits if the hammer initiates a reversal.


[url=][/url]
Posted by Jamie at 2/24/2008 08:28:00 PM 5 comments
Labels: 2_Inside, Hammer, NR7, Support_Resistance


Friday, February 22, 2008Dummy Trade of the Day - priceline.com Incorporated (Public, NASDAQ:PCLN)
PCLN made a decisive move lower off of the open. 4/15 was shaping up to be a NRIB so I drilled down to the 5 minute and saw a few NRIBs with consecutive lower highs. Partial as price approached $123 and exit balance on a bounce back to $124.

I could have taken a long after the stop out, but I had no idea it would retrace 50% in today's market. Notice the low volume on the retrace.


[url=][/url]
Posted by Jamie at 2/22/2008 12:37:00 AM 2 comments
Labels: Dummy, NRIB


Wednesday, February 20, 2008NASDAQ Technical Picture - Lower Trendline Holding


The NASDAQ dropped in opening trade due to higher than expected CPI inflation data. Both the Nasdaq Comp and Dow held near trendline support off the Jan-Feb lows. Narrow range trade dominated in the early going followed by a range BO triggering some midday follow through into positive territory. Choppy trade leading into the FOMC minutes was resolved with new session highs despite the Fed cutting its GDP forecast and raising its inflation and jobless forecasts.

Companies moving in after hours trading in reaction to earnings: Trading Up: LOCM +9.8%; NTES +7.0%; ITRI +6.8%; TEX +6.4%; SNPS +6.2%; IFSIA +6.0%; GA +4.2%; FADV +3.8%; ADI +3.5%; PLLL +2.3; TQNT +2.3%; TRN +1.9%; AEL +1.5%; ACTL +1.3%... Trading Down: LAD -19.9%; NVTL -18.1%; MSSR -17.7%; ATX -9.5%; OCNW -7.6%; CECO -7.1%; OII -7.0%; LNET -6.9%; MCRI -6.9%; VRGY -6.6%; PSYS -5.0%; LFG -3.1%; LGND -1.8%; GRT -1.3%... Companies moving in after hours trading in reaction to news: Trading Up: BNVI +33.9% (announces "positive developments" in on-going Phase 1/2 cancer drug trial); SQNM +6.5% (announces key milestone in development of noninvasive prenatal down syndrome test); IVAC +3.9% (receives orders for five 200 Lean magnetic disk sputtering systems for delivery in 2008); FTEK +2.6% (announces two Fuel Chem orders); IDGR +2.4% (enters into merger agreement to be acquired by an affiliate of Platinum Equity Advisors, LLC; IDGR stockholders to receive $10.30 per share); CPST +1.9% (receives another order in the oil & gas market)... Trading Down: SSRX -23.5% (reports Q4 results below consensus, issues downside FY08 rev guidance; discusses postponed original schedule of completing all three current Phase III trials by end of 2007); CIR -3.2% (announces Bill Higgins elected as CEO and Director); TTEC -2.5% (announces audit committee completes review of equity-based compensation practices with no evidence of improper conduct); DMND -1.8% (reaffims FY08 EPS in-line with consensus, says FY08 revs growth will be less than expected; sees Q2 EPS in-line, revs below); CBE -1.4% (announces its Cannon demand management solution selected by Baltimore Gas and Electric); TIN -1.1% (Carl Icahn amends 13D; reports the sale and purchase of call options); CR -1.1% (reaffirms FY08 guidance); TBSI -1.0% (takes delivery of handysize bulk carrier, M.V. Mohave Maiden for $26.0 mln); ABK -0.80% (U.K. Subisidiary insturucts the Association of British Insurers to conduct an initial holdings enquiry for the Metro Rail SSL & BCV bonds).

[url=][/url]
Posted by Jamie at 2/20/2008 08:42:00 PM 0 comments
Labels: NASDAQ


Dummy Gapper Missed Trade - Garmin Ltd. (Public, NASDAQ:GRMN)
I was focused on stocks gapping down so I missed this setup on GRMN. Hope some of you got involved. Just wanted to post this chart so I can have it for future reference.

JASO was a failed bear flag pattern. Price breaks out and then flattens out due to lack of volume and prints a couple of hammers so I exited. That was a good thing, otherwise I would have been stopped out as it took off on a momo move to the upside.

The bull flag near EOD moved like a flag pattern should.

After a period of very low volume, ACI moved above all three MAs and I felt like it would at least test the PP (first blue line). It did considerably more than that and by late in the session, it was testing last week's highs.

[url=][/url]
Posted by Jamie at 2/20/2008 05:11:00 PM 12 comments
Labels: Bearish_Flag, Bull_Flag, Gap_Fill


Tuesday, February 19, 2008Dummy Trade of the Day - Hansen Natural Corporation (Public, NASDAQ:HANS)

HANS from the WL, gapped up and carved out a mini C&H pattern on the 5 min. timeframe. An uptick in volume as price broke out soon waned and gave way to higher volume on red bars. I had a feeling that it would fail due to lack of follow-thru and tightened the stop to avoid a bigger loss.

From failures come fast moves in the opposite direction, or so they say. This failure resulted in a slow move, which eventually set up a B&B short below the blue line and under all three MAs. If you missed that move, you could have easily entered on the bear flag pattern which formed near the ORL. The red line segments are how I trailed my stop. I exited the trade as price approached $41.00 on a surge in volume which foreshadowed the end of the move. I also took a long entry near the end of the session.


[url=][/url]
Posted by Jamie at 2/19/2008 09:31:00 PM 8 comments
Labels: Cup-and-Handle, Gapper, Watchlist


Monday, February 18, 2008Schedule
No pre-market post on Tuesday, February 19th.


[url=][/url]
Posted by Jamie at 2/18/2008 12:23:00 AM 0 comments
Labels: Pre-Market


Newer Posts Older Posts Home
金币:
奖励:
热心:
注册时间:
2006-7-3

回复 使用道具 举报

 楼主| 发表于 2009-3-20 17:04 | 显示全部楼层
Sunday, February 17, 2008Narrow Range Inside Bars (NRIB) Revisited
A reader submits:

Assuming all things constant and taking this illustration very simply (ignoring PP, MA, candlestick, etc), I appreciate your advice on whether my entry (dotted blue) would be correct. I also have 2 scenarios which I don't know how to deal with.

Just to clarify, when you talk about 2 NRIBs, does the 2nd NRIB have to be inside the 1st NRIB as well?


The two easiest scenarios to address are i) and v). These are excellent setups assuming that price is above and, in very close proximity to the 5 period ema. It's also of utmost importance that volume contracts during the inside bars. Refer to my initial post on the topic. Item v) addresses the last point in that the second IB does not have to be inside the first.

Items ii) and iii) are a little more subjective and may require more confirmation. For example, if ii) is part of a flat base, I would wait until price takes out the first bar or the shadows as may be the case. If bar 3 is red, I wouldn't take the entry off of this time frame. I would drill down and look for a candlestick reversal pattern on a lower time frame. The RIMM example below, although not exactly as depicted in the chart above is somewhat similar and makes the point.

The first chart is the 15 min. and the second is the 5. See how the lower timeframe provides clarity as to what is really going on, whereas the 15 minute chart is somewhat ambiguous.


Item iii) is a good example of a triangle formation and if that is in fact what it looks like on the lower time frame, then this is the correct entry. If bar 1 is the OR and there is no resistance above including an intra day PP, then I would trade it as presented in the example. The only caveat is that until the ORH is taken out, there's always a risk. So if the ORH is only pennies away, I sometimes wait for confirmation. On the other hand, if the 2nd IB is NR7, the setup becomes all that more powerful and may not require confirmation. If you take the entry as presented, you generally have enough room to exit at or near BE if the pattern fails. It's a judgment call and you will determine which entry suits your trading style best over time.

Item vi) is a bullish flag or flag pole and should be entered on break of the flag. When drawing the line segment for the flag make sure to include the upper shadows.

Item iv) is subjective again. I often wait until price takes out bar 1 because the 5 period ema is too far away and I'm waiting for it to catch up to price. This pattern often comes up in the handle portion of the C&H pattern, and here again, I wait until price takes out bar 1. That's my personal preference and it saves me from taking trades that don't pan out, or reverse just prior to breaking out.

Here is an example of a trade with RMBS that I took a while back which depicts the same formation as item iv). As you can see from the first 15 minute chart, the 5 period ema was still quite a distance from price, so I set my buy stop order above the outside bar.


If the inside bars set up at the base of a PP or at a resistance level (for long entries as depicted above), a successful break will generally result in a big move. The best setups are the ones that give consecutive higher lows, so in that respect I prefer i), iii), and v), everything else being equal.

MarketClub Education Page Click Here

[url=][/url]
Posted by Jamie at 2/17/2008 11:19:00 AM 9 comments
Labels: 2_Inside, NR7, NRIB


Friday, February 15, 2008Dummy Gapper Trade of the Day - Arch Coal, Inc. (Public, NYSE:ACI)
ACI from the Briefing.com gapper list, was an analyst downgrade. The first chart is the daily chart with pivot point. In analyzing the setup, I surmised that the 20 day EMA was a suitable target because there was no support between it and the daily pivot.

The next chart is the 15 minute time frame which started to look very interesting as price and the down sloping 5 period EMA started coming together. There was a clear bear flag developing at the base of the daily PP (blue line). IMO, the best setups take place at, or very near their pivot points/support/resistance levels. However, because bulls and bears defend these levels, we have to be especially cautious of the head fakes.

The last chart is the 5 minute time frame which shows my entries, initial stops, and exits. Short on break of the bear flag with a partial as price approaches the ORL. After the partial I tightened my stop to $49.00 to give it a little room. Price consolidated sideways for an hour or so before the last swoon towards my target (lower blue line). The volume spike on that last leg lower foreshadows the end of the move.

As you can see from the charts, ACI carved out a bullish tweezer bottom at the target which kept me interested in a possible retracement trade. A while later it printed a perfect green hammer on the 15 and a B&B setup on the 5 min. I took the B&B long and set my prelim target at the down sloping 20 EMA on the 15 minute time frame. The 5 min. printed 3 WRBs as price rallied into the target. I placed a BE stop on the balance and waited to see if the 20 EMA would hold as resistance. After a retrace, price continued higher, eventually reaching the original BO point.

It doesn't get much better than this as far as symmetry is concerned. Study these charts for future reference and have a great long weekend!


Finding the Daily Pivot Point


In response to 00NR7, here is a chart that shows how I find the daily PP.

Click on the chart to enlarge


[url=][/url]
Posted by Jamie at 2/15/2008 11:09:00 PM 18 comments
Labels: Base and Break, Bearish_Flag, Gapper, Pivot Point


Thursday, February 14, 2008Dummy Gapper Trade of the Day - Network Appliance, Inc. (Public, NASDAQ:NTAP)


NTAP a gapper from the Briefing.com list, set up nicely on a break of inside bar (actual entry looks better on the 5 minute time frame). I was hoping for 3 WRBs but after easily taking out the ORL, it paused to consolidate at the 25% Fib. extension of the previous day high to the ORL. I took a partial as price tagged the target. I had to give the second half a really wide stop after the bullish reversal from the morning swing low.

When it retests the lows it's going to bounce because everyone who held through lunch, like me is happy to get out with initial profits still intact. At the end of the day it didn't extend much beyond the initial swoon lower.

NVDA was an earnings gap. After consolidating the early run, it set up a dummy short on the break of the daily pivot.

[url=][/url]
Posted by Jamie at 2/14/2008 05:10:00 PM 8 comments
Labels: Fibonacci, Gapper, Inside Bars, Pivot Point


NASDAQ Technical Picture - Tech Provides Leadership


Tech provided leadership on the heels of better earnings from Semi +3% (AMAT +10.1%) which carried over to other related sectors such as Computer-Hardware +3.2%, Networking +3.2%, Internet +2.9%, Disk Drive +2.7%, Software +2.1%.

We have now crossed above the lower base/pivot and are in the process of closing the gap from last week. Let's see if we can hang on to the recovery of the 20 day EMA as we approach the next PP level. Although, it's too soon to tell, it looks like we could be in the process of developing an ascending triangle.
金币:
奖励:
热心:
注册时间:
2006-7-3

回复 使用道具 举报

 楼主| 发表于 2009-3-20 17:05 | 显示全部楼层
Wednesday, February 13, 2008Dummy Trade of the Day - TBS International Limited (Public, NASDAQ:TBSI)
TBSI set up a NRIB (NR7) at the base of the ORH in close proximity to the rising 5 period ema. I took a partial at R1 and exited the balance as price approached the whole $ number $36.00.

NVDA carved out 2 inside bars on declining volume at the base of yesterday's pivot high. Long on a break of the second bar high. Sometimes when I trade lower dollar value stocks I lose perspective with respect to candlestick range. The second inside bar has a range of 20 cents and I'm thinking NRIB, but it's not. The point is a NRIB is much more powerful than a regular inside bar, everything else being equal.

Eventually NVDA carved out a C&H pattern and I used the Fib extension of the ORL to the base of the handle to gauge my target. Again, after the C&H BO, it prints 3 NRBs as the 5 ema catches up to price and that seems to provide the coiled spring effect to boost this thing into price expansion. I took a partial as price approached R2 and exited the balance near the 100% Fib. extension.


[url=][/url]
Posted by Jamie at 2/13/2008 09:44:00 PM 8 comments
Labels: 2_Inside, Fibonacci, NBR, NR7, NRIB, NVDA, Pivot Point


Tuesday, February 12, 2008Dummy Trade of the Day - Research In Motion Limited (USA) (NASDAQ: RIMM)
Shorted RIMM in the same area as yesterday's long (blue line). After breaching the blue line, RIMM recovered it, but not for long. A red hanging man foreshadowed further weakness and I waited for confirmation before shorting just in time for the late day swoon.

NVDA was a pivot point trade off of an inside bar. It got off to a great start but retraced sharply before making its way back up and eventually tagging the PP. The daily chart below shows where I get the PPs from. The target was derived from January's early swing low.


[url=][/url]
Posted by Jamie at 2/12/2008 10:51:00 PM 4 comments
Labels: Hanging_Man, Inside Bars, Pivot Point


NASDAQ Technical Picture - Testing the Pivot Point
Range and volume contraction precedes expansion. We are currently testing a pivot point resistance area and the pattern on the daily time frame looks like a small bear flag. Technically the market was due for some up ticks in the wake of last week's aggressive slide. It's a stalemate until we can break the pivot point to the upside or the bear flag to the downside.

I have no opinion, I'm just waiting for confirmation.

Companies moving in after hours trading in reaction to earnings: Trading Up: GLUU +12.6%; CPST +10.6%; NDN +7.1%; IMM +5.6% NUAN +3.3%; QGEN +2.3%; CMP +2.2%; PACR +2.0%; FWRD +2.0%; MLAB +1.6%; NXXI +1.5%; CUZ +1.4% VECO +1.1%... Trading Down: DY-16.4%; VRTX -10.5%: BRKS -7.6%; ASEI -6.7%; ANSV -2.7%; LNCR -1.6%; AGO -1.6%... Companies moving in after hours trading in reaction to news: Trading Up: ALDA +17.2% (Declares a $5.00/share special cash dividend and signs credit facility for up to $15 mln); HME +2.7% (HME will replace Kellwood in the S&P SmallCap600); XJT +1.9% (reports January 2008 performance); PCBC +1.4% (names Stephen Masterson Chief Financial Officer); FUL +1.3% (names James R. Giertz Chief Financial Officer); YHOO +0.6% (Microsoft responds to YHOO rejection - says they are confident that moving forward promptly to consummate a transaction is in the best interests of all parties)... Trading Down: FOE -3.5% (sees Q4 EPS below consensus; sees revs above consensus); CLWR -1.6% (Follow up on MOT stake in SC 13G; unchanged from earlier disclosure); RIMM
-1.0% (email reports outage of Blackberry service in Americas -- Reuters).

[url=][/url]
Posted by Jamie at 2/12/2008 12:45:00 AM 0 comments
Labels: NASDAQ


Monday, February 11, 2008Short Squeeze - ArthroCare Corporation (Public, NASDAQ:ARTC)


What causes a short squeeze?

When the short float is a significant percentage of the total float and many of the stops come into play, a short squeeze is highly likely. ARTC has been basing in a narrow range for a few weeks. During this time many shorts have tightened their stops in the area of the blue line on the daily time frame just above. When price rallied up to this level, many stops were hit simultaneously. Stops then turn into market orders. The time it takes to process all of those orders results in a short squeeze.

[url=][/url]
Posted by Jamie at 2/11/2008 08:20:00 PM 9 comments
Labels: Inside Bars, Squeeze


Dummy Gapper Trade of the Day - Research In Motion Limited (USA) (Public, NASDAQ:RIMM)
The first trade was AKAM, which carved out a mini C&H base on the 5 minute time frame. I entered long on break on an inside bar. My target was R2 PP which lined up pretty well with the 62% Fib. extension of the previous day low to the ORH.

The next trade was RIMM, which carved out a C&H pattern on the 15 min. time frame. The trigger bar was NR7-inside and my target was 100% Fib. extension of the ORL to the base at $93.00. I partialed out after 3 WRB's and exited the balance when price approached the target.


The last trade was AAPL, which had a similar base to RIMM. I wouldn't call it a C&H because the handle is too deep, but I was still expecting a 100% Fib. extension from the morning swing low to the base. The trigger bar here is not inside and doesn't qualify as a pure NR7 because volume expands rather than contract and that seemed to make all the difference in the success of the trade. AAPL came close to the stop and was extremely choppy until after the 1:45 inside bar. It extended quickly but reversed just as quickly at the $130.00 round number level.

[url=][/url]
Posted by Jamie at 2/11/2008 07:24:00 PM 5 comments
Labels: Cup-and-Handle, Fibonacci, Gapper, Pivot Point


Sunday, February 10, 2008Gaps & Pivot Points - TBS International Limited (Public, NASDAQ:TBSI)
The first chart is a wide range, 15 minute view of TBSI which gapped up on Friday (Briefing list). The blue lines are pivot points (areas where price pivots and changes direction).

The 2nd chart is a 1 minute chart of TBSI. After gapping open, TBSI successfully retests the PP and bounces. B&B at the next consolidation. Target the next PP.

AMZN (Trade-Ideas pre-market scan), had the same kind of feel to it as TBSI. It successfully retests the PP twice on the 1 minute chart. However, the base is not as orderly and the BO fails on the retest.


RIMM - late session PP BO. (5 min. charts)


[url=][/url]
Posted by Jamie at 2/10/2008 09:45:00 PM 2 comments
Labels: Base and Break, Gapper, Pivot Point


Newer Posts Older Posts Home
金币:
奖励:
热心:
注册时间:
2006-7-3

回复 使用道具 举报

 楼主| 发表于 2009-3-20 17:06 | 显示全部楼层
Thursday, February 07, 2008Cup & Handle - NVIDIA Corporation (Public, NASDAQ:NVDA)
NVDA, from the watch list, set up a cup & handle pattern at the base of the ORH. The C&H pattern is fairly straightforward and easy to trade. If you have a nicely formed handle, the trade shouldn't go into the red. From experience I target a 100% fib. extension from the low of the cup to the base of the handle. Although the NVDA trade did extend well beyond 100%, it did retrace sharply after tagging it. That tells me that a lot of traders took their profits when I did.

Related Posts: C&H pattern Explained

Extreme Stocks Click Here

[url=][/url]
Posted by Jamie at 2/07/2008 07:05:00 PM 5 comments
Labels: Cup-and-Handle, Fibonacci, NVDA


Housekeeping
Expandable Posts

Over the last couple of days, I've introduced expandable posts. In order to view the full post, you now have to click on "Read More" just below the post labels near the bottom left side of the post.


Extreme Stocks Click Here


[url=][/url]
Posted by Jamie at 2/07/2008 09:24:00 AM 6 comments
Labels: Housekeeping


Wednesday, February 06, 2008Pivot Point Trade - NVIDIA Corporation (Public, NASDAQ:NVDA) & Research In Motion Limited (USA) (Public, NASDAQ:RIMM)
The first chart is a line chart of the 15 min. time frame for NVDA. I think it might be a little easier to see the intra day pivot points from the line chart as opposed to the sticks.

NVDA is a stock I traded yesterday where it hit my preliminary target but not my secondary target. Today's OR hit the 2nd target in one fell swoop, then carved out a bullish tweezer bottom with a perfect green hammer so I went long. I took a partial as price approached the same price as yesterday's short entry. Price has a memory, or so I thought, but it just kept going up to the next resistance level.


This a line chart of VMW daily. It's very easy to see the PPs as marked by the blue lines. Ever since price moved above the lowest blue line, I've been thinking we could get some sort of short squeeze for a partial gap fill. But, each trade has been somewhat disappointing. Today's ORH tagged the swing high from Monday, retraced and carved out a bullish rounded base. Long on break of ORH. It hit the 38% Fib. extension of the previous day low to the ORH, after which I took a partial. After much chopping around, it failed as it retested the the daily high, so I exited the balance of the position.


RIMM was a beautiful short setup because there's so much space between yesterday's lows and the next pivot zone.


[url=][/url]
Posted by Jamie at 2/06/2008 09:35:00 PM 10 comments
Labels: Fibonacci, Gapper, NVDA, Pivot Point, Squeeze


Tuesday, February 05, 2008Dummy Gap Trade of the Day - Garmin Ltd. (Public, NASDAQ:GRMN)

GRMN from the WL, gapped out of a bearish flag (daily) and finally set up a dummy short just below the ORL. The entry is Trader-X style - wait for a NRB in close proximity to the down sloping 5 period ema, as price takes out the ORL. I mapped out the Fibonacci extension from the previous day high to the ORL, and then I looked at the daily for potential pivot points.

The swing high from 22/01/08 (January reaction low) was exactly $62.00 and it matched closely with the June 8th 2007 retest of the breakout. This is a significant level and whole dollar level so I decided this would be my target as opposed to the Fib. extension. If you look at the 1 min. time frame below, you can see that price rallied almost a full pt. after tagging the PP.

My afternoon trade was a perfect C&H pattern on the 1 minute time frame. I was cautious with my exits because the cup and handle base is quite a distance from the morning swing low (38% Fib. retracement) and I wasn't sure if the usual 100% extension for this pattern would be realized. From the chart we see that it tagged 100% and immediately reversed.


[url=][/url]
Posted by Jamie at 2/05/2008 11:22:00 PM 3 comments
Labels: Cup-and-Handle, Fibonacci, Gapper, Pivot Point


Monday, February 04, 2008Dummy Gapper Trade of the Day - Canadian Solar Inc. (NASDAQ:CSIQ)
CSIQ, from the watch list, gapped up on higher oil. On the 15 min. time frame we see that 2/15 carved out a bullish hammer at the base of the ORH. It's not a wide gap so the the rising 5 period ema is in close proximity. When price takes out a green hammer at the base of the ORH, it usually means instant gratification.


And why not, look at the beautiful base on the lower time frame below. Notice how price retests the pp (second blue line) after taking it out. A successful retest is a sign of strength and adds to confidence in the trading plan.

The next chart is a wide view of the 30 minute chart to show how I determine the pivot points (blue lines).
Going back to the 15 minute chart, my exit strategy is a partial after three WRBs or the upper pivot point, which ever comes first. The thinking behind 3 WRBs is that it is unlikely that price can maintain a vertical move beyond 3 WRBs without pausing for a period of consolidation or retracement. If the PP is near a whole dollar figure, I usually exit as price approaches the whole number as I did here.

After taking a partial I waited and tightened my stop just below the next consolidation, inside bar. It held for a long time.

Other non-gap trades:

RMBS - 2 NRIBs on daily - failed ahead of earnings.

VMW - rallied up to gap resistance, attempted to start a gap fill but failed. I was hoping for a short squeeze on a partial gap fill.

HANS - misguided attempt at bottom fishing on the daily time frame.


[url=][/url]
Posted by Jamie at 2/04/2008 07:47:00 PM 4 comments
Labels: Gapper, Hammer, Pivot Point, Retest, Watchlist
金币:
奖励:
热心:
注册时间:
2006-7-3

回复 使用道具 举报

 楼主| 发表于 2009-3-20 17:07 | 显示全部楼层
Sunday, February 03, 2008NASDAQ Technical Picture - Cautiously Bullish


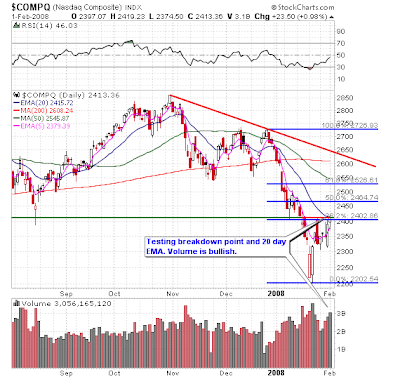
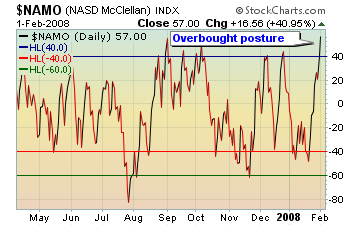
The SOX provided tech leadership on Friday, as it finally spiked out of a multi-week base. It closed on its highs and looks bullish heading into next week. Volume on the NASDAQ was bullish, in fact, it felt like institutional money was at work on the first day of the month. The McClellan oscillator is into overbought territory, so this rally may pause shortly.

Earnings Preview for the week of Feb 4th-8th: Of the hundreds of companies reporting earnings the week of Feb 4th-8th some of the bigger names include: Monday: ADM, BEAV, HUM, BMI, ILMN, LVS, RMBS, SIRF, and TMA... Tuesday: AVP, BSX, CME, MYGN, NYX, SEPR, THOR, TYC, WHR, RATE, BBBB, BRE, FORM, INSP, IVGN, JDSU, MFLX, TZOO, SGMO, DIS, and XL... Wednesday: BIIB, RAIL, LFUS, TIN, TWX, TEL, WMG, AKAM, CSCO, FISV, HUBG, PRU, RACK, TLEO, and WMS... Thursday: APA, AN, BG, DO, DHI, FLIR, ITWO, LVLT, MDTH, MEND, PENN, ATVI, BLKB, CELL, CTSH, and MFE ... Friday: AIXD, ALU, BECN, BEC, CLWR, CVH, LPNT, RTK, SKYW, and SYNT.

Stocks over $5 posting the largest percentage loss over the last five sessions include: MMA -59.0%, HTCH -34.5%, ARAY -33.2%, XPRT -32.3%, OMCL -30.0%, MELI -29.7%, VMW 25.3%, CDNS -28.1%, HSTX -27.2%, BPHX -26.7%, BFRM -23.7%, OMRI -22.5%, GHM -21.5%, ADS -19.5%, ICUI -19.4%, DRIV -19.4%, KEYN -19.2%, DCP -18.6%, LIMC -18.3%, AVID -17.7%, AWBC -17.0%, CYMI -16.8%, AMRI -16.0%, CEVA -15.8%, IAG -15.4%, CISG -15.3%, SXE -14.8%, SYX -14.8%, SKF -15.0%, ZRAN -14.9%, GSOL -14.3%, NPD -14.3%, JASO -14.2%, BLOG -13.6%, RCRC -13.4%, ALGN -13.2%, AATI -13.0%, GLAD -12.9%, NHWK -12.8%, ULBI -12.1%, CAVM -12.5%, HWAY -12.6%, YGE -12.3%.

Stocks over $5 posting the largest percentage gain over the last five sessions include: CAO 65.7%, IMB 63.3%, HOV 63.2%, MTH 56.2%, QI 52.7%, IFC 52.6%, PPCO 52.5%, OHB 49.7%, CWTR 47.2%, JBLU 45.5%, QRR 43.5%, QMAR 43.3%, INFN 41.3%, IBCP 39.9%, LL 39.5%, APWRW 39.1%, TBSI 39.2%, WCI 37.5%, BKUNA 37.2%, BBX 36.8%, CCRT 36.4%, TUP 36.1%, KWK 36.0%, PRXI 35.9%, STAR 35.9%, IMP 34.7%, PFB 34.5%, ADVNA 33.7%, LXK 33.6%, CENT 33.4%, CALC 32.8%, STC 32.8%, GCA 32.2%, LFG 32.1%, WM 32.1%, CENTA 32.0%, ADBL 31.2%, BLG 30.8%, TGIC 30.8%, CHRS 31.0%, EMKR 30.5%, WSBC 30.4%, XIN 30.4%.

[url=][/url]
Posted by Jamie at 2/03/2008 11:13:00 PM 0 comments
Labels: NASDAQ, Overbought_Oversold, SOX


Hillary and the Band


Not a political statement, just thought this video was well done.

[url=][/url]
Posted by Jamie at 2/03/2008 11:57:00 AM 0 comments
Labels: Entertainment


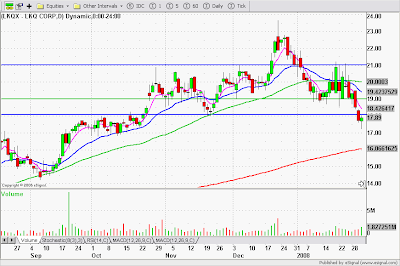
Friday, February 01, 2008Trade of the Day - LKQ Corporation (NASDAQ: LKQX)
The pre-market mood was deceptive given the bullish tech M&A (MSFT/YHOO) story versus the disappointing jobs data. I didn't want to chase stocks that already had been in bounce mode prior to this morning à la CROX and CELG, both of which gapped and produced wide, green OR bars on the 15 minute time frame. The usual suspects and last year's big tech leaders were weak again off the open (AAPL, AMZN, RIMM, BIDU, GRMN).

So I decided to take my time and look at all the WL stocks. The setup taking shape on the LKQX 15 min. chart reminded of something I read yesterday on Tom C's blog. A long upper shadow can be bullish if it is followed by a bullish inside bar.

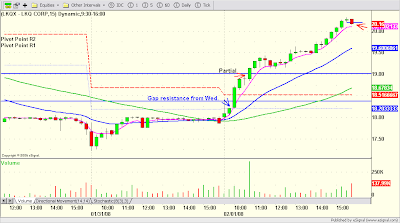
Basically, LKQX opened strong, tested gap resistance from Wednesday, and retraced, resulting in a long upper shadow. The next bar moves towards R1 and, as we can see on the 5 min. time frame below, carves out 2 NRBs, so I decide to go long. Price easily breaks through gap resistance and R2 on 3/15.

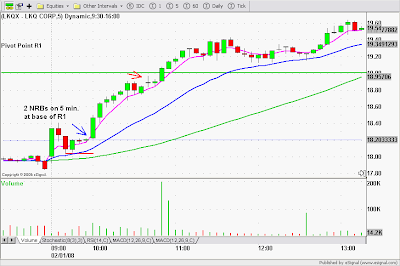
A quick look at the daily time frame and I map out my daily spots, the first of which is $19.00, a strong former support area, and now, a likely resistance area. As price approaches that level, I lock in some profit. There's not much else to say except, following a tight midday consolidation, it just continued up, closing just above the 50 DMA, halfway up to the next daily PP. Sweet!

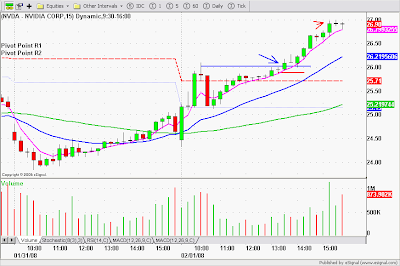
My next trade was a low risk, B&B off of a NRIB in NVDA. The SOX was in the midst of a momo bottom reversal and this is my favorite semi stock.


[url=][/url]
Posted by Jamie at 2/01/2008 04:52:00 PM 9 comments
Labels: Base and Break, Inside Bars, NBR, NRIB, NVDA, Pivot Point, SOX


Thursday, January 31, 2008Base & Break Trade - Crocs, Inc. (Public, NASDAQ:CROX)
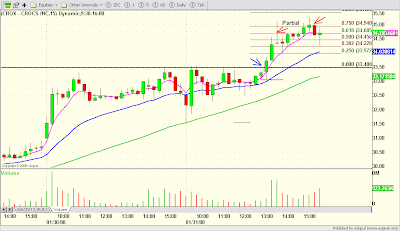
Talked about this setup last night in the comments section. I was targeting a 100% Fib. extension of the ORL to the base (blue line), but it didn't quite happen.


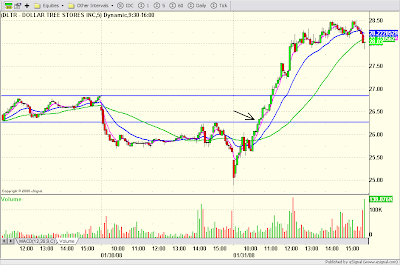
Talked about DLTR in the comments a few days ago. Unfortunately for me, I wasn't able to trade in the a.m., so this one passed me by. Hope some of you got involved.

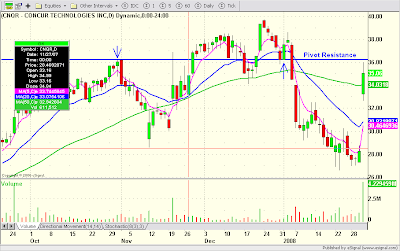
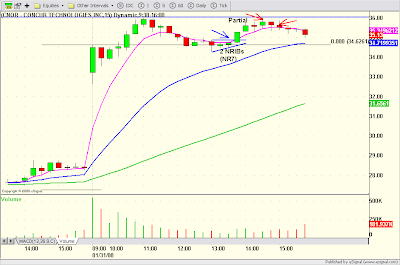
The main thing I liked about this CNQR gapper setup besides the NRIBs, was how nicely it held the ORH as support on a closing basis. I was hoping for a wider Fib. extension ie. 38% from the previous day low to the ORH, but as you can see from the daily timeframe down below, there was resistance from a pivot area.


[url=][/url]
Posted by Jamie at 1/31/2008 08:16:00 PM 17 comments
Labels: Base and Break, Fibonacci, Gapper, NR7, NRIB


Wednesday, January 30, 2008Dummy Gapper Trade of the Day - Rambus Inc. (Public, NASDAQ:RMBS)


RMBS, from the Briefing.com gapper list was already 62% extended (Fibonacci) from the previous day low to ORH by the time it carved out 2 NRIBs. But this being RMBS, 62% is not a big deal especially when $10 billion in royalties is involved. The second inside bar, was a bullish hammer so I entered long on a break of the outside bar. My preliminary concern was the January reaction high (thin blue line), but it succumbed rather easily. My next target was the daily pivot (thick blue line) which, as highlighted in the daily timeframe, was significant resistance in Oct. -Nov. 2007. It also happens to be a nice round $ number. As soon as price approached the target, I exited the trade.

Notice the euphoric volume spikes on the last two green sticks before price retraces. Also notice how the daily pivot holds as resistance on two tests in the afternoon.

On the daily timeframe, when price finally broke through the PP in early December, it printed a WRB on higher volume. That's the magic of the daily PP BO.


BTW, I'm adding RMBS to the WL.


[url=][/url]
Posted by Jamie at 1/30/2008 09:43:00 PM 3 comments
Labels: 2_Inside, Fibonacci, Gapper, NRIB, Pivot Point


Newer Posts Older Posts Home
金币:
奖励:
热心:
注册时间:
2006-7-3

回复 使用道具 举报

 楼主| 发表于 2009-3-20 17:08 | 显示全部楼层
Tuesday, January 29, 2008Dummy Gapper Trade of the Day - TBS International Limited (Public, NASDAQ:TBSI)
TBSI from the Briefing.com gapper list, retraced sharply off the open into the rising 5 period ema, followed by a snap back, bullish tweezer bottom reversal and 2 NRIBs (NR7) so I entered long above the base (easier to spot the base on the 5 minute time frame below). My preliminary target was daily resistance where I booked a partial profit. I was hoping price would hold the ORH as support, but it failed and stopped me out.


[url=][/url]
Posted by Jamie at 1/29/2008 08:05:00 PM 4 comments
Labels: 2_Inside, Gapper, NR7, NRIB, Support_Resistance


Monday, January 28, 2008Dummy Gapper Trade of the Day - Acorda Therapeutics Inc. (Public, NASDAQ:ACOR)

ACOR from the Briefing.com gapper list had a wide opening gap and took out its all time high on 2/15. The third bar carves out a bearish tweezer top reversal and price comes back into the rising 5 period ema. It holds the 5 ema on a closing basis and starts to consolidate sideways, eventually forming a flat base. Throughout the consolidation, the lower shadows form a series of higher lows. As price becomes increasingly narrow, ACOR prints 2 NRIBs (NR7) and I go long on the break of the blue line. It started out beautifully with a WRB that closed near its high (critical success factor) and then it died. It was a nail biter until it finally took out, and closed above my entry bar. Exit as price approaches morning swing high.


[url=][/url]
Posted by Jamie at 1/28/2008 08:19:00 PM 11 comments
Labels: 2_Inside, Base and Break, Dummy, Gapper, NRIB, Tweezer_Top


Sunday, January 27, 2008NASDAQ Technical Picture - Bear Market Bounce
38% Fibonacci retracement of the NASDAQ's last leg down was a cue for profit taking. Friday's gap up due to MSFT earnings was a perfect exit strategy because it brought us all the way back to the last breakdown point. Declining volume on this week's bounce is typical of a bear market bounce. Friday's bearish engulfing bar implies further weakness ahead of the FED on Wednesday. The economic calendar is loaded this week starting with New Home sales tomorrow at 10:00.

Earnings this week from internet heavyweights - YHOO, AMZN and GOOG.


[url=][/url]
Posted by Jamie at 1/27/2008 10:06:00 PM 2 comments
Labels: Fibonacci_retracement, NASDAQ


Thursday, January 24, 2008Swing Trade Update - Research In Motion Limited (Public, TSE:RIM)

RIM.TSX gapped up on the open and closed on its highs. After hours (AH) RIMM.NASDAQ is trading up! I'm using the 20EMA (blue) as my guide but expect to close the position tomorrow as the daily 20 and daily PP come into play around $97.00.

Update: Friday January 25th 9:54 EST - Sold my RIM.TSX at $99.00


[url=][/url]
Posted by Jamie at 1/24/2008 09:31:00 PM 4 comments
Labels: swing


Dummy Pivot Point Trade - Amgen, Inc. (Public, NASDAQ:AMGN)
The first chart is the daily time frame for AMGN EOD yesterday. The main take away here is that AMGN breached the daily pivot intraday yesterday, but managed to close on it.


The second chart is daily after today's session. AMGN reported earnings AH and price is basing near the upper daily pivot heading into tomorrow.
The next chart is the 5 min. time frame for AMGN. It gapped down on the open and retested yesterday's lows carving out a tweezer-like bottom, before reversing and setting up a low risk, dummy entry at the base of the daily pivot (blue line). Price made a vertical move to R1 where I took a partial. My next target was R2, but I settled just under $46.00 because that was feeling like a top.


[url=][/url]
Posted by Jamie at 1/24/2008 09:12:00 PM 4 comments
Labels: Dummy, Gapper, Pivot Point, Retest, Tweezer_Bottom


Wednesday, January 23, 2008NASDAQ Technical Picture - High Volume Shake Out
The five yr. weekly chart shows that we have a 38% Fibonacci retracement of the 2002 lows to the 2007 highs.

Today marks the best day of the year (not hard to do). Technically we finally got a daily reversal bar (outside day/higher close) amid heavy volume. Nice short covering rally in the afternoon.

[url=][/url]
Posted by Jamie at 1/23/2008 11:13:00 PM 0 comments
Labels: NASDAQ


Dummy Trade of the Day - Apple Inc. (Public, NASDAQ:AAPL)
AAPL - wide earnings gap. The setup felt similar to my RIM.TSX trade from Monday. After gapping lower, price carves out a tight sideways pattern until the down sloping 5 period ema catches up. We had two NRIBs, the second of which was NR7 leading into price expansion. The BO bar (7/15) closes near its low which is one of my critical success factors in this type of setup. I took a partial as price approached the round $ number on the 3rd WRB.


JOYG was not a wide gap, but it carved out a number of long upper shadows and could not close above the down sloping 5 period ema. Short the break of red inverted hammer. Again, the BO bar closes near its low signalling a great start. I missed my partial on the third WRB, so I tightened my stop, but I was rewarded with a hanging man and price broke through yesterday's pivot low at the $50.00 pt. I tightened the stop again as price consolidated at $50.00 and was stopped out on a partial. Shortly after, price swooned down to S2 (red line) on a huge volume spike and that was the end of the move.

Today was the flushing out day that we've all been waiting for. I took two longs this afternoon AAPL and RIM.TSX. Here's a picture of the AAPL trade. The bullish rounded bottom is a great long signal because it shows that demand exceeds supply. Everytime bears try to push price lower, more buyers step up. I'm holding a partial on RIM.TSX for a swing with a BE stop.


[url=][/url]
Posted by Jamie at 1/23/2008 07:41:00 PM 7 comments
Labels: 2_Inside, 3_WRBs, Gapper, NR7, Rounded_base


Tuesday, January 22, 2008"Not a Dummy Setup" Gap Fade - PowerShares QQQ Trust, Series 1 (ETF) (Public, NASDAQ:QQQQ)
The first chart is the 5 min. open of QQQQs. The distance between the price and the down sloping 5 period ema is extremely wide. The first 5 min. stick closes on its highs, so I'm going long with a partial gap fill target of $44.50 (middle blue line).


I took a partial when price couldn't close above 5 ema and carved out a bearish star with long upper shadow. Moved stop to BE and exited when price approached the target on the next upswing.
I was hoping AAPL would rally ahead of earnings. Long on break of 2 inside bars. Move stop to BE after partial. AAPL carved out a tweezer top reversal at pivot high, followed by a bearish looking inside bar so I tightened the stop.


[url=][/url]
Posted by Jamie at 1/22/2008 09:56:00 PM 12 comments
Labels: 2_Inside, Gap_Fade


Monday, January 21, 2008Dummy Gapper Trade of the Day - Research In Motion Limited (Public, TSE:RIM)
This is the Canadian chart for RIMM. It gapped down on the open and carved out two inside bars (3 & 4) with bearish upper shadows. However, the down sloping 5 period ema was too far away. The 5th bar was narrow, red, and closed on its lows, setting up a perfect dummy short. I took a partial as price bounced back up towards the 25% Fibonacci extension of the previous day high to the ORL. That bar closed as a perfect hammer followed by a NRIB so it was time for me to tighten my stop.


[url=][/url]
Posted by Jamie at 1/21/2008 08:16:00 PM 10 comments
Labels: 2_Inside, Dummy, Fibonacci, Gapper


Financial Armageddon
While U.S. Markets are closed for the holiday, the rest of the world panics.

Canadian TSX down 550 pts. or 4.3%
European stocks in massive sell-off
U.S. Recession fears spark heavy selling in Asian Markets

[url=][/url]
Posted by Jamie at 1/21/2008 11:10:00 AM 4 comments
Labels: Investments


Newer Posts Older Posts Home
金币:
奖励:
热心:
注册时间:
2006-7-3

回复 使用道具 举报

 楼主| 发表于 2009-3-20 17:09 | 显示全部楼层
Sunday, January 20, 2008Watch List January 20, 2008
The usual suspects of tired leaders - solar, shipping, and to a lessor degree agri/fertilizer needs to be refreshed. So far this year the only sector I really like as a potential new leader is medical supplies $DJUSMS. My short list of medical supplies stocks are BAX, BCR, and BDX. Other names in the sector include OMI, IDXX, PSSI, XRAY PDCO ACL and IMA.


Here's my new watch list for the next few weeks. Earnings season is a good time to find new leaders and losers so I'm sure we'll have fresh names very soon.

AAPL, ABX, ADSK, AKAM, ALXN, AMZN, ARTC, BAX, BCR, BDX, BIDU, BMRN, CAL, CELG, CNQ, CPHD, CREE, CROX, CSIQ, DO, DRYS, ESRX, FFIV, FSLR, FWLT, GRMN, HANS, HUM, ILMN, IMCL, INTC, JASO, JOYG, LKQX, LRCX, MDR, N, NVDA, OTEX, POT, PPDI, RIMM, SIGM, TNH, VMW

Reader Picks: TEVA


[url=][/url]
Posted by Jamie at 1/20/2008 07:41:00 PM 6 comments
Labels: Watchlist


Mailbag
Hi Jamie.

Say you are looking for a set-up and plan to enter on a break of the high of the entry candle and place your stop one cent below the low of the entry candle. As you flip through your watch list, you come across a great set-up that just formed and price action is currently on the next candle. What if price had broke the high of the entry candle before you noticed it and is now down below the entry point, but still above where your stop would have been?

Example.

High of entry candle: $20.35
Low of entry candle: $20.00

Next candle has gone up to $20.39 but is now at $20.25.

If you would have had your buy stop order @ $20.36 entered on time, you would already be in the trade. But considering you aren't, would you enter at $20.25 anyway and be happy that you are following your rules but are getting an even lower risk entry? Perhaps you would even buy more shares than planned with the lower risk? Or would you recommend placing a buy stop at $20.36 and wait for the price to climb back up to the intended entry point?

I often am busy looking at other charts and find myself in this situation when I load the chart with the good set-up. Half of me thinks I should wait until the price climbs back up, whereas the other half thinks I should get into the trade at a bargain price.

Thank-you for any advice.

-Nathan

Hi Nathan,


Here is an example of ADS (15 min.) which gapped up on Friday. After failing to take out the ORH, it retraced and made a move back up. At point A it started forming a solid base above the rising 5 period ema. At point B it attempted to BO but failed and pulled back.

If we drill down to the 5 min. time frame, I would not recommend buying in the area of point C at a better price. Once price pulls back, there's no guarantee that it will recover. The best place to enter is point D at the original buy stop price. In the ADS example we have a solid trigger bar at the original intended entry price. If this is not the case, for example, if the base is choppy, it might be better to wait until the high at point B is taken out.


If I miss an intended entry, I like to see how the next candle closes on the lower time frame. This usually gives me a good idea if the BO is a failure, or just a false start. If we look at my ESRX trade from Friday (5 min. chart below) and assume I missed my intended entry at the red arrow. We see that the next bar retraces above the PP (blue line). We also see that my stop is not taken out and that the next two candles print long bearish upper shadows. These two inside bars are weak so it is safe to enter on a break of the pink line, which is basically the intended entry point, or we can again wait until the green line segment is taken out. Either rule would get the job done. The bear flag above the pink line implies lower prices to come.


Hope this answers your question.


[url=][/url]
Posted by Jamie at 1/20/2008 10:09:00 AM 2 comments
Labels: Mailbag


Saturday, January 19, 2008Trade of the Day - Express Scripts, Inc. (Public, NASDAQ:ESRX)
ESRX was downgraded from Buy to Hold at Citigroup in pre-market. It gapped lower on the open but managed to fill the gap in the 15 min. OR. Despite early strength, it could not close above the 20 EMA. That failure was followed by two red inside bars at the base of PP support (blue line). The second inside bar was NR7. I shorted a break of the first inside bar just below the PP. My target was a full retracement back to the ORL at R2. Price stalled at the 75% retracement level and started to reverse. I quickly booked a partial and watched closely to see if price would consolidate or reverse.


As you can see from the 5 minute chart below, as price moved from the 75% retracement level back up towards the 50% level, it carved out two doji-like sticks with long upper shadows and it could not close above the down sloping 5 period ema. This signaled further weakness ahead. The target was reached shortly after as price resumed in my direction.


[url=][/url]
Posted by Jamie at 1/19/2008 10:37:00 PM 9 comments
Labels: 2_Inside, Fibonacci_retracement, Gapper, NR7, Pivot Point
金币:
奖励:
热心:
注册时间:
2006-7-3

回复 使用道具 举报

 楼主| 发表于 2009-3-20 17:10 | 显示全部楼层
Friday, January 18, 2008NASDAQ Technical Picture - Testing 52 Week Lows
Click on chart to enlarge


Things are pretty ugly but at these levels, we're due for a technical bounce. However, OPEX and the long weekend should keep bulls at bay until next week.

[url=][/url]
Posted by Jamie at 1/18/2008 06:36:00 AM 0 comments
Labels: NASDAQ


Wednesday, January 16, 2008Acronyms and Abbreviations
In response to reader mail, here is a list of my blog's most commonly used acronyms and abbreviations:

NRB - Narrow Range Bar
WRB - Wide range Bar
ORH (L) - Opening Range High (Low)
NRIB - Narrow Range Inside Bar
ORBO - Opening Range Breakout
C&H - Cup and Handle
H&S - Head and Shoulders
BO - Breakout
BE - Break even
EOD - End of Day
B&B - Base and Break
PP - Pivot Point
R2 - Pivot point resistance level 2
S2 - Pivot point support level 2
NR7 - Narrowest price/volume bar in the last 7 bars. Price/volume contraction ahead of expansion.
4/15 - 4th bar on the 15 minute time frame.
SS - Short squeeze
SMA - Simple moving average
EMA - Exponential moving average
5 EMA - 5 period EMA
S/R - Support/Resistance
R:R - Risk: Reward Ratio. If the trade generates 3.0R, the return is three times the amount risked.
WL - Watch list
TI - Trade_Ideas Scanner
PDH(L) - Previous day high (low)
R-zone - Fibonacci retracement zone

If you need help understanding my underlying trading methodology, read the Intro to WSW Blog under Key Posts in the side panel. It's not complete by any means, but it's a good start.

[url=][/url]
Posted by Jamie at 1/16/2008 07:06:00 PM 4 comments
Labels: Mailbag


Tuesday, January 15, 2008Pivot Point Trade - Continental Airlines, Inc. (Public, NYSE:CAL)
The 15 minute chart above highlights the pivot point base developing intraday. I mapped out my Fibonacci extension lines last night (from yesterday's low to the PP base), and set my target at the daily down sloping 50 day SMA. Oil opened sharply lower this morning so I used the lower time frame (3 min.) to pick my spot. I was lucky enough to get 2 inside bars in the upper portion of the 3 min. OR (opening range). Long on a break of the second bar high. I took a partial after 3 WRBs (wide range bars) and exited the balance as price approached my target.

As you can see from the chart below, price extended 1.38% of the distance from yesterday's low to the PP base in just one hour. A nice way to start the trading day!


The daily chart below shows how nicely synchronized the setup was with the 50 SMA and November pivot lows in perfect harmony.


[url=][/url]
Posted by Jamie at 1/15/2008 08:33:00 PM 7 comments
Labels: 2_Inside, Fibonacci, Pivot Point


Monday, January 14, 2008Dummy Gapper Trade of the Day - WellCare Health Plans, Inc. (Public, NYSE:WCG)
WCG gapped open and broke out of a C&H pattern on the daily chart below. After taking out the ORH it extended 38% and retraced back to the base of the ORH. The ORH held as support through a lengthy sideways consolidation. Finally, it regained the 5 period ema and carved out 2 NRIB (inside the previous WRB, but 2nd inside bar is not inside the first). The price/volume contraction set off a parabolic move (easier to see on 5 minute time frame).


I'm going to follow-up on this one to see if we get 100% fib ext. on the daily C&H pattern.

VCLK, another gapper from the Briefing list, set up a C&H pattern and extended 100% from the low of the cup to the base of the handle.


[url=][/url]
Posted by Jamie at 1/14/2008 08:27:00 PM 8 comments
Labels: Fibonacci, Gapper, NR7, NRIB, Parabolic


Sunday, January 13, 2008Dummy Gapper Trade of the Day - USANA Health Sciences, Inc. (Public, NASDAQ:USNA)
USNA gapped up on high volume and rallied up to daily resistance before giving most of the OR back in a long upper shadow. It retraced 62% of the move from the pre-market low to the ORH and carved out a tweezer bottom. The seventh 15 min. bar was NR7 and the next bar was a bullish hammer with support from the rising 5 period ema. I entered long on the next bar at $45.00. My target was the ORH. Price rallied up to the 62% Fib retracement level of the morning swing low to the ORH before stalling and printing a red star which was my cue to exit the trade.

Late in the session USNA carved out a perfect C&H base. My experience with C&H patterns that set up EOD is a high failure rate so I didn't put a lot of money to work here. Too bad.


[url=][/url]
Posted by Jamie at 1/13/2008 09:08:00 PM 4 comments
Labels: Fibonacci_retracement, Gapper, NR7, Tweezer_Bottom


Thursday, January 10, 2008Dummy Gapper Trade of the Day - Continental Airlines, Inc. (Public, NYSE:CAL)
CAL, a watch list stock gapped up on a combination of factors including lower oil, and an extremely oversold sector, and possibly the UAUA upgrade. The second bar was inside and the third almost inside in the upper portion of the OR at the base of R2. I entered long on a break of the third bar high. This was followed by tight NR trade until resistance (blue line was taken out and retested). The final thrust was vertical, extending up 100% from the previous day low to the ORH.


[url=][/url]
Posted by Jamie at 1/10/2008 07:47:00 PM 7 comments
Labels: Fibonacci, Gapper, Watchlist


Wednesday, January 09, 2008NASDAQ Technical Picture - Late Day Reversal and Short Covering Rally

The late day reversal rally was broad based. Aided by short covering, we managed to rally all the way back to Monday's lows which is our next resistance level as depicted on the 15 minute time frame.

The medical supplies sector which I highlighted a few days ago, was a big winner today.

[url=][/url]
Posted by Jamie at 1/09/2008 10:13:00 PM 0 comments
Labels: NASDAQ


Newer Posts Older Posts Home
金币:
奖励:
热心:
注册时间:
2006-7-3

回复 使用道具 举报

 楼主| 发表于 2009-3-20 17:12 | 显示全部楼层
Wednesday, January 09, 2008Mail Bag
[size=130%]Trader Feedback
Hi Jamie,
Just to let you know how I've been doing. For the three month period
ending December 31, with 39 trades taken, my expectancy is 0.61, win
rate 44 percent, and a profit of 23.9R.
I continue to read your blog faithfully everyday which you post.
I have recently identified a weekly goal of attempting to achieve a 5R
profit. I plan on incorporating your pivot point method into my
trading plan.
Again, thank you for your help and the service you are providing with
your blog. Gary

Thanks for sharing Gary.  Your doing great which is an inspiration for
other traders and good for my ego as well!
[size=100%]


[url=][/url]
Posted by Jamie at 1/09/2008 09:26:00 PM 2 comments
Labels: Feedback, Mailbag


Bear Trap - Research In Motion Limited (USA) (Public, NASDAQ:RIMM)
RIMM set up a bear trap reversal this afternoon after taking out its ORL. After an almost 2 pt. swoon, price reversed on high volume, returned to the morning pivot low and broke out. The 5 minute chart below is how I traded it. It might be better to wait for the retest on the entry, but I was a little too anxious. If price stalls in the PP zones marked by the blue lines, start to partial out. I took a partial as price approached the morning swing high and folded when my target was met. Notice how the middle PP holds as support after price tags the green line and consolidates.
These bear traps or head fakes usually occur after an extended slide at technically oversold levels.


[url=][/url]
Posted by Jamie at 1/09/2008 08:17:00 PM 11 comments
Labels: bear_trap


Tuesday, January 08, 2008Dummy Gapper Trade of the Day - Randgold Resources Ltd. (ADR) (Public, NASDAQ:GOLD)

Gold was hitting new highs again this morning but the usual suspects (ABX, NEM) were too fast out of the gate. GOLD tested resistance on the open and consolidated sideways until the rising 5 period ema caught up with price. After closing above the ORH, it carved out an inside bar, which was my cue to get long. I exited on a euphoric volume spike after 3 WRBs thinking that it was the end of the move.


[url=][/url]
Posted by Jamie at 1/08/2008 09:13:00 PM 6 comments
Labels: Fibonacci, Gapper, Inside Bars


Dummy Trade of the Day - Crocs, Inc. (Public, NASDAQ:CROX)

The first two charts for CROX are from Friday. Price gapped down with the market on weak jobs data. Price tried to recover, but selling pressure resumed after one inside bar on the 15 min. The 5 minute chart shows how price could not close above the down sloping 5 period ema.

I covered just above the 62% Fib. extension of the previous day high to the ORL, when price took out the previous bar (hammer-like) high.

The last chart is yesterday's trade. CROX continued to sell off on the open with a decisive move lower. It attempted a technical bounce along with the market, but could not close above the down sloping 20 period ema (62% Fib. retracement of the ORH to the morning swing low). It carved out a star with a long upper shadow signaling a reversal. My preliminary target was the morning swing low, but since it took so long to get there, I covered 100%.


[url=][/url]
Posted by Jamie at 1/08/2008 05:24:00 AM 2 comments
Labels: Fibonacci, Gapper


NASDAQ Technical Picture - Bears Maintain Control

Still waiting for a tradable bounce to set up. Mid-morning rally efforts were stifled because of a lack of buying interest, however, the late session higher low and hammer-like stick on the daily chart look promising. But, we need a sustained thrust above yesterday's swing high in order to start thinking about suitable long setups.

The medical supplies index bucks the selling trend. Components propelling the sector index higher yesterday included BCR +4.7% and BDX +2.3% which set new 52-wk highs along with BAX +2.9%, OMI +2.8%, IDXX +2.4%, PSSI +2.4%, XRAY +2.4% (held near 50 day support), PDCO +2.4% (testing 50 ema resistance again), ACL +0.9% (held at 200 sma support), IMA +0.4% (testing 50 sma resistance). Other health related names that continue to perform well include: ESRX +5.3% new 52-wk high, MHS +1% new 52-wk high and HUM +1.8% (approached its Oct/52-wk high today).


[url=][/url]
Posted by Jamie at 1/08/2008 05:05:00 AM 0 comments
Labels: NASDAQ
金币:
奖励:
热心:
注册时间:
2006-7-3

回复 使用道具 举报

 楼主| 发表于 2009-3-20 17:13 | 显示全部楼层
Sunday, January 06, 2008NASDAQ Technical Picture - Weak Jobs Data Triggers Selloff as Recession Fears Loom Large


Broad market volatility moved higher this week with the VIX up 15.91% from last Friday's close, now at 24.04 and tech volatility increased with the VXN (Nasdaq Volatility Index) higher by 21.79% on the week at 28.78. The major indices reveal broad market declines this weak (on light volume due to mid-week holiday) with the Dow (heading for the worst start to a year since 1904, according to Bloomberg) and the Nasdaq leading the way lower. They say that the first week of the year is usually a good indicator for the rest of the year. If that's true, we're in for a real nasty bear market. Overall economic data this week was disappointing, most notably was the much weaker than expected read on manufacturing and Nonfarm Payrolls. The SPX lost 4.1% this week, the Dow is -4.0% and the Nasdaq is -6.0% on the week... The CBOE put/call ratio is at 1.14 today, indicating higher put trading than call trading.

The weak jobs data, pummeled stocks yesterday as recession fears became a real possibility. All sectors were hit (Utilities the sole exception). The NAZ gapped down about 30 pts. and added almost another 70, to end the session down 98 pts. from Thursday's close.

All the major indices are oversold with the high TRIN close (4.10) implying excessive selling pressure and thus raising the potential for a stabilization/rebound on Monday. The weak close Friday allows for some follow through pressure in the early going, but after six days of aggressive declines and with some sector indices near support (Housing XHB 16.61, Finance XLF 27.34 and Semi SMH 29.14/29.02), the case can be made for at least a short term pause in the selling.

[url=][/url]
Posted by Jamie at 1/06/2008 10:44:00 AM 3 comments
Labels: NASDAQ


Thursday, January 03, 2008Dummy Trade of the Day - Barrick Gold Corporation (USA) (Public, NYSE:ABX)
ABX tested yesterday's high on the OR and held support of rising 20 ema on the second bar. After that it swung back up to the base, setting up a B&B long. I took a partial at R2 (62% Fib extension of the previous day low to the base of today's ORH and yesterday's high) and hoped that it would make an attempt for $50.00 in the afternoon, but it eventually pulled back. The daily is extended, so I suspect it will consolidate now, unless the jobs data tomorrow is really bad.


AAPL carved out a triangle pattern which was breached on weakness in mid-afternoon. Price consolidated the breach on the outer edge of the triangle with all three MAs converging over head. My target was yesterday's low.


[url=][/url]
Posted by Jamie at 1/03/2008 08:40:00 PM 3 comments
Labels: Base and Break


Wednesday, January 02, 2008Dummy Gapper Trade of the Day - Barrick Gold Corporation (USA) (Public, NYSE:ABX)


In pre-market, gold and oil were strong as market futures faded. ABX setup nicely at the daily PP. After the initial thrust, allow for a 38% Fibonacci retracement. Price dipped into the rising 5 period ema, carved out a red hammer, followed by a bullish green stick which led to the next wave. I took a partial at the daily gap fill level, but price didn't even pause. That was a 2.62 Fib. extension - sweet!


AMZN was a scratch, but I liked the fact that it held the ORL and then based along the blue line. I entered long on the third test of the blue line and for a while it looked good. I wasn't expecting a retest after such a long consolidation. After the retest, AMZN carved out a lower high and it was time to plan an exit.

[url=][/url]
Posted by Jamie at 1/02/2008 09:43:00 PM 5 comments
Labels: Fibonacci, Gap_Fill, Gapper, Pivot Point, Retest


Friday, December 28, 2007Dummy Gapper Trade of the Day - Barrick Gold Corporation (USA) (Public, NYSE:ABX)

ABX is a WL stock and was also a Briefing.com gapper this morning along with several big gold plays on expectations for 2008. Gold is also a flight to safety in an uncertain geopolitical environment. ABX gapped up just above yesterday's range into R2. The second bar was inside, closing on the cusp of R2. I placed a buy stop order two pennies above the ORH.

The daily chart highlights two targets. The lower line is a minor pivot area at the round $ number $42.00 and lines up closely to the 62% Fib. extension of the previous day low to the ORH. The second level target is the November reaction swing high.

I took a partial after price tagged the 62% Fib level and pulled back. I was prepared to allow for a 38% retracement of the move from ORL to the morning swing high, but price held the 5 period ema on a closing basis, carving out a bullish flag on declining volume. Afternoon trade involved several consolidation zones, however, price held the 5 ema which had a nice 45 degree angle, and there was never any reason to exit the trade until the close as the 2nd level target felt like it could be attained as volume accelerated into the last hour.

[url=][/url]
Posted by Jamie at 12/28/2007 07:52:00 PM 7 comments
Labels: Bull_Flag, Fibonacci, Gapper, Inside Bars


Wednesday, December 26, 2007Dummy Trade of the Day - Cree, Inc. (Public, NASDAQ:CREE)


Briefing note at 10:20 a.m. CREE spikes to session highs as Amtech analyst on CNBC highlights stock as play in the LED lighting space (24.48 +0.98) .Cree was also highlighted favorably by IBD on Friday. It also has very high % short float.


I entered long after price consolidated the intial thrust from the positive Amtech analyst comments on CNBC. I took a partial after a 1 point gain and moved my stop on the balance to break-even, allowing for a 38% Fib. retracement from the session lows to the swing high. A second entry was possible off of the mini C&H pattern midday. I should have added back my original share size on the break of the C&H, but I was cautious given the % change thus far.


[url=][/url]
Posted by Jamie at 12/26/2007 08:28:00 PM 3 comments
Labels: Base and Break, Fibonacci_retracement


Newer Posts Older Posts Home
金币:
奖励:
热心:
注册时间:
2006-7-3

回复 使用道具 举报

 楼主| 发表于 2009-3-20 17:14 | 显示全部楼层
Thursday, December 20, 2007Gapper - LDK Solar Co., Ltd. (Public, NYSE:LDK)
Joe traded LDK today for a nice gain, but feels he left too much money on the table. How would I have traded it? I'd would have placed my Fib extension lines from the previous day high to the flat base as opposed to the ORL. Short on a breach of the base with the 5 ema in very close proximity acting as resistance. Generally I exit after 3 WRBs, but LDK capitulates on a huge volume spike on the second WRB. So, normally I would partial out and move my stop about 5 cents above the WRB. This WRB is really wide and the fact that it happens right at lunch time is a good excuse to cover 100%, otherwise it means a potential stop out or a long drawn out consolidation through the lunch time doldrums.

In mid afternoon, LDK starts to setup a reversal as it takes out the 5 ema on a closing basis. Note that there is no volume to support the move, and it can't break the round $ number $50.00. Eventually, it carves out a mini rounded top which is bearish (supply > demand). You can short the confirmed hanging man and catch the next leg lower. Notice how volume picks up and accelerates into the close. If you look at the daily or the wide view of the 15 min, you'll see that this was a gap fill dating back to December 7th.


[url=][/url]
Posted by Jamie at 12/20/2007 09:33:00 PM 8 comments
Labels: Base and Break, Fibonacci, Gapper


Dummy Gap Fade - Celgene Corporation (Public, NASDAQ:CELG)
CELG cratered on the open and then bargain hunters moved in. It set up a perfect dummy long (NR7 inside) as it based narrowly at the cusp of the reaction swing high (second bar high). I exited at the 100% Fibonacci retracement of yesterday's close. That was equivalent to my trade mark 3 WRBs exit strategy.

Later in the day, I took a second entry off of the 5 minute chart as it formed and inverted H&S pattern.


I highlighted WFR last night on the daily as a potential BO candidate. A small gap open followed by a choppy consolidation did not generate much interest until after it retested and held yesterday's high as support. After that, it was just a matter of waiting for a NRB above the 5 period ema.
So I traded the same two stocks as yesterday with much better results, especially on CELG.


[url=][/url]
Posted by Jamie at 12/20/2007 08:28:00 PM 2 comments
Labels: Fibonacci, Fibonacci_retracement, Gapper, NR7, NRIB


Wednesday, December 19, 2007Dummy Trade of the Day - Celgene Corporation (Public, NASDAQ:CELG)


I had planned to partial out at the lower blue support line but I got stopped out prematurely. Too bad, as you can see from the charts (15 min. and daily), this was a really nice setup with a high probability of retesting the recent lows.

WFR was just a scalp, but looks like it wants to BO of this trading range so keep it the focus list for tomorrow.


[url=][/url]
Posted by Jamie at 12/19/2007 09:35:00 PM 0 comments


Tuesday, December 18, 2007Low Volatility Breakout Leading to Parabolic Move - Canadian Solar Inc. (Public, NASDAQ:CSIQ)


I wrote about the "Low volatility Breakout" back in July 2006. All of the criteria I elaborated back then apply to this trade setup for CSIQ. The only difference is that back then I used a 10 period EMA and now I use the 5 EMA (the 5 comes from Trader-X).

The only other observation I would add now from further experience is that for trending stocks on lower time frames such as this, the first consolidation bar usually holds as support. If it doesn't, it almost always leads to some sort of retracement. The red line segments are areas where I tightened my stop. After the break above resistance, allow for a retest of the BO point.

Parabolic moves usually have sharp reversals, so you want to be ready to take profits quickly. After price failed to hold $27.00 I immediately tightened my stop to $26.50 for a stop out. The ideal entry is at the break of the blue line, but I didn't mind the late entry because the setup met all of the criteria. At the very least, I expected it test resistance. (charts - daily, followed by 15 min, and 5 min.)

[url=][/url]
Posted by Jamie at 12/18/2007 08:19:00 PM 6 comments
Labels: Low_volatility_BO, Parabolic
金币:
奖励:
热心:
注册时间:
2006-7-3

回复 使用道具 举报

您需要登录后才可以回帖 登录 | 立即注册

本版积分规则

本站声明:MACD仅提供交流平台,请交流人员遵守法律法规。
值班电话:18209240771   微信:35550268

举报|意见反馈|手机版|MACD俱乐部

GMT+8, 2025-7-21 04:27 , Processed in 0.077562 second(s), 9 queries , MemCached On.

Powered by Discuz! X3.4

© 2001-2017 Comsenz Inc.

快速回复 返回顶部 返回列表