搜索
楼主: hefeiddd

一个笨蛋的股指交易记录-------地狱级炒手

  [复制链接]
 楼主| 发表于 2009-3-20 16:12 | 显示全部楼层
Tuesday, September 09, 2008NASDAQ Technical Picture - Tech Titans Swoon to Support
The NASDAQ is underperforming as it approaches key technical support levels between 2200 and 2175 on increasing volume. Oil is also approaching its 50% Fib. retracement level and the psychologically significant $100.00 mark. The aggressive selling makes me less confident that the key technical levels will result in anything more than a consolidation point.


The titans of tech, AAPL, RIMM, and GOOG are testing key support levels. I don't actively trade GOOG, but AAPL and RIMM could go to $120.00 and $80.00 respectively, if these support levels don't hold.


[url=][/url]
Posted by Jamie at 9/09/2008 11:22:00 PM 3 comments
Labels: AAPL, GOOG, NASDAQ, RIMM


Parabolic Move - Lehman Brothers Holdings Inc. (Public, NYSE:LEH)
The first chart is the daily which shows a bearish engulfing bar following the FRE/FNM bailout. That was very telling given that most financials were up yesterday.

In this morning's pre-market post, we said that LEH was gapping lower because the investment talks with the South Korean bank were over. That was the biggest story of the morning and LEH was the most active on my TI pre-market scan.

Initially, LEH formed a bullish rounded base on the 1 min. time frame, but quickly turned lower, setting up a low risk short. As you can see from the 1 min. chart, once price broke $11.50, it set off on a parabolic move characterized by tight red candles. As the move progresses, the candles get wider and wider, culminating in capitulation on a huge volume spike.

Following the capitulation, LEH was range bound between $9.00 and $10.50. Eventually, it broke $9.00 on a head fake. Head fakes usually result in fast moves in the opposite direction, so I jumped in long.

I had to leave at 2:00 on personal business, so that was it for me.


[url=][/url]
Posted by Jamie at 9/09/2008 08:54:00 PM 3 comments
Labels: Gapper, Parabolic


Pre-Market
Futures mixed on lower oil and higher USD.

Gapping down: FUL, LEH (investment talks with South Korean bank have ended), TWTC, UNG, RIO, SLW

Gapping Up: Select airlines on lower oil UAUA, AMR,...

[url=][/url]
Posted by Jamie at 9/09/2008 09:22:00 AM 0 comments
Labels: Pre-Market


Monday, September 08, 2008NASDAQ Technical Picture - Gap Fade


Stocks jumped aggressively higher on the open following the Treasury's FNM and FRE bailout news announcement over the weekend. This brought the move off of Friday lows to almost 5% for the S&P and Dow and immediately lead to a healthy dose of profit taking that continued into midday. The Dow and S&P 500 held near the 50% Fib. retracement of the Fri-Mon rally, forming a trading range before a modest move higher in the final hour. The NASDAQ, on the other hand quickly filled the gap, but found support in the 2240 area before retracing 50% towards the ORH. Top performing sectors were led by banking, housing, retail, an insurance. Sectors on the defensive were led by commodity/energy as the USD set a new 11 month high (coal, mining, steel, gold, solar, oil and gas).

Economic calendar: pending home sales and wholesale inventories at 10:00.

Futures modestly lower as Asian markets fall overnight on growth concerns.

[url=][/url]
Posted by Jamie at 9/08/2008 11:20:00 PM 0 comments
Labels: NASDAQ


Gap Fade - Apple Inc. (Public, NASDAQ:AAPL)
If a stock gaps up into an obvious resistance level and starts printing red, it's a good fading opp. AAPL set up perfectly on a break of $164.00.

JOYG was a gap continuation play from last week's earnings gap.

Trading pairs - AAPL and RIMM have been trading in step lately as are JOYG and BUCY.

[url=][/url]
Posted by Jamie at 9/08/2008 04:13:00 PM 4 comments
Labels: Gap_Fade


Newer Posts Older Posts Home
金币:
奖励:
热心:
注册时间:
2006-7-3

回复 使用道具 举报

 楼主| 发表于 2009-3-20 16:13 | 显示全部楼层
Friday, September 05, 2008Pre-Market
Futures lower following jobs data. Global sell off overnight.

Gapping Up: SNDK, UST,

Gapping Down: NOK lowers Q3 outlook - MOT, RIMM, AAPL, QCOM, ERIC, STM ALU in sympathy; select financials MER (cut to sell at Goldman), FNM, FRE, MBI, AIB, DZZ...SID, ABM

[url=][/url]
Posted by Jamie at 9/05/2008 09:08:00 AM 0 comments
Labels: Pre-Market


Thursday, September 04, 2008Weekly Low BO - Ctrip.com Intl Ltd (Public, NASDAQ:CTRP)
I have been periodically trading CTRP from the short side. Following the earnings based run-up in August, I have been looking for another good short opportunity. The weekly chart below shows price range and volume contraction after the week of the earnings release. Given the weak market, I was anticipating a possible BO of the prior weekly low.

Below, the daily chart (left) and the 15min chart (right) show that weekly price pivot (PP) level. This morning price tested that level and then formed a 15min NRIB on that key level. The entry was against the NRIB. The fact that the NRIB formed below the opening range low (ORL) and near the down-sloping 5ema added confidence. The weakness in the overall market helped tremendously. I took a partial on what looked to be capitulation (vertical price move on high volume). I then trailed a stop and decided to hold the remaining position for an overnight trade. Closing at the extreme of the daily range (the low in this case) on heavy volume is a valid reason to hold a trade for potential overnight follow thru.


[url=][/url]
Posted by Jim at 9/04/2008 09:13:00 PM 5 comments
Labels: Capitulation, NRIB, ORL, Pivot Point


NASDAQ Technical Picture - Bears Own It

A gap down on weak data and mixed retail sales followed by a 4th successive day of broad based declines for the NASDAQ. After hours, futures continue to stair step lower. Tomorrow's jobs data will likely add to the volatility. Hearing that more hedge funds are liquidating.

[url=][/url]
Posted by Jamie at 9/04/2008 08:21:00 PM 0 comments
Labels: NASDAQ


Chopfest - Apple Inc. (Public, NASDAQ:AAPL)
Despite the big drubbing, I found the markets choppy and difficult to find good spots. Here are two trades that worked out.


[url=][/url]
Posted by Jamie at 9/04/2008 04:05:00 PM 6 comments
Labels: AAPL


Pre-Market
Futures testing yesterday's lows following initial claims which were higher than expected. Productivity better than consensus. Same store sales is a mixed bag of beats and misses.

Gapping Up: CLNE, SOLR,

Gapping Down: CIEN, HOV, SHPGY, TEX, HIBB, HRB, PNRA

Crude oil inv. at 10:35

[url=][/url]
Posted by Jamie at 9/04/2008 09:18:00 AM 0 comments
Labels: Pre-Market


Wednesday, September 03, 2008NASDAQ Technical Picture - Dumping Tech
Weak global demand for energy and commodities is permeating to technology as the NASDAQ continues to sell-off. The demise of the Ospraie hedge fund is likely spreading fear and other funds are probably busy unloading. S&P strength was courtesy of financials and consumer discretionary

Economic calendar: Initial claims, productivity in pre-market; ISM services at 10:00, and Crude inventories at 10:35. Also ADP employment in pre-market.

[url=][/url]
Posted by Jamie at 9/03/2008 10:05:00 PM 0 comments
Labels: NASDAQ


Gapper Dummy Trade - Joy Global Inc. (Public, NASDAQ:JOYG)
I got a late start to my trading day due to some personal business. The first thing I did when I came in around mid-morning, was check the Trade-Ideas pre-market scans for gappers. JOYG was ripping lower in pre-market due to earnings. At 11:00 - 11:15 both JOYG and BUCY (sympathy play) printed NR7 (TI scan of watch list) on the 15 minute timeframe and that was my cue to get short. Both stocks exceeded the prelim. target (38% Fib. extension of the previous day to the ORL) helped along by lower oil, I suspect.


[url=][/url]
Posted by Jamie at 9/03/2008 04:09:00 PM 4 comments
Labels: Fibonacci, Gapper, NR7


Tuesday, September 02, 2008NASDAQ Technical Picture - Hello Volatility
A huge opening gap quickly turned into fade as oil started to recover from pre-market lows following a less powerful Gustav hurricane than previously feared. Into midday, and as prices completely filled the gap, it appeared as if the market might stabilize and possibly reverse, but shortly after lunch the bears stepped up the pace and volume/volatility accelerated as Friday's supports were taken out.

The above chart of light sweet crude bears watching as prices react to key technical levels. We have just lost the 38% Fib. retracement level and the 200 DMA on a hammer reversal bar. Prices did attempt to rally from the trend line but failed. The next key level if the hammer doesn't follow through is the 50% Fib. retracement level which conveniently lines up with the psychologically significant $100.00 price level. I suspect that the big money is waiting and ready to buy at $100.00 so we should see an important technical bounce.


No Pre-Market post tomorrow.

[url=][/url]
Posted by Jamie at 9/02/2008 10:44:00 PM 0 comments
Labels: NASDAQ


Watch List Trades - Energy Conversion Devices, Inc. (Public, NASDAQ:ENER)
ENER set up a perfect bear flag on weaker oil this morning. I took a partial as price started to retrace and covered the balance as price approached the round $ number $70.


AAPL is a trade from Friday. I had previously mentioned AAPL as a focus list stock at the intraday pivot point $172.00 as significant. Hope you guys had your alerts on. It set up perfectly and my alert warned me that price was in play. I missed the big move today because of a power failure. The power went off some time between 1:15 and 1:30. By the time it came back on and I was up and running again it was almost 2:30 EST and the big moves were in, so I called it a day.

FLS - I've been trading this one daily for a week or so.


CNQ - another oil play, had nice volume on the BO bar, but no follow through.

Gap Scan Trades - DELL and PETM on Friday were both more or less scratches. LOW was released as a buy stop at $26.64 just as power failure occurred. Happily, price never triggered as markets headed south.

[url=][/url]
Posted by Jamie at 9/02/2008 08:16:00 PM 5 comments
Labels: Bearish_Flag, Pivot Point


Pre-Market
Futures sharply higher as oil plunges following a much weaker Hurricane Gustav cat. 2 vs. cat. 4.

Gapping Up: Select airlines and mortgage/financials also AAPL added to focus list at Piper, LOW upgraded to Buy at Goldman, LEH Korea back in the picture.

Gapping Down: Select oil/gas, metals/mining, and Agchem names

[url=][/url]
Posted by Jamie at 9/02/2008 09:08:00 AM 2 comments
Labels: Pre-Market


Newer Posts Older Posts Home
金币:
奖励:
热心:
注册时间:
2006-7-3

回复 使用道具 举报

 楼主| 发表于 2009-3-20 16:13 | 显示全部楼层
Friday, August 29, 2008Pre-Market
Futures trading lower this morning with the NASDAQ pacing the way following disappointing earnings from DELL last night. Oil spiking as storm approaches and dollar modestly weaker.

Gapping Down: DELL, ABK, BPOP, SIGM, FNM, KLAC, TOL

[url=][/url]
Posted by Jamie at 8/29/2008 09:05:00 AM 5 comments
Labels: Pre-Market


Thursday, August 28, 2008NASDAQ Technical Picture - Follow Through

Solid follow through as the broader averages led tech on day two of the bounce. A better than expected GDP report and news of MBI's decision to reinsure muni-bonds helped propel the markets higher along with big declines in oil.

After hours DELL, MRVL, and SIGM reported disappointing earnings and the NQ futures gave back half of the days gains.

[url=][/url]
Posted by Jamie at 8/28/2008 11:37:00 PM 0 comments
Labels: NASDAQ


Wide Gap (3 Pivot Point Base & Break) - MBIA Inc. (Public, NYSE:MBI)
The first chart is the 15 min. time frame for MBI, a wide gapper with high pre-market volume which I traded today.

The second chart is the 1 minute time frame which highlights the key criteria to look for when scoping out the wide gap 3 pivot point base and break.

I developed this setup to trade wide, high volume gappers because they always seem to break long before the 5 period EMA catches up to price on the 15 minute time frame. Since proximity between price and the 5 ema is a criteria for a solid entry point on the 15 minute time frame, I was never sure of the correct timing and often let these setups pass me by. The last two charts show how far the 5 ema was lagging after the BO and just prior to the BO. In fact on this trade, price and the 5 ema never met until after the target (38% Fib. extension of the previous day low to the ORH) was achieved. A wide BO bar that closes strong helps pull the 5 ema closer to price.

The attributes I look for on the 1 minute chart are:

  • 3 pivots near the OR (high/low for shorts) define the base, ideally the pivots form near a whole or half dollar level;
  • price prints higher lows (lower highs for shorts) after each pivot;
  • tight price/volume contraction just before the BO.
  • 50 SMA breaks in close proximity to shorter MAs prior to or at BO.
The 15 minute opening range is key as in any gapper trade. A solid candlestick in the direction of the gap is the first observation to make. High volume is also an important success factor.


Related posts: AMLN PCLN VMW

[url=][/url]
Posted by Jamie at 8/28/2008 05:33:00 PM 9 comments
Labels: 3 PP Base, Fibonacci, Gapper, Volume


Pre-Market
Revised GDP of 3.3% vs. 2.7% consensus is giving a big boost to the futures.

Gapping Up: ENER, MBI, TIF, MW, VCLK, JAS, SEED, BT (upgraded to Buy at Goldman) select gold and metals on higher spot prices ABX... select financials on MBI news WB, C, AIB, MER, BAC, FRE, FNM

Gapping Down: CHU, GA, FCEL, WSM, ALDN, GILD

[url=][/url]
Posted by Jamie at 8/28/2008 08:54:00 AM 0 comments
Labels: Pre-Market


Wednesday, August 27, 2008NASDAQ Technical Picture - Bounce from Support


This is the morning after bounce - it seems, from memory that we bounce after FED meetings. Let's see if we can hold intraday support and build some momentum. We have to do it tomorrow because Friday is likely to be a low volume day ahead of the long weekend.


Trade Idea for tomorrow - BCSI $19.00 after several days of gap consolidation. The gap is a flag pole and the consolidation is the flag. On a measured move, we can expect $2.00

[url=][/url]
Posted by Jamie at 8/27/2008 11:05:00 PM 3 comments
Labels: NASDAQ
金币:
奖励:
热心:
注册时间:
2006-7-3

回复 使用道具 举报

 楼主| 发表于 2009-3-20 16:14 | 显示全部楼层
Gapper Dummy Trade - Amylin Pharmaceuticals, Inc. (Public, NASDAQ:AMLN)
AMLN was a gapper short from a 3 pivot point base on the 1 minute time frame. Unfortunately, because of the distance from the down sloping 5 ema on the 15 min., it started to form a bullish base shortly after the first leg down, so I took a partial just in case. I closed the balance as price approached the 38% Fib. extension of the previous day high to the ORL as per Trader-X methodology.


AMGN set up a low risk short in the pivot area. I was targeting $22.00 but took a stop as price formed a bullish base on the 1 minute chart below. Since it didn't get close enough to the target, I wasn't expecting such a powerful retracement. In retrospect, the capitulation volume on the last leg down, foreshadowed the end of the move.


FLS was a continuation play off of yesterday's reversal. There's NR7 in play on 15 min. consolidation and a 3 PP base on lower time frame.


[url=][/url]
Posted by Jamie at 8/27/2008 03:55:00 PM 14 comments
Labels: 3 PP Base, Capitulation, Fibonacci, Gapper


Pre-Market
Futures trading up modestly due to strong durable goods orders.

Gapping Up: AFL, CHL select financials FRE, MER LEH, FNA select Oil BP, HK, SU, OXY, DVN....


Gapping Down: SOLF. SOLR, solar names following lower AMLN, DLTR Airlines on higher oil CAL, UAUA, AMR, LCC...

[url=][/url]
Posted by Jamie at 8/27/2008 09:01:00 AM 0 comments
Labels: Pre-Market


Tuesday, August 26, 2008Gapper Dummy Trade - Sanderson Farms, Inc. (Public, NASDAQ:SAFM)
SAFM gapped wide on the open and immediately filled the gap. The key to the setup was a lower high , plus the fact that there was very little support beyond the 3rd and 4th bar lows. As you can see on the 5 minute chart below, once support was taken out, it was a fast swoon down to the ORL.

FLS showed up on my NR7 scan of the usual suspects. After a multi pt. move lower, FLS carved out a V bottom setting up a long entry. Capitulation at the round number $125.00, followed by a V bottom (hammer reversal bar on 15 min.) and huge volume on the reversal. Sweet.


[url=][/url]
Posted by Jamie at 8/26/2008 08:53:00 PM 11 comments
Labels: Capitulation, Gapper, NR7, Support_Resistance, V_Bottom


Monday, August 25, 2008Watch List Target Trade - Apple Inc. (Public, NASDAQ:AAPL)
AAPL was a target trade to $172.00 which I pointed out last week as a significant pivot point. I took a partial at support and closed the second half before the target was reached. The target was eventually reached and I'll be watching for the next test of $172.00 as a potential breakdown.

FWLT was a trend line breach. Ran into trouble but managed to get back in.

No pre-market post tomorrow.

[url=][/url]
Posted by Jamie at 8/25/2008 11:34:00 PM 3 comments
Labels: target_trade, Trendline


Pre-Market
Gapping Up: ERTS, LDK, SOLF, ENER

Gapping Down: FRE, FNM, LEH, AIG, GILT, APWR

Futures trading slightly lower as oil is ticking modestly higher following Friday's plunge. Korea Development Bank is taking cautious approach to potential LEH acquisition as per Financial Times.

[url=][/url]
Posted by Jamie at 8/25/2008 08:02:00 AM 0 comments
Labels: Pre-Market


Newer Posts Older Posts Home
金币:
奖励:
热心:
注册时间:
2006-7-3

回复 使用道具 举报

 楼主| 发表于 2009-3-20 16:15 | 显示全部楼层
Friday, August 22, 2008Gapper Dummy Trade - Nordson Corporation (Public, NASDAQ:NDSN)
Price/volume contraction ahead of expansion.

[url=][/url]
Posted by Jamie at 8/22/2008 04:00:00 PM 0 comments
Labels: Gapper, NRB


Pre-Market
Futures pointing to a higher open as oil and gold dip. LEH sharply higher as Reuters reports they are target of potential acquisition.

Gapping Up: BCSI, CSUN, FL Select financials - WB, LEH - Reuters reporting that Korea Development Bank saying buying LEH a possibility, MER, UBS, MBI; Select airlines on lower oil UAUA, CAL.... M&A - ALO; Select solars trading higher on CSUN earnings and YGE contract SPWR, STP, YGE, JASO, SOL...

Gapping Down: NDSN, HIBB, HK, LVS, DRYS, VRGY, PDO, DVN, SU; Select Gold stocks ABX, AUY, AEM, KGC, GOLD

[url=][/url]
Posted by Jamie at 8/22/2008 07:20:00 AM 0 comments
Labels: Pre-Market


Thursday, August 21, 2008NASDAQ Technical Picture - Technical Breach


IBD is changing its market outlook from "confirmed rally" to "rally is struggling". Volume continues to decline primarily due to vacation season. The energy rally continued for a third straight session as oil gapped up and held strong for the entire day. As long as energy continues to rally the broad markets will be in defensive mode. No economic data tomorrow.

AAPL is on the focus list at $172.00.


[url=][/url]
Posted by Jamie at 8/21/2008 10:04:00 PM 0 comments
Labels: NASDAQ


Dummy Gapper Trade - salesforce.com, inc. (Public, NYSE:CRM)
CRM was a gapper narrow range B&B, but after taking a partial I was stopped out as detailed on the 1 minute chart below. CRM went back to retest the base and immediately reversed so I got back in. The full Fib. extension from the previous day high to the ORL was reached EOD.


FMCN, was B&B daily long as per HCPG trading list. I guess I wasn't watching this one closely enough, because by the time I got back to it , my profit had all but disappeared after the tweezer top reversal and I closed the position. Waited so long for this break and was very disappointed that it couldn't do better, but that's the way it goes.

RIMM - missed the early move off of the trend line, but caught the second half as price lifted from the retest of former resistance.

[url=][/url]
Posted by Jamie at 8/21/2008 08:17:00 PM 6 comments
Labels: Fibonacci, Gapper, Support_Resistance, Tweezer_Top


Pre-Market
Futures indicate a lower open: higher crude, geopolitical tensions, lower dollar.

Gapping Up:
DKS, LTD, PLCE, SLW, PCX; Select metals/mining HL, ABX, AEM...

Gapping Down: HOTT, JDSU, CRM, SNPS, GME, FRO, Select financials LEH, MBI, IBN, WB, FRE, FNM..., Select airlines on higher oil CAL, UAUA, DAL, LCC ...

Upgrades: FCL, ACI upgraded to Buy at UBS

[url=][/url]
Posted by Jamie at 8/21/2008 08:56:00 AM 0 comments
Labels: Pre-Market
金币:
奖励:
热心:
注册时间:
2006-7-3

回复 使用道具 举报

 楼主| 发表于 2009-3-20 16:15 | 显示全部楼层
Wednesday, August 20, 2008NASDAQ Technical Picture - Consolidation Day
The broad markets rallied on a higher than expected crude inventory build, but that was relatively short lived as the oil/energy corrective action gave way to higher highs in the afternoon. Oil/energy has rallied for three straight days, with a few of the stronger names breaking out of their bases, or least regaining the 200 DMA. Solars were on fire today. I suspect energy will pause for breather and perhaps the broader markets can move up a bit here. Initial Claims tomorrow in pre-market.

[url=][/url]
Posted by Jamie at 8/20/2008 11:37:00 PM 0 comments
Labels: NASDAQ


Gapper Dummy Trade - Analog Devices (Public, NYSE:ADI)
ADI was a gapper short that I spotted on my TI scan - consolidation BO (two days) with high relative volume. The 15 min. chart is above and the 1 min. below. The point I want to make on the 1 minute, is when price tested the morning swing low, it carved out a mini C&H and reversed sharply. I took a partial here. Technically, we should trail a stop above previous 15 min. bar and tighten the stop only if the next bar prints a lower low. So that means when price consolidates or reverses ( ie. next 15 min. bar doesn't print a new low), you're stuck with a prayer. That's why I took a partial after the small gain. Those C&H patterns are powerful. As you can see from the chart, it was a full hour before price printed a new low.

When price stalled at daily support I closed the trade. With less than an hour to go, I didn't want to risk 20 cents to make 25. But, the 38% Fib. extension of the previous day high to the ORL was met and exceeded for those who were patient.


LEH was a NR B&B. This stock has been pummelled and looks ripe for reversal after today's double bottom.

It was do or die for RIMM today. After testing $125 support at the base of the daily trend line, it needed to make a move. The gap up was a good first clue and then it was just a matter of waiting for a tradable base.

CNQ is posted here for my memory. I shorted the build in crude inventories after it bounced from the initial reaction low, and later went long on a 3 PP B&B (NRIB on 15 min.). I read on Briefing.com that Warren Buffett and Bill Gates were spotted in Alberta checking out CNQ's Horizon Oil Sands development.

[url=][/url]
Posted by Jamie at 8/20/2008 09:56:00 PM 2 comments
Labels: 3 PP Base, Base and Break, Fibonacci, Gapper


Pre-Market
Futures are trading modestly higher on better than expected HPQ earnings, but they are well off their highs as Sept. crude, which expires today, is rallying despite a strong dollar.

Downgrades - KSS and M at Goldman; Goldman also cut its Q3 estimates for brokers C, JPM, LEH, MER and MS.

Gapping Up: STP, OTEX, HPQ, PAY, TWI, X

Gapping Down: NVTL, MBI; Select airlines modestly lower on higher crude NWA, UAUA, CAL, LCC; Ex dividend BT, BCS

Crude Inventories at 10:35

[url=][/url]
Posted by Jamie at 8/20/2008 09:15:00 AM 0 comments
Labels: Pre-Market


NASDAQ Technical Picture - Technical Damage on Higher Volume


Disappointing PPI data set the stage for a third consecutive day of selling, this time on higher volume as the S&P extended its break of the rising trend line off of the July lows. The NASDAQ is still above its trend line, but the bullish flag pattern is clearly broken and today's extension of yesterday's wide range sell off, took place on higher volume. Finally, the overbought posture has been neutralized. I would expect a bounce in the wake of 2-3 day declines, but we'll wait and see if we get anymore market moving news in pre-market and how the oil/energy sector reacts to crude inventories at 10:35. These last two sessions have seen strength in beaten down energy/metals sectors. Laggards were led by airlines, casinos, financials, retail and semis.

[url=][/url]
Posted by Jamie at 8/20/2008 12:13:00 AM 0 comments
Labels: NASDAQ, SPX


Tuesday, August 19, 2008Short Side - Ctrip.com Intl Ltd (Public, NASDAQ:CTRP)
This short trade in CTRP was a high probability intra-day setup based on a Fibonacci zone from a longer time period. CTRP made a strong move up at the end of last week following an earnings announcement. Today, CTRP violated the Fib 50% retracement of that move and setup a nice low-risk short entry against that 50% level. Often, a stock that can not hold the 38-50% retracement level of an earning move like this will end up giving back the entire move and sometimes more.
LVS was a gap down that setup a bear flag with converging lines. The action was somewhat sluggish (lack of big volume), but was good for a retest of the morning low.


Posted by Jim at 8/19/2008 09:36:00 PM 4 comments
Labels: Bearish_Flag, Fibonacci

Newer Posts Older Posts Home
金币:
奖励:
热心:
注册时间:
2006-7-3

回复 使用道具 举报

 楼主| 发表于 2009-3-20 16:17 | 显示全部楼层
Tuesday, August 19, 2008Inside Bars - Canadian Natural Resource Ltd (USA) (Public, NYSE:CNQ)
After two narrow range days, CNQ tested support in the OR and carved out 3 IBs on declining volume - contraction before expansion on the 15 min. Using multiple time frames to time the entry, I put in a trend line using the ray line tool in Esignal which extends forever. I don't want to stay in the trade if the trend line is breached on a closing basis - refer to 1 min. chart below.

The entry sets up at P so it looks almost perfect. Price consolidates at P with a series of higher lows within the initial trend line. After breaking out, price makes a vertical move higher on accelerating volume = expansion. At first I was thinking flag pole, but the tweezer top foreshadows a reversal, so I take a partial to lock in some profits. The trend line should hold as support, but I draw in my Fib. retacement lines just in case. The retracement takes place on declining volume and stops at the 50% retacement level.

Once price makes a higher high, I start tightening the stop. Eventually I have to draw in an accelerated trend line because price moves too far, too fast. Once the accelerated trend line is breached, you can exit the second half. I missed it and ended up staying in the trade until the original trend line was breached after one final test of resistance at $78.50


Once LEH broke its early trend line and closed below S2, it was safe to short. LEH is now a $14.00 stock so half $ levels are important in addition to whole $ levels so if price stalls at these levels, book some profits.


[url=][/url]
Posted by Jamie at 8/19/2008 08:48:00 PM 1 comments
Labels: Inside Bars, Trendline, Tweezer_Top


Pre-Market
S&P futures trading below yesterday's lows and NASDAQ futures testing yesterday's lows after some weak PPI data.

Gapping Up: WCG, XFML, GFIG

Gapping Down: SOL, ABMD, AU, AUY, ABX, GU, SPLS, JOSB, HAS, Select casinos -LVS, MGM, WYNN; continued weakness in some financial names LEH, AIB, WB...

[url=][/url]
Posted by Jamie at 8/19/2008 08:45:00 AM 4 comments
Labels: Pre-Market


Monday, August 18, 2008NASDAQ Technical Picture - Bullish Flag Still in Play

The NASDAQ is still well positioned technically as the flag pattern continues to consolidate on declining volume. This is helping work off the overbought posture. The S&P, on the other hand, is testing the trend line following a lower high from late last week. Weakness in financials FRE, FNM, and LEH set off a broad based decline. Let's see if buyers step in to keep the trend line intact.


[url=][/url]
Posted by Jamie at 8/18/2008 10:16:00 PM 0 comments
Labels: NASDAQ


Q&A
T writes -
I’ve been following your blog for quite some time and I must say it’s great … next to TraderX’s blog (which doesn’t run anymore unfortunately) it’s the best out there. Keep up the great work.


Q. Nevertheless, I have some questions that I wanted to ask you regarding your trading style. How do you judge what stocks you play during the day. Do you have a general watchlist of momentum stocks, do you screen for stocks every morning before the market opens (like TraderX with the gappers), what is it?
A. I prefer to trade NASDAQ stocks because computerized trading is more orderly and level II allows for greater visibility of market depth. I usually have a short focus list of stocks to watch from my own watch list and from HighChartPatterns newsletter of B&B setups. I screen for gappers every morning using several sources but primarily Trade-Ideas scanner, IB scans, and Briefing.com.


Q. What time frame do you mainly trade? What is your favorite setup? And how do you judge when to take your partial and when to get out with the rest? Last question ;-) … how do you judge where you put your stop loss and do you trail it?


A. I use four time frames daily, 15 min. 5 (3) and 1 min. - and hopefully everything gels. I prefer the 15 min. time frame which generally allows for more room to run. If I see a nice setup on the 15 min. I still want to make sure it fits with the higher and lower time frames. I manage the entry on the lowest time frame because that is the most critical part of the trade. My favorite setup is base & break which comes in many forms including a gapper momentum play that sets up with NRIB (NR7) or C&H or 3 PP B&B. For chart patterns I usually have a measured move target of 100%, but take a partial after 3 consecutive wide bars in my direction. Otherwise, I look for support/resistance levels to partial out. For gappers, I will exit in full the standard 38% Fib. extension (Trader-X style) if I get into a stock that has a wide spread or stalls midway to the initial target (AMED from Friday is a good example). If the gapper moves quickly out of the base with good volume and a tight bid and ask, I will partial out in the usual manner. Normally, I place my initial stop at previous bar high/low on 15 minute chart, but if price stalls on the BO and prints a reversal candle right out of the gate, I tighten the leash. See example of PG from Friday.


Thanks a lot for sharing your expertise!


[url=][/url]
Posted by Jamie at 8/18/2008 07:57:00 PM 4 comments
Labels: 3 PP Base, Base and Break, Mailbag


Pre-Market
Futures trading modestly higher as oil pulls back from overnight highs. FNM and FRE covered negatively in Barrons are trading 7% lower in pre-market.

Gapping Up: Select solar stocks trading modestly higher SOLF, SOL, TSL, LDK, JASO; LOW, UB, FMCN


Gapping Down: FRE, FMN, HSY, PWRD, TTWO

[url=][/url]
Posted by Jamie at 8/18/2008 09:02:00 AM 0 comments
Labels: Pre-Market


Thursday, August 14, 2008NASDAQ Technical Picture - Flag Pattern Forming

The flag formation on declining volume is intact, but we are still overbought. The trend line held as support on the open as higher than expected inflation led to a shaky start. A drop in oil prices later in the session kept the markets near intraday highs in mostly sideways action.

ADSK gapping higher on earnings.

Economic calendar: Capacity utilization, Industrial production at 9:15 and Michigan sentiment at 10:00.

There might not be a pre-market post again tomorrow as I have more errands to run in the early a.m.

[url=][/url]
Posted by Jamie at 8/14/2008 10:28:00 PM 0 comments
Labels: NASDAQ


Round Trip - Amgen, Inc. (Public, NASDAQ:AMGN)
The first chart is daily chart of AMGN, which shows why it is having such a hard time breaking out of the $64-65.00 range. There are lots of pivots dating back to 2006 which are getting in the way of a smooth BO. Last week it failed at $64.00, but has continued basing in a tight range so I have kept it on my focus list. Today, it finally broke $64.00 and was setting up a nice C&H pattern at $65.00. It was no surprise that the C&H pattern failed.

As you can see from the 5 minute chart below. I caught the break of the opening range for a fast vertical move. I held a partial for a sharp retracement and series of higher lows. I tightened the stop as the waves became shallower. Then just like, déjà vu, it failed at $65.00 and I was stopped out. The next trade was short the failure and that brought us all the way back home - round trip.

AEM has rallied 10 pts. from its bottom in just a few days. Today it set up a 3 pivot base & break short after forming a big top. I was expecting a bigger move, but I'll take what I can.

A false BO and small loss, was the trigger for a nice retracement on FWLT.


Also, caught a quick move in RIMM - break of 15 min. ORH. The so called H&S top didn't pan out obviously.

[url=][/url]
Posted by Jamie at 8/14/2008 08:16:00 PM 0 comments
Labels: 3 PP Base, Base and Break, Cup-and-Handle, Failure


Wednesday, August 13, 2008NASDAQ Technical Picture - Low Volume Consolidation

Energy and commodities finally caught a bid today - big moves in coal, steel, gold, metals, and oil. That plus weak financials, airlines, and retail, put pressure on the the broader markets. The NASDAQ held up fairly well and seems to be carving out a bullish flag on declining volume. Still, we need to work off this overbought posture a bit more before we can move higher.

Economic calendar: Core CPI and initial claims in pre-market.

The next chart is a 15 minute chart of RIMM. I see a H&S top. The LS is a little small, but the volume pattern is perfect - lots of momentum on the LS and Head and very lame volume on this afternoon's rally leading to a quick sell off. As you can see from the chart the trend line is not far below the BO point, so I would be cautious as price approaches the trend line if this pattern does play out. On a measured move it looks like 10 points, but I won't be greedy.


[url=][/url]
Posted by Jamie at 8/13/2008 10:00:00 PM 2 comments
Labels: Head_and_Shoulders, NASDAQ


Consolidation Breakout - DryShips Inc. (Public, NASDAQ:DRYS)
The first chart of DRYS is the daily time frame which shows that we had been consolidating in a tight range on the lower trendline of the symmetrical triangle for quite a while. Also note that today's consolidation BO took place on respectable volume.

The second chart is a 15 min. time frame with support/resistance lines. It's cool how today's high rallied to the extension of the ray from the short last week. I was reviewing the chart daily, but didn't really want to trade it unless it penetrated either the S/R lines.

So today was the day, and the trade set up a perfect dummy B&B.


[url=][/url]
Posted by Jamie at 8/13/2008 04:09:00 PM 7 comments
Labels: Base and Break, Consolidation_Breakout, Dummy, Symmetrical_Triangle


Pre-Market


Gapping Up:
NVDA, CREE, TOL, MHGC, modest upticks in metals GG, ABX, AUY, HMY;

Gapping Down: TWB, DE, CSIQ, MDRX, WCG, LIZ, TSM, NOK, CCL, PRGO, LFC modest down ticks in broker/banking WB, LEH, UBS

Crude Inventories at 10:35

Futures indicate modestly lower open.

[url=][/url]
Posted by Jamie at 8/13/2008 09:05:00 AM 0 comments
Labels: Pre-Market


Newer Posts Older Posts Home
金币:
奖励:
热心:
注册时间:
2006-7-3

回复 使用道具 举报

 楼主| 发表于 2009-3-20 16:18 | 显示全部楼层
Tuesday, August 12, 2008NASDAQ Technical Picture - Snooze Fest - Low Volume Inside Day
The markets opened on a slightly negative note following some unfavorable news items from JPM, MS, and UBS, and a number of downgrades in the broker banking sector. The NASDAQ didn't do too much except chop around most of the session, resulting in an inside bar.

In light of the recent run, and the overbought posture, I'd like to see more retracement.

Maybe the economic data will provide a catalyst - Import/Export prices; retail sales in pre-market; Business inventories at 10:00; Crude inventories at 10:35.

NVDA and CREE trading up in AH on earnings.


This is a 15 min. chart of the S&P Emini futures. I waited all day for a short to set up. It was a quick move to the next support level (blue line) after much consolidation. It's important to review intraday charts the night before and examine potential trigger points.

How to draw a proper trendline:

1. Start from the lowest low;
2. Include shadows ie. total prices not just closing prices;
3. That said, the point from which price carves out its highest high, must touch the trendline. In the ES chart above, Friday's ORL was the point from which, the market moved the highest, so I had to redraw the trendline to touch that point. In so doing, we notice some minor trendline breaches, but we ignore them.

[url=][/url]
Posted by Jamie at 8/12/2008 09:21:00 PM 2 comments
Labels: NASDAQ, Trendline


Shorting Weakness - Lehman Brothers Holdings Inc. (Public, NYSE:LEH)
Last week I mentioned this symmetrical triangle on the LEH daily chart. This morning's weakness in the broker sector pre-market, was the perfect catalyst for a BO.

This trade got off to a very slow start compared to UBS, JPM and MS, the news makers. Over time, it became obvious that the slowness was due to the stair step pattern of decent which involves a lot of NR consolidation as each step develops along the way.


NDAQ caught my eye last night as I was doing my EOD review. The trend line breach after such a bullish run, could signal a pullback. It carved out a clean base & break short.


RIMM triggered a short as the markets broke down in the latter part of the session.

I was watching the Emini NASDAQ futures all day for a trend line break, but the action was so sloppy that I ended up shorting the S&P futures instead.

[url=][/url]
Posted by Jamie at 8/12/2008 04:28:00 PM 2 comments
Labels: Base and Break, Stair_step, Symmetrical_Triangle


Pre-Market
Futures suggest a flat open as a drop in oil is offset somewhat by negative news out of the financial sector. UBS (UBS) reported its fourth straight quarterly loss and is separating its business divisions which could imply certain units are up for sale. JPMorgan (JPM) disclosed in a regulatory filing that trading conditions have deteriorated compared to Q2, noting that spreads on mortgage-backed securities have widened, causing bigger losses. Morgan Stanley wants to repurchase $4.5 billion in auction rate securities, but New York Attorney General said the move is "too little, too late," according to the wires.

Gapping Up: FLR, FOSL, KG, SQNM, UAUA, LDK on earnings and upgrade, select solar names in sympathy (CSIQ, SOLF, YGE)

Gapping Down: SD, JASO, TRAK, ZOLT, Slight down ticks in broker sector JPM, GS, MER, LEH

[url=][/url]
Posted by Jamie at 8/12/2008 09:07:00 AM 0 comments
Labels: Pre-Market


Monday, August 11, 2008NASDAQ Technical Picture - Testing 200 DMA
I see a topping candle as we test the 200 DMA, so tomorrow, I'll be looking for a test of trend line support. We came close to tagging it late in today's session. Also note that the afternoon pullback was on heavy volume.


[url=][/url]
Posted by Jamie at 8/11/2008 09:57:00 PM 0 comments
Labels: NASDAQ


Inter-Market Relationships - Barrick Gold Corporation (USA) (Public, NYSE:ABX)
A strong dollar means weak gold. Take advantage of inter-market relationships to find trading opportunities. ABX from the WL set up a low risk short today. Friday I shorted GOLD from the pre-market gapper list.

Anarco had a great day today. Check out his trades here.

[url=][/url]
Posted by Jamie at 8/11/2008 04:15:00 PM 2 comments
Labels: NBR


Pre-Market
Futures indicate a flat open for the markets following Friday's rally. Crude oil had been trading higher on concerns that the Russia Georgia conflict could disrupt oil suppies from Caspian sea, but has since eroded. Little news on corporate front as earnings season winds downs. $USD strength against Euro again this morning.

Amtech out with positive comments on RIMM and FSLR.

Gapping Up: ENER (upgraded to Buy at UBS), FEED, CPN, DBD, Q (upgradeed to Buy at Citigroup), NRG, NAT

Gapping Down: Select gold names ticking slightly lower AEM, KGC; CRME

[url=][/url]
Posted by Jamie at 8/11/2008 08:44:00 AM 0 comments
Labels: Pre-Market


Sunday, August 10, 2008NASDAQ Technical Picture - Dollar Stength Propels Markets Higher

Higher $USD sinks oil and Gold. However, many oil stocks are holding recent range supports.


The major US markets gained an average 2.5% on Friday to end a bullish week. But despite the NASDAQ's WRB, volume was on par with Thursday so not an accumulation day. The NASDAQ is still in the overbought zone and volatility has pulled back to its base. Friday's leading sectors included Tires and Rubber +11%, Wireless Services +8%, Home Improvement Retail +8%; Casinos and Gaming +8%; Apparel and Accessories +7%. The laggards were topped by Oil & gas, gold, coal, and steel.

IBD reports that its IBD 100, which tracks the market's leading stocks, slid 4% on the week because it is heavily weighted with oil/energy and AgChem names. Sector rotation is playing out and the 4 letter symbols are clearly outperforming the former leaders in oil/energy, commodities, and metals. The weekly winners include IIVI, AFAM, CNQR, CMED, RIMM, SYNA, BMI, MPWR, ARO, VAR. The losers from the same IBD 100 are TITN, MEE, ENS, PCLN, TTES, CF, SNHY, CMP, CFX, ATW.

No economic data tomorrow.

[url=][/url]
Posted by Jamie at 8/10/2008 08:58:00 PM 0 comments
Labels: NASDAQ


Friday, August 08, 2008Pre-Market
Gapping Up:
IBN, SAPE, BECN, DECK, SNY, FSYS; Select airlines on lower oil UAUA, CAL, AMR;

Gapping Down: BP, ABB, NOK, PRX, SAP, KNOT, FNM, CCOI, HANS, NCTY; Select gold stocks HMY, GOLD, GFI, KGC, AUY, AU, ABX;

Econ. Data - Wholesale inventories at 10:00; Q2 Productivity came in at a lower than expected 2.2% vs. 2.5%, but unit labor costs came in slightly lower than expected (1.3% vs. 1.4%).

Futures indicate a slightly lower open. This morning we have lower oil and a strong dollar vs. euro and pound. FNM earnings disappoint.


[url=][/url]
Posted by Jamie at 8/08/2008 08:36:00 AM 0 comments
Labels: Pre-Market


NASDAQ Technical Picture - Tweezer Top


Yesterday I said look for signs of profit taking after the two day thrust. This morning we gapped down on weak retail sales, AIG, higher pre-market oil, and higher initial claims. After a lot of backing and filling, the NASDAQ retested yesterday's highs, followed by an afternoon of profit taking.

The SOX was ripping this morning - nice moves in INTC and SNDK on my WL. But a lot was given back in the afternoon. Also noticed that biotechs all round, not just AMGN, sold off big in the last 30 minutes of trade. In the broader market, financials paced the way lower. LEH has carved out a symmetrical triangle and I expect that it will be a continuation pattern which could BO any day now.

The NASDAQ printed a bearish tweezer top reversal pattern and just closed under the 50 DMA. The tweezer top is a minor candlestick reversal pattern but could foreshadow further weakness.


[url=][/url]
Posted by Jamie at 8/08/2008 12:06:00 AM 0 comments
Labels: NASDAQ


Thursday, August 07, 2008Gapper Inverted H&S - DryShips Inc. (Public, NASDAQ:DRYS)
DRYS gapped down and carved out a perfect inverted head & shoulders with sloping neckline. I noticed that GNK and TBSI were ripping lower on my TI scanner so I decided to look at DRYS for similar weakness. Took a partial at S1 and held the rest for a full 100% Fib. extension from the top of the head to the BO point.

AMGN was a HCPG pick for a base break at $64.00. I took an early entry based on a mini B&B and NRIB on the 5 minute time frame. I added to my position on the actual BO. As you can see from the chart, the BO failed and the trade was stopped out. I was waiting for the failure to set up a bearish flag, but price just meandered and eventually retested the reaction swing highs. Still it couldn't get any traction and eventually pulled back. As it traded sideways in a narrow range just under the BO level, it carved out a 3PP base, setting up a low risk short. I had no idea that it would crater to such an extent, but was very happy that I had kept coming back to it. Remember that failures can lead to fast moves in the opposite direction.

[url=][/url]
Posted by Jamie at 8/07/2008 09:47:00 PM 13 comments
Labels: Failure, Fibonacci, Gapper, Head_and_Shoulders


Newer Posts Older Posts Home
金币:
奖励:
热心:
注册时间:
2006-7-3

回复 使用道具 举报

 楼主| 发表于 2009-3-20 16:19 | 显示全部楼层
Thursday, August 07, 2008Pre-Market
Gapping Up: TRLG, CAR, UBS, EGLE, JCP, ENG, PRXL, LINE

Gapping Down: AIG (big earnings miss $1.14), VRSN, STV, ACOR, CTRN; Select airlines on higher oil CAL, UAUA, LCC; ACH, PLCE, KG, MLM, WMT, SINA, CCL, AEG, ANF

Futures continue to weaken as we get closer to the open - on higher oil and weak same stores sales data. Also AIG earnings.

Econ Data - Pending Home Sales for June 10:00

[url=][/url]
Posted by Jamie at 8/07/2008 07:15:00 AM 0 comments
Labels: Pre-Market


Wednesday, August 06, 2008The Raconteurs "Steady, As She Goes"


Jack White - prolific and great. In 2005, White and his friend Brendan Benson got together and wrote "Steady, As She Goes" the first single of their new band—The Raconteurs, with Patrick Keeler and Jack Lawrence of the Greenhornes. New CD also very good IMO.

[url=][/url]
Posted by Jamie at 8/06/2008 09:59:00 PM 0 comments
Labels: Entertainment


NASDAQ Technical Picture - Everybody Wins


The markets started off on the defensive except for tech which was bullish following CSCO earnings last night. Oil and energy surged off of the open ahead of the inventory data. Despite weak data, energy held its gains by the end of the session. As you can see from the above charts, technology broke out of its base today and cleared the 50 DMA. The only caveat is the declining volume and that is a red flag particularly obvious on the QQQQs. The broader averages did not break out, but they are hugging the base. So today everybody wins, oil/energy were leaders in strength along with technology.

I'm seeing a few bullish morning star patterns on some the oil names on my WL. Coal was a big leader today (ACI bounced off of support as mentioned last night- a nice early trade for me today). All this to say that if energy stages a bounce here, the markets could see a pullback. Anyway, watch for signs of profit taking tomorrow after this two day thrust.

Watch List Update:

AKAM looks weak following last week's gap down. If it fails at the gap day low, target $20.00. My near term target is $15.00. If it catches a bid, former support is now resistance so you can target trade to that level.

FDG - Bull flag
V- Bear flag
CNQ, FWLT - Doji morning star reversal pattern


Posted by Jamie at 8/06/2008 08:55:00 PM 0 comments
Labels: NASDAQ

Gapper B&B - priceline.com Incorporated (Public, NASDAQ:PCLN)
This is a zoomed in view of the early action (1 minute time frame) on PCLN, an earnings gap (thanks to José for the zooming tip). I was hoping this would trade sideways a little longer because the 50 SMA was still very far away as price printed the third pivot into the base. The next two bars were narrow, the second of which was NR7, so I knew it was going to BO. I took the trade knowing the premature BO would likely not reach my target of $95.00 from the daily support.

Characteristics of this type of setup:

  • 3 pivot point base;
  • Lower highs off each pivot;
  • Tight price/volume contraction just before the BO. Sometimes this last part occurs just above the base ie. mini base within the bigger B&B setup.
  • If all of the MAs are in close alignment just above price, the setup is A+. PCLN did not meet this last requirement but still good for a fast trade.

I took half off as soon as price took out the previous bar high, so trail a stop two pennies above the previous completed bar. After that PCLN, formed a solid 2 PP base and I tightened my stop on the balance.

Keep PCLN on the WL for future weakness if it fails at $95.00. Today was a high volume gap and I don't think even Captain Kirk can save it now.

PACR is a good example of a bear flag right out of the gate. I missed the initial trade, but did manage another fast trade when it carved out 3 NRIBs with all of the MAs in perfect formation for a breakdown.

FWLT, another gapper, set up a 3PP base later in the session. I waited for price to consolidate the initial thrust. Turned into a big winner with a scalp trade into the close to sweeten the pot.


[url=][/url]
Posted by Jamie at 8/06/2008 06:59:00 PM 8 comments
Labels: 3 PP Base
金币:
奖励:
热心:
注册时间:
2006-7-3

回复 使用道具 举报

 楼主| 发表于 2009-3-20 16:20 | 显示全部楼层
Pre-Market
Futures mixed with NQ outperforming due to CSCO beat yesterday AH.

Gapping Up: CSCO, NDAQ, MYL, RL, WMS, ONNN

Gapping Down: HCP, MFLX, LAMR, BMRN, FRE, FNM, WFMI, S, PCLN

Crude Inventories at 10:35

[url=][/url]
Posted by Jamie at 8/06/2008 08:58:00 AM 0 comments
Labels: Pre-Market


Tuesday, August 05, 2008NASDAQ Technical Picture - Solid Reversal Day


Solid, wide range reversal day, but volume was disappointing (especially notable on the QQQQ). We gapped up and closed on the highs of the day. The FED statement seemed to help although the entire session was bullish on lower oil and better than expected ISM. We do have a lot of resistance just ahead including July highs and 50 DMA just above.

Leadership today was provided by transports (airlines and trucking on lower oil), banks/financials, retail, casinos. Laggards were gold, oil and coal.

Crude inventories tomorrow at 10:35. This could be a very important number as oil is testing significant support, as are energy related plays such as coal.

[url=][/url]
Posted by Jamie at 8/05/2008 11:32:00 PM 0 comments
Labels: NASDAQ


Cup & Handle - China Medical Technologies, Inc. (ADR) (Public, NASDAQ:CMED)
CMED was an earnings gap which formed a C&H with NRIB (NR7) - price/volume contraction before expansion as discussed in yesterday's post. The Cup & Handle pattern is easier to see on the 5 min. time frame. Price rallied nicely out of the base despite the lame volume. That was a good clue that something was not quite right, but I got caught off guard anyway. After tagging $48.50, price retraced sharply and I couldn't take my partial. I moved my stop just under R1 and took a partial when price finally moved back towards $48.50. After all that narrow sideways trade, I was expecting 3 WRBs when price closed above $48.50 resistance, but CMED retraced again. Finally, after the FED, on the third wave, volume finally kicked in.

ACI was a B&B short off of a narrow 3 PP base. It got off to a very slow start. The only thing that kept me in the trade was the series of lower lows and lower highs on the lower time frame. I took a partial just ahead of the FED. My target was $45.00 which is a solid support level on the daily time frame above. We didn't quite get close enough to the target for me to plan an exit. At first I thought, bear flag, but then it formed a 3 PP base at $46.00, so I covered and went long into the close.

After three waves down, I expect ACI will find support at this level, and retrace. $60.00 looks like a good pivot target, but even a 32% retracement from the June highs would be good.


Shorting ABX was my FED trade. My logic was that rate cuts are bearish for the USD, so no rate cut is good for USD, therefore bad for Gold.

[url=][/url]
Posted by Jamie at 8/05/2008 07:56:00 PM 2 comments
Labels: 3 PP Base, Cup-and-Handle, Fibonacci, NR7, NRIB


Pre-Market
Futures trading higher on lower oil, but off the best levels.

Gapping Up: IBN, BCS, LYG, PMCS, ELN, CREE, HDB, AIB, CMED, Airlines on lower oil - AMR, NWA, UAUA, CAL, LCC, RYAAY

Gapping Down: RACK, JRCC, OTTR, CHK, MEE, WWE, HNT, AMSC, CSE, MSTR, CVLT, KNXA

Economic: ISM at 10:00; FED policy at 2:15

CSCO reports AH

[url=][/url]
Posted by Jamie at 8/05/2008 07:55:00 AM 0 comments
Labels: Pre-Market


Monday, August 04, 2008NASDAQ Technical Picture - Energy - Commodity Drubbing
Blogger won't let me post any images tonight, so this will be brief.

Crude oil and energy sectors were crushed on heavy selling (Natural Gas -7.1%, Coal KOL -9.3%, Clean Energy PBW -4%) along with big losses in commodities (DBC -2.7%, DBA -4.5%, Steel -5.9%, Gold/Silver -4.7%, Commodity Index CRX -4.2%, Chemical -3.5%) set up some great intraday trading and helped the stock indices bounce off of the morning lows.

That's three consecutive lower closes for technology and the broader indices leading into tomorrow's FED policy statement at 2:15. After all that, I expect narrow range trade leading into the actual statement.

Focus List - Keying off of the daily time frame, the following names have carved out 2 inside bars on lower volume - AKAM, AMLN, ALXN, ESRX, CNI (CNI also a bullish flag pattern).

[url=][/url]
Posted by Jamie at 8/04/2008 08:48:00 PM 1 comments
Labels: NASDAQ


Cup & Handle - UltraShort Oil & Gas ProShares (Public, AMEX:DUG); DryShips Inc. (Public, NASDAQ:DRYS)
DUG - Ultrashort Oil & Gas set up a perfect C&H base and break.

Characteristics of C&H pattern -

  • Handle should be shallow - preference to patterns that retrace 38% or less;
  • Handle - price and volume contraction as handle develops;
  • BO - Price and volume expansion on the BO. No need for a retest. If the handle is properly formed, price and volume should expand quickly on the BO. That's not to say that you should scratch the patterns that retest. It just means that a well formed handle has had plenty of time to consolidate, so no real need to consolidate after the BO.
  • Expected Measured Move - 100% from the low of the cup to the base of the handle.
Read more on C&H - VMW


DRYS - I traded this one as an inverse C&H pattern. Took a partial on a huge volume spike and held balance to target - (100% Fib. extension of the ORH to the base).

JOYG another play on lower oil. Missed the initial BO, but couldn't resist this NRIB (NR7).

Plus a bonus scalp into the close.


[url=][/url]
Posted by Jamie at 8/04/2008 04:40:00 PM 6 comments
Labels: Cup-and-Handle, Fibonacci, NR7, NRIB


Newer Posts Older Posts Home
金币:
奖励:
热心:
注册时间:
2006-7-3

回复 使用道具 举报

 楼主| 发表于 2009-3-20 16:20 | 显示全部楼层
Sunday, August 03, 2008NASDAQ Technical Picture - Feeling Bearish
IBD says we're in a confirmed rally, but I'm just not feeling it. Maybe it's just me, but the last few sessions have me thinking that this is going to break as a bear flag, not a base & break long.

[url=][/url]
Posted by Jamie at 8/03/2008 10:15:00 PM 4 comments
Labels: NASDAQ


Friday, August 01, 2008Gapper Dummy Trades - Biogen Idec Inc. (Public, NASDAQ:BIIB); Elan Corporation, plc (ADR) (Public, NYSE:ELN)
BIIB and ELN were mentioned last night in the NASDAQ Technical Picture post on news of the Tysabri patients. BIIB carved out a very subtle bear flag as price and the down sloping 5 period ema came together. The trade was choppy at times so I took a partial at $51.00 and closed at the psychological round $ number $50.00.

After attempting a fade, ELN settled back in under the 5 period EMA with some NRBs (NR7) and I shorted on the break of the base at $10.96. Exit at psychological $ dollar level $10.00 on a huge volume spike. Hard to believe that ELN was trading at $34.00 just four days ago.

BOOM was an intraday PP base & break. Took a partial as price approached the whole $ number and was stopped out a short while later.

[url=][/url]
Posted by Jamie at 8/01/2008 10:08:00 PM 4 comments
Labels: Base and Break, Bearish_Flag, Capitulation, Gapper


Pre-Market

Daily Setups - Bearish flags forming: BG, FCL; Pivot point short at $43.00 - COG, SOHU - $75.00; Bearish evening star X.


Gapping Up: ANR, THOR, JAVA, IR, BYD, IPHS, GPRO

Gapping Down: BIIB, SGP, ELN, NYX, HNSN, MNST, GM, OSK, RNWK, GFI

Oil and Gold trading lower.

Futures spike modestly on better than expected non-farm payrolls. Unemployment rate increases to 5.&% from 5.6%

[url=][/url]
Posted by Jamie at 8/01/2008 08:14:00 AM 0 comments
Labels: Pre-Market


Thursday, July 31, 2008NASDAQ Technical Picture - Failure at Resistance


The session started on a sour note after disappointing GDP figures and initial claims. The gap was quickly filled on lower oil and several upbeat earnings form some widely held names. The NASDAQ outperformed the broader markets, but late in the session, everyone headed for the exits and prices swooned into the close. Profit taking ahead of tomorrow's jobs data, I guess.

Oil retreated following yesterday's bounce, commodities, followed oil lower. Strength in biotechs and airlines.

Tomorrow's economic data includes Construction spending and ISM index at 10:00, as well as key jobs data at 8:30.

BIIB disclosed [url=]2 cases of PML in patients taking Tysabri[/url]. BIIB's partner is ELN and both charts look about the same.

Stocks set to gap lower on AH earnings include: BOOM, HNSN, TOMO. Gapping up: THOR, SWIM.

[url=][/url]
Posted by Jamie at 7/31/2008 11:12:00 PM 0 comments
Labels: NASDAQ
金币:
奖励:
热心:
注册时间:
2006-7-3

回复 使用道具 举报

 楼主| 发表于 2009-3-20 16:21 | 显示全部楼层
Dummy Gapper Trade - Akamai Technologies, Inc. (Public, NASDAQ:AKAM)
AKAM was an earnings gap which set up a perfect 3 pivot point base & break on the 1 minute time frame below. If we look at the 15 minute time frame, it's obvious that the down sloping 5 period EMA was still quite a distance from price when the trade triggered. When that happens, I still take the trade based on the ABC/123 setup - series of lower highs/3 pivot base. I look for a wide BO bar to pull the 5 EMA down. In the case of AKAM, the BO didn't close on its lows and the EMA was still trailing, so some consolidation was expected.

I keep an eye on the 1 minute time frame to monitor retracements - the 20 ema/1 min. should hold as resistance on a successful trade. I was sort of anxious to take a partial because price never tagged the 5 EMA (15 min.), and I knew that eventually, it would. Took a partial as price approached $23.00 and was stopped out about an hour later.

After a 38% retracement of the ORH to the midday lows, AKAM carved out a shooting star on the 15 min. and set up another short. I traded it as a trend line break on the 1 min. (see last chart). It didn't produce a big move, because buyers stepped in at $23.00 again. So we didn't reach the target 38% Fib. extension of the previous day high to the ORL, but a good trade just the same.


[url=][/url]
Posted by Jamie at 7/31/2008 07:14:00 PM 8 comments
Labels: 3 PP Base, Base and Break, Fibonacci, Gapper


Pre-Market
Economic data was ugly and markets are having indigestion this morning.

Gapping Up: MTZ, AMLN, MRO, FSLR, TTEK, MOT, DXPE, LKQX, ANDE, SYMC, PDGI, LOOP, FORM, ONXX

Gapping Down: AKAM, GM, MA, BARE, CNX, HOLX, THQI, TSS, GGP

[url=][/url]
Posted by Jamie at 7/31/2008 09:01:00 AM 2 comments
Labels: Pre-Market


Wednesday, July 30, 2008NASDAQ Technical Picture - Tech Still Underperforming


Another lacklustre day for tech, but a big day for the broader markets as oil finally came back to life with a huge thrust following the crude inventories (CNQ, NOV, OXY, HES). Also strong were coal (JRCC, ACI, CNX) engineering & construction (JOYG, FWLT), and steel (X, CLF).

Tomorrow is the last day of the month, traditionally reserved for window dressing the portfolios. However, tomorrow will have some key economic data to get things started including GDP and initial claims in pre-market , as well as, Chicago PMI at 9:45.

After hours, we had a number of solid earnings reports, most notably from FSLR which raised guidance considerably. Also up were SBUX, TTEK, V, (MA in sympathy with V, reports tomorrow morning), SYMC, DRIV, FLS. On the losing side, AKAM is down some 15% in AH.

As we can see from the charts above, both the NASDAQ and SPX are testing resistance. Not posting the charts tonight, but the overbought situation is intact.

[url=][/url]
Posted by Jamie at 7/30/2008 10:04:00 PM 0 comments
Labels: NASDAQ


Gapper Dummy Trades - Garmin Ltd. (Public, NASDAQ:GRMN) ; Buffalo Wild Wings (Public, NASDAQ:BWLD)
Once in awhile, a stock gaps, breaks daily support on the open, and runs all day. GRMN was the prefect candidate on another earnings disappointment. Trader-X style. I'm almost certain X was in this trade today!

BWLD initially looked like it might form a bullish C&H, but all of sudden it drooped over and set up the perfect inverse C&H pattern at the whole $ dollar base. Thought it might fill the gap, so I held past the measured move, but then I decided to fold. This stock has such a wide spread at times, so if you don't exit when you want, you'll end up giving back too much in slippage.

[url=][/url]
Posted by Jamie at 7/30/2008 04:00:00 PM 4 comments
Labels: Fibonacci, Gapper, Trader-X


Pre-Market
Gapping Up: BWLD, MT, SVVS, CMI, MTL, SLAB, TIN, TIE, HOKU, select financials - approval housing bill LEH, FRE, FNM, BAC, WB; SID, UAUA

Gapping Down: MET, ELN, ERTS, TTMI, ELON, ODP, ULTI, WYE, ALGN, GRMN, SIMO, LFG, SLW

Futures indicate another higher open for the markets on the back of new housing bill and favorable ADP jobs. Crude inventories at 10:35

[url=][/url]
Posted by Jamie at 7/30/2008 09:00:00 AM 0 comments
Labels: Pre-Market


Tuesday, July 29, 2008NASDAQ Technical Picture - Offset Day


The markets rallied on some better than expected earnings, consumer confidence, and full disclosure. In an effort to reduce its risk exposure and improve up its balance sheet, Merrill Lynch (MER) is selling $31 billion of CDOs for $0.22 on the dollar, or $7 billion. The XLF rallied 8%. Most major sectors except oil and gold, were up on the day.

Okay, so financials, energy, and commodities have been in play in July and there have been big moves on both sides. But what's up with large cap tech? Looking at the QQQQs and we see a base forming, but until we break $46.00, there's nothing much to get excited about. Top picks - BIDU, QCOM, JNPR (flag pole), FSLR/ENER, FMCN (bottom base forming), ALTR, DELL (yeah really), CELG and biotechs in general.

[url=][/url]
Posted by Jamie at 7/29/2008 10:17:00 PM 2 comments
Labels: NASDAQ


Newer Posts Older Posts Home
金币:
奖励:
热心:
注册时间:
2006-7-3

回复 使用道具 举报

 楼主| 发表于 2009-3-20 16:22 | 显示全部楼层
Tuesday, July 29, 2008Dummy Gapper Trades - Walter Industries, Inc. (Public, NYSE:WLT); Fording Canadian Coal Trust (USA) (Public, NYSE:FDG)
WLT and FDG were earnings gaps. WLT opened strong but retraced 75% before finding a bottom and beginning the base building process. I saw a 3 PP base at $94.00 and jumped in. Took a partial on weakness and then folded after it took out the morning swing high and gave it back.

I thought that FDG was setting up for a flat base breakout so I took an early entry. Once I was in the trade, I didn't feel any volume coming in, so I traded not to lose by moving stop after each completed 15 min. bar. After tagging the ORH twice, it failed and my stop saved the trade.

Failures usually lead to fast moves in the opposite direction. So I managed to make FDG work for me by short scalping it twice. The first scalp was a break of a bear flag. The second scalp set up after a full retrace back to the base and a mini C&H heading south.


[url=][/url]
Posted by Jamie at 7/29/2008 08:30:00 PM 7 comments
Labels: 3 PP Base, Failed_Pattern, Gapper, Scalp


Pre-Market
Gapping Up: FDG, MT, CNQR, BEAV, X, AKS, AG, WBSN, ANR, SAP, ALXN, TSL, AMED, BP (full retracement of gap in PM), WMGI, VECO, CL

Gapping Down: SEPR, TCK, MSO, ZRAN, ATHR, MOS, COH, CGNX, TRID, PLXT, CLR, HERO, PVTB, JDAS, NNBR

Futures up modestly despite the MER announcement late yesterday. Some short covering this morning on favorable earnings from Alpha Natural Resources (ANR), Amgen (AMGN), BP (BP), SAP (SAP) and U.S. Steel (X).

Yesterday was a trend day which is typically followed by a rest or NR trade. Let's hope that we can get some traction in steel, coal, oil on the backs of earnings noted above.


[url=][/url]
Posted by Jamie at 7/29/2008 08:57:00 AM 0 comments
Labels: Pre-Market


Monday, July 28, 2008NASDAQ Technical Picture - Bears Own It


Except for the opening range, the bears owned the day. This helped to work off some of the overbought posture, but overall it was another low volume session, with a lot of choppiness in the afternoon. After hours earnings were not too inspiring, so we may get more of the same low volume, chop until later in the week when economic data ramps up with crude on Wednesday, GDP on Thursday, and jobs data on Friday.

I'm watching the VXN after 3 NRIBs and pivot point support on the NAZ. If the PP support doesn't hold on a closing basis, we will retest recent lows. At the moment, last week's rally feels like a bear market bounce.

X reports earnings in pre-market. Consumer confidence at 10:00.

[url=][/url]
Posted by Jamie at 7/28/2008 10:11:00 PM 0 comments
Labels: NASDAQ


Gapper Dummy Trade - Ryanair Holdings plc (ADR) (Public, NASDAQ:RYAAY)
RYAAY (Irish airline ADR) gapped down on earnings. Initially it looked like it wanted to form a bullish base at $28.00, but eventually it succumbed to the bears and formed a bearish flag. My target was $25.00 based on the daily time frame, but when it printed a huge capitulation volume spike as price approached $26.00, I decided to cover. Lunch time was just around the corner and I didn't feel risking a stop out during the lunch time doldrums.

[url=][/url]
Posted by Jamie at 7/28/2008 03:43:00 PM 5 comments
Labels: Bearish_Flag, Capitulation, Gapper
金币:
奖励:
热心:
注册时间:
2006-7-3

回复 使用道具 举报

 楼主| 发表于 2009-3-20 16:23 | 显示全部楼层
Pre-Market
Futures flat on a slow news day.

Gapping up: AMGN (announces positive results for denosumab postmenopausal osteoporosis trial; also upgraded to Buy at Jefferies, upgraded to Outperform at Rodman and upgraded to Overweight at MS) SOHU, SINA, BHP, KFT, TOT, XMSR, CALM, NTAP, GLW, ACN, CVTX, PAY, ONXX, PCLN

Gapping down: MAT, SHPGY, RYAAY select airlines on RYAAY earnings and higher crude, DAL, AMR, CAL, UAUA; VZ, NOG, TSN, CLX (downgraded to sell at GS), LNCE, PLXS

[url=][/url]
Posted by Jamie at 7/28/2008 07:57:00 AM 0 comments
Labels: Pre-Market


Sunday, July 27, 2008NASDAQ Technical Picture - Chop Fest


The Nasdaq was up 1.33% at 2311, that was quite a bit better than the S&P +0.42% and the DOW +0.19%. Coal was the leader along with wireless and internet software. The laggards included Auto -4.0%; Printing -3.2%, Apparel and Accessories -2.5%.Volume was down about 20% on the session following Thursday's plunge lower. With oil off some $24.00 from the record high July 11th, it should start to retrace some of that loss soon.

Next week look for key economic data with GDP on Thursday and Jobs data on Friday. Key earnings from V and MA on Wed, and Thursday respectively, will give a better idea how the consumer is holding up. Other companies reporting this week include: Monday: KFT, TSN, AMGN, UHS, Tuesday: COH, HERO, MSO, MHP, NOV, X, UA, VLO, BBOX, BWLD, DWA,... Wednesday: GRMN, HES, HUN, AKAM, CLF, DRIV, ESRX, FSLR, SBUX, DIS... Thursday: AET, MO, AZN, CVC, DSX, D, EK, EXPE, XOM, GT, MRO, KLAC, MPWR, MNST, SGMS... Friday: BYD, CI, FE, JAVA.

Events: Fed Gov. Mishkin scheduled to speak tomorrow.


[url=][/url]
Posted by Jamie at 7/27/2008 02:01:00 AM 0 comments
Labels: NASDAQ


Friday, July 25, 2008Base & Break - Arch Coal, Inc. (Public, NYSE:ACI)
Yesterday we said that ACI looked like a C&H waiting to BO. The first chart highlights the C&H pattern and expected Fib. extension of 100% from the ideal BO point. The blue lines represent pivot points and basing areas. Whenever we execute a planned trade, we want to find a low risk entry point near a pivot point, targeting the next level pivot as a possible exit. On a measured move basis, chart patterns such as a C&H usually extend 100%. That's the norm, but sometimes they surprise us with bigger or smaller moves. It depends on the market and momentum. In our case the 100% extension of the pattern lined up almost perfectly with the next level PP, so this added an extra element of confidence in the setup.

Today ACI gapped open and retraced approx. 50% of the move from yesterday's closing lows to today's ORH. It breached the blue line in early trade, retraced sharply and began forming a base at the PP through a couple of higher lows. The best time to enter is after price settles into narrow range trade at the base to of the PP, or wait for the retest of the base after the BO. Don't buy if price runs up quite a distance to reach the PP, wait for price and volume to contract just prior to BO. I know that this is not as easy as it sounds, but it helps to put you in a winning trade much more quickly rather than sitting through all the backing and filling.

As you can see from the chart below, once price successfully retested the base, it took off nicely reaching the target in an orderly fashion.

We also mentioned that we would like to short LEH if it pulled back to the broken trend line or 50 SMA on the 15 minute time frame. Neither of those two things happened as LEH opened weak and spent most of the session chopping around. There was little opportunity for a decent size profit because price was so close to the $17.00 target anyway. Don't force a trade if the risk:reward ratio is less than 1:2 or ideally 1:3.

[url=][/url]
Posted by Jamie at 7/25/2008 05:42:00 PM 12 comments
Labels: Base and Break, Cup-and-Handle, Fibonacci, Pivot Point, target_trade


Thursday, July 24, 2008NASDAQ Technical Picture - Bearish Engulfing


Today was pure profit taking at overbought levels. Oil/commodities sold off in the early going but managed to find a bottom early in the session with some healthy retracements in the afternoon. The dailies for these sectors look like they want to retrace at these support levels. Financials need to pullback a bit more. The way we closed leaves the door open for more pressure tomorrow, but I'm watching the 15 minute chart as support is just 10 points away.

[url=][/url]
Posted by Jamie at 7/24/2008 10:38:00 PM 0 comments
Labels: NASDAQ


Base & Break Bottom Reversal - Arch Coal, Inc. (Public, NYSE:ACI)
ACI set up a low risk short when it paused at yesterday's late day lows, but I missed it. After bottoming at S2, it carved out a 3 pivot point base for a nice long entry. Once it took out the down sloping 20 EMA, I had a good feeling that it would retrace all the way back to yesterday's lows. Now it looks like it wants to be a cup & handle long. Keep it on the focus list for tomorrow.

Financials were so overbought so I took a chance on LEH. There was a trend line breach and I'd like to see it retest the trend line or 50 SMA tomorrow and set up another short. I'm targeting $17.00. LEH has pivots at every dollar level which makes it easier to time entries and exits.

[url=][/url]
Posted by Jamie at 7/24/2008 10:00:00 PM 2 comments
Labels: 3 PP Base, Cup-and-Handle, Trendline


Pre-Market
Gapping Up: QCOM, BIDU, XMSR, AMZN, TRA select Ag chem - AGU, MOS, POT, IPI; NOK, RSH, FSLR

Gapping Down: LH, MKSI, GDI, WFR, CMG, AUXL, FFIV,

Setting up for a mixed open with NQ futures outperforming due to good earnings reports from AMZN, BIDU and QCOM. Initial jobless claims higher than estimated 405 vs. 380.

Upgrades C, WFR

Downgrades AGU, POT, COST, BA, MCD

[url=][/url]
Posted by Jamie at 7/24/2008 09:07:00 AM 0 comments
Labels: Pre-Market


Newer Posts Older Posts Home
金币:
奖励:
热心:
注册时间:
2006-7-3

回复 使用道具 举报

 楼主| 发表于 2009-3-20 16:24 | 显示全部楼层
Thursday, July 24, 2008NASDAQ Technical Picture - High Volume Trendline Break


A new recovery high on good volume in the morning, followed by narrow range chop from midday and following the FED Beige Book. Oil tried to rally following the crude inventory report (large draw), but ended the day on its lows. A number of strong earnings reports AH from AMZN, BIDU and QCOM could provide fuel for tomorrow. WFR down more than 20%. The NASDAQ is very overbought.

Oil/commodities are coming into support. Normally, I'd expect a bounce at these levels, but this market may surprise.

[url=][/url]
Posted by Jamie at 7/24/2008 12:32:00 AM 1 comments
Labels: NASDAQ


Wednesday, July 23, 2008Dummy Gapper Trade - Costco Wholesale Corporation (Public, NASDAQ:COST)
COST had a lot of momentum in pre-market. I actually wanted to short it as it based at $64.60 in pre-market, but due to technical problems, I missed the trade. I did manage two low risk trades once the session got underway. The first was a long entry off of a 3 pivot point base on the 1 min. time frame which quickly reversed, but allowed for some fast money. This was attempt to fade the gap, but was rejected at the down sloping 5 period EMA on the 15 minute time frame. The second entry, also a 3 PP base, was on the short side. It generated just over 1 pt. before reversing.


ACI tested resistance on the open and swooned lower. Following a full retracement back to resistance, it carved out a bearish star-like reversal pattern. After consolidating sideways in a narrow range on low volume, and with a little help from the FED, it swooned again, closing near its lows.

[url=][/url]
Posted by Jamie at 7/23/2008 06:38:00 PM 6 comments
Labels: 3 PP Base, Evening Star, Gapper


Pre-Market
Gapping Up: UAUA (other airlines in sympathy DAL, CAL, AMR) FRE, FNM, FHN, ILMN, ISRG, INFN, WHR, WLP, UNH, MCD

Gapping Down: COST, BJ, VMW, AUY, GFI, ABFS, ADCT, CHRW, ZMH, DNDN

[url=][/url]
Posted by Jamie at 7/23/2008 07:50:00 AM 0 comments
Labels: Pre-Market


Tuesday, July 22, 2008Gapper Dummy Trade - Millicom International Cellular SA (USA) (Public, NASDAQ:MICC)
As I mentioned in the comments section this morning, gappers that are ripping in pre-market are the ones I focus on. These generally have enough momentum to move price lower (higher). MICC was my first choice this morning. After the WOR, it sort of fell into a dead zone of offsets and eventually retraced back up to the declining 10 EMA. The key is to observe a series of lower highs, followed by price/volume contraction at or near the ORL. At first glance, it doesn't look like much, but if you do the math, you'll see that MICC was well worth the wait. I don't bother with Fibonacci extensions on really wide gaps.

ARTC, yesterday's gapper play, set up a 3 PP base, and low risk entry for a nice gain into the last hour.

Today, was mostly a gap fade day as many of this morning's gap downs were quick to take out the ORH.

[url=][/url]
Posted by Jamie at 7/22/2008 07:28:00 PM 10 comments
Labels: Gap_Fade, Gapper
金币:
奖励:
热心:
注册时间:
2006-7-3

回复 使用道具 举报

 楼主| 发表于 2009-3-20 16:25 | 显示全部楼层
Pre-Market
Gapping Up: WGOV, STLD, BJS, BHI, CAT, QLGC, ERII; strength in Europeon oil & gas BP, TOT

Gapping Down: TXN, AXP, V, MICC, AAPL, MRK, SNDK, AIB, VOD, EXP, PWRD, ERIC, AGO, RF, CE, ALV

Futures setting up fo a sharply lower open NQ -31; ES -9

[url=][/url]
Posted by Jamie at 7/22/2008 08:43:00 AM 0 comments
Labels: Pre-Market


Monday, July 21, 2008Prototypes


Both Mitsubishi Outlander and BMW Germany used this song in their ads. The band also scored with iPod shuffle a few years back.

[url=][/url]
Posted by Jamie at 7/21/2008 10:33:00 PM 0 comments
Labels: Entertainment


NASDAQ Technical Picture - Narrow Range Consolidation

A low volume, narrow range consolidation day. Although both the S&P and DOW took out last week's highs in early trade, there was no follow through. As expected a lot of backing and filling. Leadership on the long side was provided oil/energy and commodities with weakness noted in airlines and broker dealers. Sounds familiar.

After hours we got a host of disappointing earnings and guidance from AAPL, AXP, SNDK, TXN, and MRK. The NQ Eminis are off by 30 pts. AH so expect a gap down open tomorrow.

No economic data tomorrow, but Philadelphia Fed pres. Plosser has a scheduled speaking event which could impact markets. LRCX, LLTC, BRCM, YHOO, VMW report AH. Before the bell WB, CAT, AKS, HAL, UAUA, and UNH are scheduled.

[url=][/url]
Posted by Jamie at 7/21/2008 09:07:00 PM 0 comments
Labels: NASDAQ


Gapper Dummy Trade - ArthroCare Corporation (Public, NASDAQ:ARTC)
ARTC was a pre-market gapper with momentum after announcing they were restating financial statements. This kind of news is deadly, so you want to get in as soon as reasonably possible. Markets don't like the unknown and restatements inevitably lead to write-offs or write-downs. A great example is NT which restated at least ten times over the past seven years. Still not sure these guys ever got it right.

My second attempt to get in was not in the cards as the stock became unavailable for shorting. No surprise there.


As I mentioned in pre-market, I was expecting some backing and filling after last week's big thrust. LEH played into that scenario perfectly. After taking out resistance in early trade, it couldn't sustain the higher prices. It carved out an IB at support which closed on its lows, setting up an easy short back to the next level of support.

[url=][/url]
Posted by Jamie at 7/21/2008 07:55:00 PM 8 comments
Labels: Capitulation, Gapper, Inside Bars, Support_Resistance


Pre-Market
Gapping Up: BAC, (FRE, FNM) UBS, RF, AIG, KEY, WFMI, IGT, NTES, WFSL

Gapping Down: ARTC, ASTE

Jeffries pumping casino stocks - MPEL, MGM, LVS and WYNN

Futures trading up ahead of the open but NQ looks to have carved out a lower high. ES clearly outperforming NQ ahead of the open. ES trading above last week's highs, NQ not even testing last week's highs. I expect some consolidation after last week's thrust, but earnings will be key. AAPL reports AH.

[url=][/url]
Posted by Jamie at 7/21/2008 08:43:00 AM 0 comments
Labels: Pre-Market


NASDAQ Technical Picture - Testing Trendline


Last week, lower oil and better than expected results from financial companies helped trigger a short squeeze after a long losing streak. Poor earnings from tech giants GOOG, and MSFT tempered the NASDAQ's overall weekly performance on Friday. The main thrust of the short covering rally is likely over and we can look forward to some backing and filling, however, these markets are still highly news driven so it's important to keep abreast of daily catalysts and focus on earnings.

My Focus List going into next week.

Price/Volume Contraction - ABX, ALTH, AMZN, CSGS, JCOM, PRGO
Oversold and/or testing support - X, FWLT, BTU, CNX, FCL, APA, COG, CNQ
Overbought and/or testing resistance - WBS, LEH, MYGN, DNA, WYNN
Bear Flag Forming - BG, ICE, JRCC, WLT, VMW
Bull Flag Forming
B&B Long - HOLX
B&B Short - MON
Buy Pullback - RIMM, DRYS
Sell on Strength - AAPL

Companies reporting earnings on Monday: BAC, AAPL, SNDK, STLD, TXN

[url=][/url]
Posted by Jamie at 7/21/2008 01:20:00 AM 2 comments
Labels: NASDAQ


Newer Posts Older Posts Home
金币:
奖励:
热心:
注册时间:
2006-7-3

回复 使用道具 举报

 楼主| 发表于 2009-3-20 16:26 | 显示全部楼层
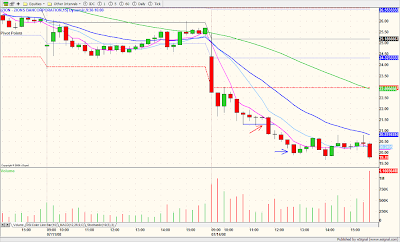
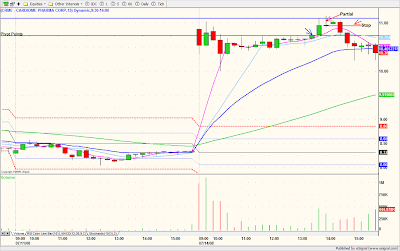
Tuesday, July 15, 2008B&B Within Daily Hammer - Patriot Coal Corp. (Public, NYSE:PCX); Potash Corp. (Public, NYSE: POT)
Jamie is taking the remainder of this week off. It is OPEX week and the market has been extremely choppy of late. I too was not expecting many good setups this week.

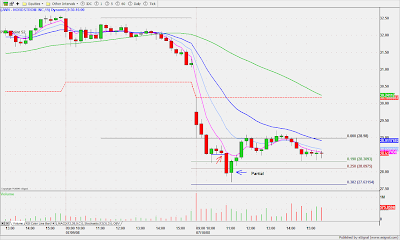
One of the things I do (as a part-time trader) is check the market several times per day and see if anything grabs my attention. As I was checking my watchlist this afternoon, I saw that PCX had hammered off of the daily 50sma (left chart below) with capitulation action intraday and had setup a nice B&B pattern on the 15min chart (right chart below). Notice the matching congestion areas at roughly the same price level on the 15min. Unfortunately, the BO in PCX had just occurred (within 2:00 pm bar) and I felt that I had missed the optimal entry point. As it turned out, I could have entered late and still made a nice profit.


A good practice when you have just missed a solid setup is to quickly look for a similar setup that has yet to BO. Within a minute or two I identified a similar setup in POT. Notice the hammer action (long lower tail) at the daily PP line and the matching congestions on the 15min chart. On the 15min, POT had just retraced to test the rising 20ema (and 5ema) and was starting to bounce. Given the similar of the setups and the relative strength of the POT daily chart, I entered immediately. After further analysis, I realized that POT had sloppier action and less basing (relative to PCX). With this in mind, I took a relative quick exit with my full position just above the round number $225. As it turned out, I left some profit on the table. This is fine as I achieved a nice reward-to-risk ratio and did not have to endure any retracement action in a very choppy market overall.


Jamie will be off for the rest of this week. It is OPEX and choppy action is expected.

[url=][/url]
Posted by Jim at 7/15/2008 10:17:00 PM 5 comments
Labels: Base and Break, Capitulation, Daily, Hammer, Matching Congestions


Monday, July 14, 2008Gapper Dummy Trade - Zions Bancorporation (Public, NASDAQ:ZION)
I missed the bear flag entry on ZION, but luckily it carved out a 3 PP base a while later and I was able to get in. My target was the round $ number $20.00 - support on the monthly time frame.


CRME - Good for a scalp, but after a lengthy basing period, I was disappointed that this one couldn't take out $11.00.

Gold stocks were the place to be today. Check out the charts for GOLD and GG.

I'll be off for the rest of this week. If today was any indication, OPEX could get very choppy so this is a good time to get away.

[url=][/url]
Posted by Jamie at 7/14/2008 07:16:00 PM 2 comments
Labels: 3 PP Base, Base and Break, Gapper


Pre-Market
Gapping Up: Financials FRE, FMN, LEH, MER, C, BAC, MBI, JPM; Solar CSIQ (earnings), JASO, SOL, SOLF, FSLR; Pharm CRME; AAPL, ATI (earnings), NDAQ, PHG, AA, NOV, APWR, ISIL

Gapping Down: SKF, ZION (downgraded to sell at GS added to conviction list) , CGV, ATMI, RMD

[url=][/url]
Posted by Jamie at 7/14/2008 08:32:00 AM 2 comments
Labels: Pre-Market


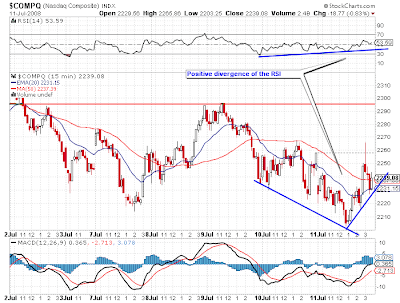
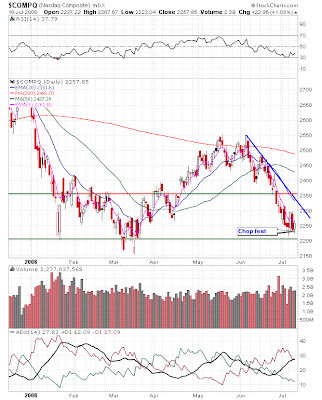
Sunday, July 13, 2008NASDAQ Technical Picture - Intraday Bearish Expansion


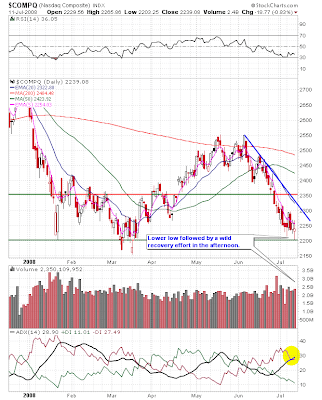
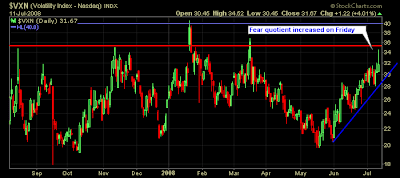
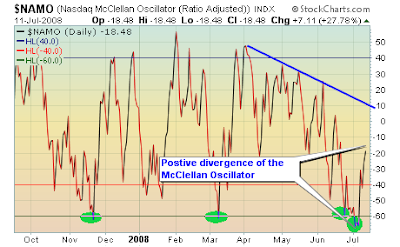
All of the major U.S. averages undercut their previous lows early Friday, but only the NASDAQ managed to stave off a new closing low. Volume, along with the fear factor as measured by the $VXN and $VIX, rose on increased worries of insolvency for mortgage giants Freddie and Fanny. Lehman also fell sharply on rumors, and Merrill fell another 4% and is trading near 10 year lows. Sector strength came from Gold/Silver +4%, Mining +3.6%, Coal +3.5%, Casino +2.4%, Crude Oil +2.3%. Everything else was pretty much red.

Next week is options expiration, so watch for choppiness starting Wednesday through Friday.

[url=][/url]
Posted by Jamie at 7/13/2008 08:59:00 PM 0 comments
Labels: NASDAQ


Trading Rules


Trading rules are an important part of the trading strategy. Without them you might end up in some messy trades and feel almost as bad as this guy.

[url=][/url]
Posted by Jamie at 7/13/2008 06:55:00 PM 0 comments
Labels: Trading_Rules


Friday, July 11, 2008Bear Flag - Research In Motion Limited (USA) (Public, NASDAQ:RIMM)
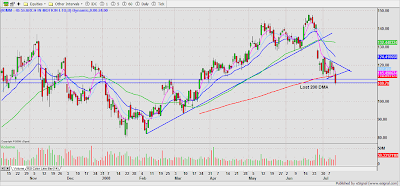
The first chart is RIMM's daily time frame. I've been watching it since the gap down on weak earnings. The consolidation on declining volume at support of 200 DMA was starting to look like a bearish pennant. Keep this one on the WL for next week. Potential continuation if RIMM doesn't regain its 200 DMA on Monday.

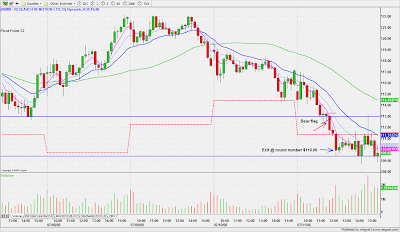
Intraday RIMM formed a bearish flag after breaching its recent daily consolidation lows. This set up a perfect storm. It's easier to see the declining volume on the flag formation on the 3 min. chart below. Short on BO. You'll feel the volume as price breaks out of the pennant and that acts as confirmation that the setup is real.

My target was the round $ number $110.00 and I covered as price approached my target. You also feel the capitulation volume when it's done.

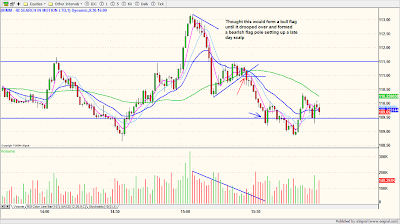
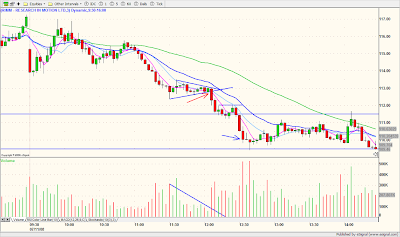
The afternoon was basically a chop fest, but a late day failed bull flag pole led to a bearish flag formation and a low risk scalp back down to the morning swing low.


[url=][/url]
Posted by Jamie at 7/11/2008 04:16:00 PM 10 comments
Labels: Bearish_Flag, Bearish_Pennant


Pre-Market
Gapping Up: WYNN, LVS, ROYL, OXY, CHK (select Oil) , MA, JEC, BEXP, GOLD, GG

HPQ upgraded to Strong Buy at Raymond James; QCOM added to GS conviction list.

Gapping Down: WCG, AIB, PHG, WB, LEH, BAC, DB, UBS, MS, FRE, FMN, NY Times reported Bush administration officials are considering a plan to have the govt take over both cos and place them in a conservatorship if their problems worsen. The shares of FNM and FRE would be worthless, and any losses on mortgages they own or guarantee would be paid by taxpayers.
NETL, AIG, YHOO, TEVA,
Markets setting up for a very negative start S&P -16.75, NQ -21.5, YM -135 due to trade balance which came in well below economists expectations. Is this going to be the capitulation day we've been waiting for???

Sectors:
Higher oil, gold. Weak airlines, financials, and home builders.
Most sectors this color in pre-market.


[url=][/url]
Posted by Jamie at 7/11/2008 08:45:00 AM 0 comments
Labels: Pre-Market


Thursday, July 10, 2008NASDAQ Technical Picture - Chop Fest

Sloppy, choppy and volatile. The intraday chart tells the story. Energy/commodities were strong and an intraday spike in oil cracked the rising wedge.

The light sweet crude chart below shows some negative divergence of the MACD and RSI to higher prices. Two NRIBs on the base of the trend line look promising.


[url=][/url]
Posted by Jamie at 7/10/2008 10:58:00 PM 0 comments
Labels: NASDAQ


Dummy Gapper Trades - Nordstrom, Inc. (Public, NYSE:JWN); FCStone Group, Inc. (Public, NASDAQ:FCSX)
Mailbag

The first trade in JWN was submitted by a reader. The entry and partial are his and he asks how he could better manage the trade. He was targeting a 50% Fib. extension.

The first point is that JWM is a regular gap with an expected target of 38% from the previous day high to the ORL (Trader-X). That target as we can see from the chart, was achieved within a tiny margin of error. Always sell/cover into strength, so plan to exit at least a partial as price approaches the target. After that don't allow price to retrace more than 38%. That is a normal retracement, and if it takes place on declining volume, there's a good chance that the trade can continue to move in our direction. I measure 38% including the trigger bar and estimate that $28.10 plus wiggle of 5 cents was a good place to set a stop.

The story is a bad retail sales report, but nothing over the top. The main observation I have is that the entry takes place after 3 WRBs so the main thrust is behind us.

If we look at the 3 minute time frame, we see that after the first two 15 min. bars, it carved out a 3 PP base at the ORL, with three consecutive lower highs (ABC). That setup is a relatively low risk scalp. Take a partial after 3 WRBs.

If you use multiple time frames, watch for candles with upper wicks on the lower time frame as potential areas of resistance, if they don't hold, take some money off.

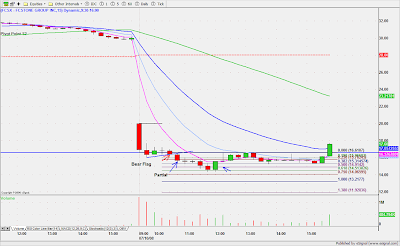
The next trade was my gapper trade today. FCSX was an earnings miss with a really wide gap, trading in the daily spot (all time lows) with no support. If a stock gaps too wide don't use the regular Fib. extensions because they don't work.

Here I'm trading a pattern - bearish flag, so my extension is from the top of the pattern to the base. The normal expectation for patterns is 100%. But this is a $17.00 stock, so I have to be realistic in my expectations. Also there's a caveat here because the flag breaks when the down sloping 5 period EMA is still a good distance above price. So I took a partial after almost 1 pt. to mitigate any potential reversal. FCSX didn't reach the full extension. But I'm keeping this one and VMW from the other day, on the WL for potential future weakness.


[url=][/url]
Posted by Jamie at 7/10/2008 07:47:00 PM 11 comments
Labels: Bearish_Flag, Fibonacci, Gapper


Pre-Market
Gapping Up: WMT, HUN, CLR, SPWR, GLD, AIR, SGR, GE

Gapping Down: WFR, JASO, WB, BAC, FCSX, C, FNM, FRE (bringing whole financial sector of FED Poole comments re. solvency issues) HUM, LEH, MER, MCO, VLO

Initial Claims 346k vs 395k consensus

Futures edging lower - a substantial slide from earlier this morning - same store sales for many retailers have missed estimates - JWN, ANF, LTD, AEO. Some of the better reports include WMT, TGT and COST.

[url=][/url]
Posted by Jamie at 7/10/2008 08:50:00 AM 0 comments
Labels: Pre-Market


Newer Posts Older Posts Home
金币:
奖励:
热心:
注册时间:
2006-7-3

回复 使用道具 举报

 楼主| 发表于 2009-3-20 16:28 | 显示全部楼层
Wednesday, July 09, 2008NASDAQ Technical Picture - Offset Day


Another offset day for both the daily comp. and VXN. The early run into pivot point resistance was shaken out rather quickly. I had a pretty good feeling we were going to head south in the afternoon when the 15 min. trend line failed to hold as support. The afternoon sell-off was sharp, with barely a pause at the 50% Fibonacci retracement level.

The early bounce in commodities was offset by further worries in the financial sector which gave back most of yesterday's gains 5.2% / 5.6%. Offset days were common when we traded at these levels back in the spring. They can be a pain in the butt, but mostly they act as a reminder that we can't take anything for granted. It's okay, as day traders we get a chance to make the same money over and over again.

[url=][/url]
Posted by Jamie at 7/09/2008 10:21:00 PM 0 comments
Labels: NASDAQ


Gap Down Inverted C&H - Hansen Natural Corp. (Public, NASDAQ:HANS)
There were several good short setups as the markets dropped this afternoon. I did not see CTSH (Jamie's trade below) which was a very clean setup on the 15min chart. I was watching HANS based on the gap down below a previous daily PP (left chart below). It took some time but eventually setup an inverted C&H with decent volume contraction in the handle. I shorted it as the handle/flag attempted to recapture the 5ema on the 15min and failed (right chart below). I closed half after 3 WRB following the BO of the morning low and was stopped out with a tight stop on the balance.


[url=][/url]
Posted by Jim at 7/09/2008 09:40:00 PM 8 comments
Labels: Cup-and-Handle, Gapper


Dummy Base & Break - Cognizant Technology Solutions Corp. (Public, NASDAQ:CTSH)
There was a lot evidence from CTSH's 15 minute time frame that this stock was going to roll over. A bearish evening star reversal pattern - star is a hanging man. As price moved back into support, it carved out a NRIB NR7 setting up a perfect low risk, dummy entry point. I took a partial as price approached $31.00 and the flat 50 SMA.

As you can see from the 3 minute time frame below, I allowed for a 38% retracement. I use a mental stop on the second half and monitor the price/volume action during the retracement. If volume increases on the retracement I will put in a hard stop a few ticks above the retracement level. But as you can see, CTSH wasn't setting up much of a move here. It was just a matter of time before price would roll over once again. That gave me the opportunity to add back the original size for the second leg down.


[url=][/url]
Posted by Jamie at 7/09/2008 04:56:00 PM 6 comments
Labels: Dummy, Evening Star, NR7, NRIB


Tuesday, July 08, 2008Trading Not to Lose - VMware, Inc. (Public, NYSE:VMW)
VMW gapped wide on huge volume. It was trading in the daily spot - all time lows with no support. The fourth 15 min. bar printed NRIB NR7, but the down sloping 5 period EMA was miles above price. In order for a trade like this work, you need a wide BO bar with enough muscle to pull the 5 EMA down closer to price.

The 1 minute chart shows a perfect 3 PP base. Each pivot off of the base carves out lower high (ABC). It's obvious that the base will break, so I take the trade. Each time price makes a lower low, I tighten stop. Partial out after price breaches whole number and takes it back. As price consolidates the first leg down, it prints a lower low and immediately, moves back into the trading range. At that point, I'm on notice that the trade might fail, so I tighten stop on second half just above the pivot highs of the consolidation range.

As we can see on the next 15 min. frame, we had a solid BO bar which closed on its lows, on higher volume. The move pulled the 5 EMA almost 2 points lower from $42.48 to $40.66. However, it still wasn't touching the top of the BO bar and we know that price and the 5 EMA are like magnets and eventually have to come together.

The setup was half baked on the 15 min. and failed to generate a big extension, but I knew what I was getting into. I wanted to post an example of trading not to lose, because I sometimes discuss it in the comments.

Not recommended for new traders. But if you get in a jam, this strategy might be helpful.

[url=][/url]
Posted by Jamie at 7/08/2008 11:47:00 PM 6 comments
Labels: Gapper


NASDAQ Technical Picture - Solid Reversal Day


A solid reversal on good volume which held into the close. Pre-market futures rallied out of the depths of the overnight sell-off on Bernanke's positive comments for the beleaguered financials. However, momentum was minimal and the indices faltered following the 10 ET data (Pending Home Sales -4.7% vs. consensus of -2.8%). It took several hours to form a proper base, but by mid-afternoon, prices broke with a solid run into the close. Airlines, financials, housing, rail, trucking (Transports + 5%) paced the way higher. Commodity/energy sectors still weak.

The NASDAQ closed on an intraday pivot, so I expect we may pull back to trend line on 15 min. before the next leg up.

Crude inventories tomorrow at 10:35.

[url=][/url]
Posted by Jamie at 7/08/2008 10:00:00 PM 0 comments
Labels: NASDAQ


Apple Inc. (Public, NASDAQ:AAPL) Bullish Flag 1 min.; Cup & Handle 15 min.
AAPL $177.00 was a clear pivot point base early in the session, but it took a long time for the pattern to set up correctly. Eventually, it became clear that we had a C&H base and break, but there was a lot of choppiness before the pattern was ripe for trading.

On the 1 minute chart, AAPL formed a base as price tested the 50 SMA. As price broke out of the base, it printed 3 WRBs on higher volume = flag pole. Then price consolidated sideways on declining volume = flag. Price broke out of the flag pattern on a huge volume spike. As soon as volume spikes above the line segment, it's time to get in. On a measured move basis, the flag pattern should produce two flag poles, one before the flag, and one above the flag.

I took a partial after 3 consecutive WRBs on the 15 min. time frame. After that allow for a 38% retracement. On a measured move basis, the C&H pattern also generates a 100% extension, but time ran out on this one.

What's my favorite number? The number 3 figures prominently in my trading.

[url=][/url]
Posted by Jamie at 7/08/2008 07:04:00 PM 5 comments
Labels: Base and Break, Bull_Flag, Cup-and-Handle


Pre-Market
Futures have recovered from overnight swoon
on Bernanke speech - says may hold off raising rates this year and may allow investment banks to continue to borrow into 2009.

Gapping Up:
ERJ, WDC, BIDU, SQNM, ENER; Select European Drugs GSK, NVS, AZN; Select Airlines on lower oil CAL, UAUA, DAL, NWA; FRE, FNM trying to form a base after yesterday's drubbing; IVGN - FDA approval of premarket breast cancer testing;

Gapping Down: AOB, TXN, ODP, SPLS, GME, HK, VPHM, NEM, GDP, VMW, EMC, CTXS, GYMB

Last update 9:28 EST

[url=][/url]
Posted by Jamie at 7/08/2008 08:21:00 AM 0 comments
Labels: Pre-Market


Monday, July 07, 2008NASDAQ Technical Picture - Bears still in Control

The markets opened on a modestly positive note but after two hours of NR trade, they took out the ORL and swooned for a retest of Thursday's lows. The middle part of the day was a chop fest, followed but a vertical move back up to the morning range. Too bad we couldn't close on a positive note as prices quickly retraced 38% of the move in the last half hour. Fed member Yellan's bearish comments re: inflation and the banking/housing sectors, and concerns over FRE and FNM need to raise more capital, weighed.

Asian markets sharply lower across the board on bank loss concerns. Emini futures trending lower since 8:00 P.M. EST.

[url=][/url]
Posted by Jamie at 7/07/2008 11:30:00 PM 0 comments
Labels: NASDAQ


Base & Break - Southwestern Energy Company (Public, NYSE:SWN)
SWN was a HCPG trading list short at $44.00. I found a NR base, so I took the early entry. Little hiccup along the way, but managed to get back in. See my chart notes on the 1 minute time frame below.


RIMM was a late session bull flag long on the 1 minute timeframe. Late day bounce for the markets following a lengthy sideways chop. The choppiness which preceded the BO, means you want to look for solid setups, otherwise how can you trust them.

[url=][/url]
Posted by Jamie at 7/07/2008 04:54:00 PM 9 comments
Labels: Base and Break, Bull_Flag


Pre-Market
Futures modestly higher on a very slow news day, with NASDAQ leading the way. No earnings or economic data scheduled for today. Sector weakness Gold, Oil; biotechs mixed, most everything else I track is in the green so far.

Gapping Up:
CALM, DRYS, AAPL, ADTN, YHOO spiking higher MSFT will enter conversations with YHOO if Icahn can dump the board.

Gapping Down: TEVA, GSK, BHP, GLD AAUK, DIS, MRK, MI, ABX, APKT, UBS, DEO, HTE, HAL, VRSN, RATE, SLB testing support.

Upgrades: Piper upgrades BRCM and JNPR from neutral to buy; Broadpoint Capital upgrades ENER to Buy from Neutral

Downgrades: Piper downgrades APKT from buy to neutral (JP Morgan also downgrades APKT)

[url=][/url]
Posted by Jamie at 7/07/2008 08:55:00 AM 0 comments
Labels: Pre-Market


Newer Posts Older Posts Home
金币:
奖励:
热心:
注册时间:
2006-7-3

回复 使用道具 举报

 楼主| 发表于 2009-3-20 16:30 | 显示全部楼层
Thursday, July 03, 2008Daily PP Reversal - First Solar, Inc. (Public, NASDAQ:FSLR)
Today was an abbreviated session and I was not expecting to find a good setup/trade. That is often the best frame of mind to be in (not expecting to trade). Given the recent downside action and pre-holiday, I felt the odds favored the long side.

My scanners typically work best later in the morning or mid-day. Given the short session, I worked thru my WL looking for a trade within the first few 15m bars. FSLR appeared to have hammer-like action and the 3rd 15m bar was forming a potential IB. Dialing up 3 time frames (daily, 15m and 5m) told the story. The support was at a significant daily PP. The 15m was well below the 5ema which allowed room for initial upside (per TraderX). Additionally, the small opening gap provided a good upside target if it could get thru the 5ema on the 15m.


In hindsight, I should have taken a partial and held some for 3 WRB or a reversal on the 5m. Much was left on the table.

[url=][/url]
Posted by Jim at 7/03/2008 09:17:00 PM 7 comments
Labels: Daily, Pivot Point, Reversal


Wednesday, July 02, 2008NASDAQ Technical Picture - Bearish Outside Day


Commodities cratered off the open. Coal -14% and Steel -13% with Transports -4.3% (Airline -6.6, Rail -5.3%, Trucking -3.7%) were hit with very heavy selling and closed on their lows. Every coal/steel daily chart looks the same, an extreme WRB with a huge volume spike. Once the winners start breaking down, it should signal fear, but so far no sign of fear/panic in the VXN/VIX and no technical capitulation despite extreme oversold levels.

The NASDAQ is testing its pivot point and the DOW is testing a solid double bottom base dating back to the summer of 2006. I suspect we'll get a technical bounce back up to the trend line very soon.

Economic calendar: Jobs data at 8:30 will likely set the tone for tomorrow's trade. ISM services at 10:00.

NVDA lowered Q2 revenue guidance after hours and the stock is down 20%.


[url=][/url]
Posted by Jamie at 7/02/2008 11:41:00 PM 0 comments
Labels: NASDAQ


Target Trade Flag Pole- United States Steel Corporation (Public, NYSE:X)
X set up as a target trade to support on the daily as commodities cratered off the open. From the 15 min. chart below we see a weak opening range followed by WRB which tags support from yesterday's swing low. I was expecting a series of NRBs to form at the base, but price breached the base and continued lower. IMO, every flag pole, needs a flag (narrow range consolidation) before the pattern can continue in earnest. Finally, X printed a hammer reversal bar which was the beginning of the flag. Price retested the base and then carved out a NRIB NR7.

I ignored S2 because as far as could tell, it didn't line up with any congestion or support area. I covered as price approached the target and round $ number $160.00.

My second X trade was a trendline breach on the 1 minute time frame. After retracing back up towards the declining 20 EMA on 15 min., X printed a shooting star. On the 1 min. chart price swooned into the trendline, consolidated briefly, before breaching and ascending the second leg down.

Failed flag pole and flag pattern on DRYS. S2 is significant here and dates back to the second week of June.


COG was an inverted C&H pattern. The key take away here is don't enter the B&B after a wide move into the base. If price doesn't consolidate prior to breaking out, it will after. If it breaks wide, it will most likely come back and retest the base. Either way, patience pays off with a better risk:reward.

[url=][/url]
Posted by Jamie at 7/02/2008 09:11:00 PM 7 comments
Labels: Base and Break, Bearish_Flag, Cup-and-Handle, Flag_Pole, target_trade


Pre-Market
Weaker than expected ADP employment change in June has sold off some of the pre-market futures gains.

Watch for crude inventories at 10:35

Gapping Up:


Earnings - APOL, ARM, UNH, FDO

Other - YHOO, HK, DELL, CHK, FITB, SYMC

Gapping Down:

Earnings - ALDN, TNL, CAR

Other - GM, SOL, LNCR, BP, AYI, MXB

Downgrades - CNI, CP

[url=][/url]
Posted by Jamie at 7/02/2008 08:53:00 AM 0 comments
Labels: Pre-Market
金币:
奖励:
热心:
注册时间:
2006-7-3

回复 使用道具 举报

 楼主| 发表于 2009-3-20 16:31 | 显示全部楼层
Tuesday, July 01, 2008Target Trade (Base & Break) - Fording Canadian Coal Trust (USA) (Public, NYSE:FDG)
The objective of this blog is to identify day trading strategies that deliver based on sound risk:reward principles. It's not a day trading journal. I do take my share of boredom trades like everybody else. But, I see no point in publishing the latter because it doesn't fit with the objective of the blog. Moreover, I generally post three times daily which is a huge commitment and I don't want to waste time on items that may have little interest to most readers.

Thanks to all those who submitted feedback over the last few days either through posting (Thanks Jim!), comments, and/or emails. I've got a backlog of emails so it will take a few days to answer everyone. I plan to get back to regular postings after the long weekend.

Tonight, I'm focusing on a single trade. The midday reversal on GM's sales news probably caught many of you covering shorts as this trade did for me.

The first chart is the daily chart and it highlights a target trade - trading to the pivot point as opposed to trading from the PP. Basically, I was looking for a break of yesterday's low to take me back to the PP base which lined up nicely with the rising daily 20 EMA. Target Trading is something I learned from HCPG.

The 15 minute time frame looked somewhat like a H&S top. On a measured move basis, the 100% Fib. extension from the top of the head to base lined up perfectly with the daily PP target.

The 15 minute chart shows how price broke out of the base and carved out a WRB which closed on its lows. When the BO bar prints wide and closes weak, we know we have an excellent chance of success. There's one caveat though, and that is the lack of a dicernable volume increase on the BO bar. The volume is easier to see on the 1 minute timeframe below. I took a partial at the next support level because normally, this is where price starts to consolidate the last leg down. There wasn't much of a consolidation, before price continued lower. I was almost certain of reaching my target when the second WRB closed on its lows, but I was expecting a consolidation because now price was so far away from the down sloping 5 period ema. Price and the 5 period EMA are like magnets, eventually they always come together.

As you can see from the chart, they decided to get back together sooner than I would have liked. Consolidations can take place through price or through time, or a combination of both. Usually it's a combo and price and the ema share the workload, but in this case price did all the work and the 5 period ema just sat back and waited.

Rule of thumb if there's no reversal stick to foreshadow a retracement or reversal and nothing else to key off of, don't give back more than 38%. 38% is a normal retracement, anything more than that could turn into a reversal.


There was no NRIB, NRB or NR7 on the 15 minute timeframe to setup the trade properly, but this does not deter me from taking the trade if I see an orderly three PP base on the lower timeframe.

Click on the chart to read my notes. I like to see price consolidate in a narrow range before breaking out. If this doesn't look like it's going to happen, I wait for the BO and the retest before committing money to the trade. This avoids getting caught in a head fake which can be quite costly if you are using Point A as your stop.

[url=][/url]
Posted by Jamie at 7/01/2008 09:52:00 PM 13 comments
Labels: Base and Break, Fibonacci, Fibonacci_retracement, Pivot Point, target_trade


Happy Canada Day
Happy Canada Day to all my Canadian readers!

Thanks to all who posted comments last night and this morning. It was especially nice to hear from Trader-X a little over one year since his last official post on the Trader-X blog. Good to hear from you and hope all is well. I know I speak for all my readers when I say you are missed. Thanks to Larry for his blogger insights. It's great to get support from other bloggers.

[url=][/url]
Posted by Jamie at 7/01/2008 03:54:00 PM 2 comments
Labels: Trader-X


Monday, June 30, 2008For The Record - Trading Is In WSW's DNA
As some of you know, Jamie (WSW) has been getting verbally hounded by an Anonymous commenter over whether his trades are real or not. It has gotten so bad that Jamie has reconfigured his blog such that Anonymous comments are no longer accepted. I just want to make a few points and then I will let this go.

1) Over the last several years, I have seen negative (and almost always) Anonymous commenters nag many good/great trading blogs about the validity of their trades. In some cases, I believe the negative comments were a factor in the closing of some blogs. The crazy thing about it is that most of these losers claim to be traders or wanta be traders. Point #1: If you are a daytrader, why would you choose to nag WSW (or any good trading blog) when you could be using the blog to improve your trading knowledge/skills?

2) Let me be clear - I'm certain that Jamie makes every trade that he posts as such. One does not gain the depth and breadth of trading knowledge that he possesses without trading (a lot!). Futhermore, I could care less whether he (or anyone else) posts proof of trades or not. I will not look at them. An early stage trader may need them to prove to himself that SOMEONE (ANYONE) can make money. The latter stage trader knows that it is just he/she and the market. It does not matter what Trader X, Y or Z can do. Point #2: I use WSW's blog and other trading blogs to improve my knowledge and my skills so that I can make profitable trades. I could care less whether the bloggers take the trades or not.

3) I have traded on and off for many years, and currently trade part-time several days/wk. Since reading and studying Jamie's blog, I have improved my consistency significantly. Additionally, I have had enough interaction (via email and blog) with Jamie to know that he is a trader; trading is in his DNA. Speaking of DNA, it was a classic WSW B&B setup at the round number $75 for an afternoon trade. I have included a screen shot showing when DNA hit my scanner (1:00 scanner = 1:45 EST), the 15m chart (right), the daily chart (left), and the execution proof for the early stage traders. Point #3: Anonymous naggers are idiots!


[url=][/url]
Posted by Jim at 6/30/2008 09:44:00 PM 15 comments
Labels: Base and Break, Blogs


Housekeeping
Only registered users can comment on WSW going forward. Sorry for the inconvenience.

Anyone with a Google or Blogger account is automatically registered. Other non-Blogger bloggers are also registered. Basically, the only non-registered readers are those who choose to post comments under Anonymous.

Need Help with this? Click here

[url=][/url]
Posted by Jamie at 6/30/2008 04:54:00 PM 4 comments
Labels: Housekeeping


Pre-Market
Gapping Up:

LDK and CSIQ sign 10 yr. supply contract, other solars showing strength SOLF, ESLR, TSL, ENER is notable exception continued weakness following Friday's selloff.

Energy: HK

Steel: CLF, AKS

Coal: JRCC, ANR

Earnings: HRB

Other: VOD, CPB, FSYS, GDP, HUN, SQNM, CRMT

Gapping down:

MYGN
pre-market gap & fade

Financials: MER, UBS

Airlines: CAL, LUV, UAUA, DAL

Other: ZINC, GU, BCE, AIRM, IGT, HIBB, PCLN

Notable Upgrades - ATHR
buy at Piper and PWAV buy at GS
Last update 9:30 EST


[url=][/url]
Posted by Jamie at 6/30/2008 08:41:00 AM 10 comments
Labels: Pre-Market


Thursday, June 26, 2008NASDAQ Technical Picture - Bears Own It


Markets took a real drubbing today. There were so many catalysts including higher oil, GS sell ratings in C and GM, broker/dealers downgrading each other to a pulp, disappointing guidance from RIMM, ORCL, and NKE, and lackluster FOMC guidance yesterday. In line economic data didn't seem to matter. Except for Gold, everything was awash in red.

More of the same for tomorrow??? As Art Cashin stated this morning on CNBC, the FED may be cutting rates before they raise. The DOW took out support and the SPX is getting close. Will the plunge protection team jump in this time? They don't have much to work with and it likely won't prevent the inevitable for long.

I'm not here tomorrow morning.

[url=][/url]
Posted by Jamie at 6/26/2008 10:44:00 PM 4 comments
Labels: NASDAQ


Newer Posts Older Posts Home
金币:
奖励:
热心:
注册时间:
2006-7-3

回复 使用道具 举报

您需要登录后才可以回帖 登录 | 立即注册

本版积分规则

本站声明:MACD仅提供交流平台,请交流人员遵守法律法规。
值班电话:18209240771   微信:35550268

举报|意见反馈|手机版|MACD俱乐部

GMT+8, 2025-7-21 10:26 , Processed in 0.065771 second(s), 9 queries , MemCached On.

Powered by Discuz! X3.4

© 2001-2017 Comsenz Inc.

快速回复 返回顶部 返回列表