- 金币:
-
- 奖励:
-
- 热心:
-
- 注册时间:
- 2006-7-3
|
|

楼主 |
发表于 2009-3-20 16:13
|
显示全部楼层
Friday, September 05, 2008Pre-Market
Futures lower following jobs data. Global sell off overnight.
Gapping Up: SNDK, UST,
Gapping Down: NOK lowers Q3 outlook - MOT, RIMM, AAPL, QCOM, ERIC, STM ALU in sympathy; select financials MER (cut to sell at Goldman), FNM, FRE, MBI, AIB, DZZ...SID, ABM
[url=] [/url] [/url]
Posted by Jamie at 9/05/2008 09:08:00 AM 0 comments 
Labels: Pre-Market
Thursday, September 04, 2008Weekly Low BO - Ctrip.com Intl Ltd (Public, NASDAQ:CTRP)
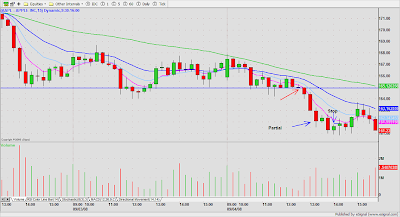
I have been periodically trading CTRP from the short side. Following the earnings based run-up in August, I have been looking for another good short opportunity. The weekly chart below shows price range and volume contraction after the week of the earnings release. Given the weak market, I was anticipating a possible BO of the prior weekly low.
 Below, the daily chart (left) and the 15min chart (right) show that weekly price pivot (PP) level. This morning price tested that level and then formed a 15min NRIB on that key level. The entry was against the NRIB. The fact that the NRIB formed below the opening range low (ORL) and near the down-sloping 5ema added confidence. The weakness in the overall market helped tremendously. I took a partial on what looked to be capitulation (vertical price move on high volume). I then trailed a stop and decided to hold the remaining position for an overnight trade. Closing at the extreme of the daily range (the low in this case) on heavy volume is a valid reason to hold a trade for potential overnight follow thru. Below, the daily chart (left) and the 15min chart (right) show that weekly price pivot (PP) level. This morning price tested that level and then formed a 15min NRIB on that key level. The entry was against the NRIB. The fact that the NRIB formed below the opening range low (ORL) and near the down-sloping 5ema added confidence. The weakness in the overall market helped tremendously. I took a partial on what looked to be capitulation (vertical price move on high volume). I then trailed a stop and decided to hold the remaining position for an overnight trade. Closing at the extreme of the daily range (the low in this case) on heavy volume is a valid reason to hold a trade for potential overnight follow thru.

[url=][/url]
Posted by Jim at 9/04/2008 09:13:00 PM 5 comments
Labels: Capitulation, NRIB, ORL, Pivot Point
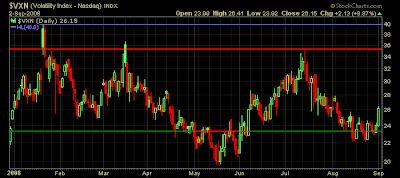
NASDAQ Technical Picture - Bears Own It

 A gap down on weak data and mixed retail sales followed by a 4th successive day of broad based declines for the NASDAQ. After hours, futures continue to stair step lower. Tomorrow's jobs data will likely add to the volatility. Hearing that more hedge funds are liquidating. A gap down on weak data and mixed retail sales followed by a 4th successive day of broad based declines for the NASDAQ. After hours, futures continue to stair step lower. Tomorrow's jobs data will likely add to the volatility. Hearing that more hedge funds are liquidating.
[url=][/url]
Posted by Jamie at 9/04/2008 08:21:00 PM 0 comments
Labels: NASDAQ
Chopfest - Apple Inc. (Public, NASDAQ:AAPL)
 Despite the big drubbing, I found the markets choppy and difficult to find good spots. Here are two trades that worked out. Despite the big drubbing, I found the markets choppy and difficult to find good spots. Here are two trades that worked out.
[url=][/url]
Posted by Jamie at 9/04/2008 04:05:00 PM 6 comments
Labels: AAPL
Pre-Market
Futures testing yesterday's lows following initial claims which were higher than expected. Productivity better than consensus. Same store sales is a mixed bag of beats and misses.
Gapping Up: CLNE, SOLR,
Gapping Down: CIEN, HOV, SHPGY, TEX, HIBB, HRB, PNRA
Crude oil inv. at 10:35
[url=][/url]
Posted by Jamie at 9/04/2008 09:18:00 AM 0 comments
Labels: Pre-Market
Wednesday, September 03, 2008NASDAQ Technical Picture - Dumping Tech
 Weak global demand for energy and commodities is permeating to technology as the NASDAQ continues to sell-off. The demise of the Ospraie hedge fund is likely spreading fear and other funds are probably busy unloading. S&P strength was courtesy of financials and consumer discretionary Weak global demand for energy and commodities is permeating to technology as the NASDAQ continues to sell-off. The demise of the Ospraie hedge fund is likely spreading fear and other funds are probably busy unloading. S&P strength was courtesy of financials and consumer discretionary
Economic calendar: Initial claims, productivity in pre-market; ISM services at 10:00, and Crude inventories at 10:35. Also ADP employment in pre-market.
[url=][/url]
Posted by Jamie at 9/03/2008 10:05:00 PM 0 comments
Labels: NASDAQ
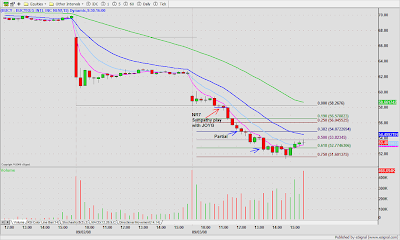
Gapper Dummy Trade - Joy Global Inc. (Public, NASDAQ:JOYG)
 I got a late start to my trading day due to some personal business. The first thing I did when I came in around mid-morning, was check the Trade-Ideas pre-market scans for gappers. JOYG was ripping lower in pre-market due to earnings. At 11:00 - 11:15 both JOYG and BUCY (sympathy play) printed NR7 (TI scan of watch list) on the 15 minute timeframe and that was my cue to get short. Both stocks exceeded the prelim. target (38% Fib. extension of the previous day to the ORL) helped along by lower oil, I suspect. I got a late start to my trading day due to some personal business. The first thing I did when I came in around mid-morning, was check the Trade-Ideas pre-market scans for gappers. JOYG was ripping lower in pre-market due to earnings. At 11:00 - 11:15 both JOYG and BUCY (sympathy play) printed NR7 (TI scan of watch list) on the 15 minute timeframe and that was my cue to get short. Both stocks exceeded the prelim. target (38% Fib. extension of the previous day to the ORL) helped along by lower oil, I suspect.
[url=][/url]
Posted by Jamie at 9/03/2008 04:09:00 PM 4 comments
Labels: Fibonacci, Gapper, NR7
Tuesday, September 02, 2008NASDAQ Technical Picture - Hello Volatility
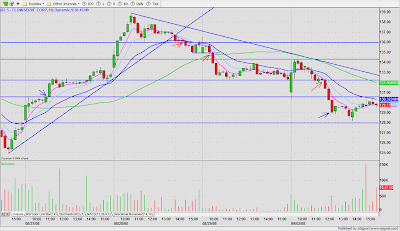
 A huge opening gap quickly turned into fade as oil started to recover from pre-market lows following a less powerful Gustav hurricane than previously feared. Into midday, and as prices completely filled the gap, it appeared as if the market might stabilize and possibly reverse, but shortly after lunch the bears stepped up the pace and volume/volatility accelerated as Friday's supports were taken out. A huge opening gap quickly turned into fade as oil started to recover from pre-market lows following a less powerful Gustav hurricane than previously feared. Into midday, and as prices completely filled the gap, it appeared as if the market might stabilize and possibly reverse, but shortly after lunch the bears stepped up the pace and volume/volatility accelerated as Friday's supports were taken out.
 The above chart of light sweet crude bears watching as prices react to key technical levels. We have just lost the 38% Fib. retracement level and the 200 DMA on a hammer reversal bar. Prices did attempt to rally from the trend line but failed. The next key level if the hammer doesn't follow through is the 50% Fib. retracement level which conveniently lines up with the psychologically significant $100.00 price level. I suspect that the big money is waiting and ready to buy at $100.00 so we should see an important technical bounce. The above chart of light sweet crude bears watching as prices react to key technical levels. We have just lost the 38% Fib. retracement level and the 200 DMA on a hammer reversal bar. Prices did attempt to rally from the trend line but failed. The next key level if the hammer doesn't follow through is the 50% Fib. retracement level which conveniently lines up with the psychologically significant $100.00 price level. I suspect that the big money is waiting and ready to buy at $100.00 so we should see an important technical bounce.
No Pre-Market post tomorrow.
[url=][/url]
Posted by Jamie at 9/02/2008 10:44:00 PM 0 comments
Labels: NASDAQ
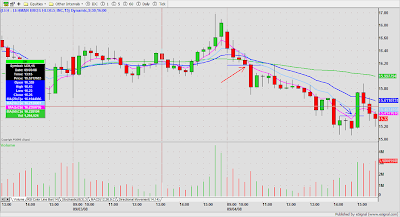
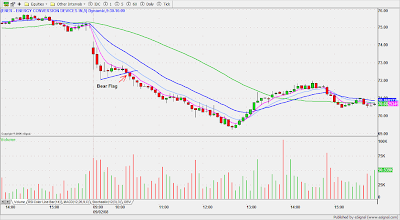
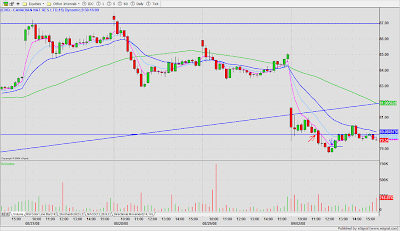
Watch List Trades - Energy Conversion Devices, Inc. (Public, NASDAQ:ENER)
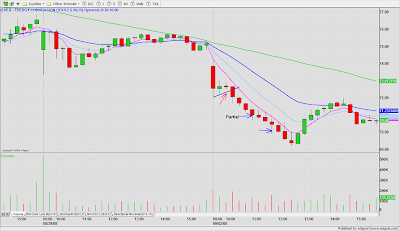 ENER set up a perfect bear flag on weaker oil this morning. I took a partial as price started to retrace and covered the balance as price approached the round $ number $70. ENER set up a perfect bear flag on weaker oil this morning. I took a partial as price started to retrace and covered the balance as price approached the round $ number $70.
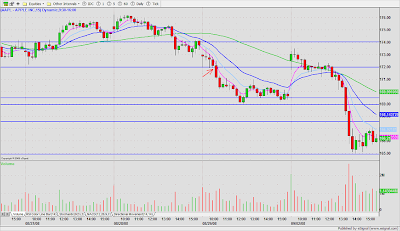 AAPL is a trade from Friday. I had previously mentioned AAPL as a focus list stock at the intraday pivot point $172.00 as significant. Hope you guys had your alerts on. It set up perfectly and my alert warned me that price was in play. I missed the big move today because of a power failure. The power went off some time between 1:15 and 1:30. By the time it came back on and I was up and running again it was almost 2:30 EST and the big moves were in, so I called it a day. AAPL is a trade from Friday. I had previously mentioned AAPL as a focus list stock at the intraday pivot point $172.00 as significant. Hope you guys had your alerts on. It set up perfectly and my alert warned me that price was in play. I missed the big move today because of a power failure. The power went off some time between 1:15 and 1:30. By the time it came back on and I was up and running again it was almost 2:30 EST and the big moves were in, so I called it a day.
 FLS - I've been trading this one daily for a week or so. FLS - I've been trading this one daily for a week or so.
CNQ - another oil play, had nice volume on the BO bar, but no follow through.
Gap Scan Trades - DELL and PETM on Friday were both more or less scratches. LOW was released as a buy stop at $26.64 just as power failure occurred. Happily, price never triggered as markets headed south.
[url=][/url]
Posted by Jamie at 9/02/2008 08:16:00 PM 5 comments
Labels: Bearish_Flag, Pivot Point
Pre-Market
Futures sharply higher as oil plunges following a much weaker Hurricane Gustav cat. 2 vs. cat. 4.
Gapping Up: Select airlines and mortgage/financials also AAPL added to focus list at Piper, LOW upgraded to Buy at Goldman, LEH Korea back in the picture.
Gapping Down: Select oil/gas, metals/mining, and Agchem names
[url=][/url]
Posted by Jamie at 9/02/2008 09:08:00 AM 2 comments
Labels: Pre-Market
Newer Posts Older Posts Home |
|
|
 [复制链接]


