搜索
楼主: hefeiddd

一个笨蛋的股指交易记录-------地狱级炒手

  [复制链接]
 楼主| 发表于 2009-3-20 07:11 | 显示全部楼层
Sweet move in Metal commodities Posted by downtowntrader | 3/02/2006 10:20:00 PM | 0 comments »

There was a nice move in all metal commodities as I expected today. Silver was the big winner today and it looks like it will head higher from here. I don't have much time tonight as I'm charting and playing poker at same time. I'm thinking Aluminum and Basic materials may get a little move next.

Here is the silver chart. I can envision silver trading to top of channel and possibly going over it short term.
Here is SLW which I have recommended since below 5. Might be extended here, but with silver running you never know.
PAL is a good candidate for a breakout.
Oil has gotten a little move lately and still has room, but I think it may stall here.
Nice move here for CMT.
DLB just broke resistance and has room in the channel.
SLB looks good here.
NTAP will push through resistance if Nasdaq makes a move up.
AKS is forming a nice bull flag here.
AL looks like it has bottomed here.

Good Luck,

DT


GOLD Stocks Posted by downtowntrader | 3/02/2006 01:28:00 PM | 0 comments »

I imagine MACD crossed over on GLD ETF today and gold stocks are running like I thought they would. Take a look at GG, NEM, RGLD, and GLG for swing entries. Also, silver and copper is hot. I initiated a stake in PCU and PAL this morning, in addition to my current stake in SLW, GG, and NEM. Good Luck and please do your own DD.

DT


GOLD Divergence Posted by downtowntrader | 3/02/2006 10:52:00 AM | 1 comments »

Gold has been going up and most gold stocks have been falling. I'm not sure why this is happening, but I don't expect it to continue. Looking at the past divergences haven't lasted too long, so I expect either gold stocks to turn up, or a deeper correction in gold to occur. For now, I 'm playing for gold stocks to turn up.
Here is my gold stock of choice. They are the only one that has been going up steadily with gold. I believe the reason for this is Goldcorp's exposure to silver with the stake in SLW (my favored silver play along with svm.to).
Here is NEM's chart, and you can clearly see it pulling back. Looks like we have a possible bounce point here, or if it breaks a little further below.

Good Luck,

DT
金币:
奖励:
热心:
注册时间:
2006-7-3

回复 使用道具 举报

 楼主| 发表于 2009-3-20 07:12 | 显示全部楼层
Wednesday night update Posted by downtowntrader | 3/01/2006 10:38:00 PM | 0 comments »

Strong move today for Nasdaq. Tech's led a charge today and it looks like several names are breaking out. Dow and SP500 lagged today and small cap volume wasn't all that great either. CSCO broke out today and I would look to FFIV, FDRY, and NTAP to possibly run tomorrow.

Basic materials look like they get a bounce up here off the trendline. Big warning here though as volume was pathetic.
PCU looks like it will bounce here after copper's strong move today.
CBST looks like it's breaking out here.
AKS may move if basic materials get the bounce.
JCP continues to show strength.

AEOS reported earnings and management is really being rewarded for sticking by their company and buying up shares at 20. Cleared all sorts of resistance today.
ENG testing trendline here.
HAL is at bottom of channel and showed a little strength.
EZPW looks like a nice triangle break.
KEYS is another triangle break.
Big Triangle break here for MIDD.
TS looks good here too.
Here is a short setup. LMS broke down yesterday and gapped up today and couldn't hold any of it.
I was at the mall the other night and I passed by a Coldwater Creek store. The place was a cemetary. No one was in the store and I watched for a little while, and no one went in. Not one. Not that it means anything, but looking at the chart, CWTR broke down and then had a "Steve Nison" snap back rally, which has a target of the top of base that was broken. It hit target, and now looks like it will pull back. Keep an eye on it.

Good Luck,

DT


BCON Posted by downtowntrader | 3/01/2006 03:35:00 PM | 0 comments »

BCON released news of a successful test of it's flywheel system and is running over 30%. Keep an eye on it. It is up against resistance, but if it can break it, this could be a nice move. Please do your own DD.


Mid Day update Posted by downtowntrader | 3/01/2006 11:36:00 AM | 0 comments »

Market internals look good today and several stocks are breaking out. I can't post charts from this PC, but CLB, INFA, ADAM, and JOYG are all at or near 52 week highs. Good Luck,

DT


Error Correction Posted by downtowntrader | 3/01/2006 08:09:00 AM | 0 comments »

Sorry, but I posted the wrong boom chart last night. I hadn't saved the one with yesterdays closing price. The updated one follows below.
Good Luck,

DT


Goog got the blame... Posted by downtowntrader | 2/28/2006 08:37:00 PM | 0 comments »

GOOG got the blame for todays reversal, but the light volume leading up to the breakout hinted that the Nasdaq wasn't ready to run. Semi's haven't led this move and Nasdaq will go no where without semiconductors. SOX and SMH are still below resistance. I don't think the nail has been driven in the coffin yet but it looks like we have fallen back in to the wedge.
You need to believe in your trendlines. Look at how BOOM has respected the trendlines that have been drawn well in advance. Watch for BOOM's next move.
DRQ looks like it may head lower. Watch for support on recent pivot low, but if it fails, DRQ may head to 200 sma.
Watch BHP here to see how it handles the current channels.
I was looking at GEOI as a possible long, but it's looking kinda shaky.

CTXS showed good relative strength today.
JCOM may not even make it back to top of channel.
PLAY is suffering with the rotten AAPL. Watch for a break of the last pivot low.

We are in a very choppy environment as I've mentioned a lot recently. I can't say for certain which way we are headed the next few days, but I can say that this is not the time to be getting aggresive. Good Trading,

DT
金币:
奖励:
热心:
注册时间:
2006-7-3

回复 使用道具 举报

 楼主| 发表于 2009-3-20 07:13 | 显示全部楼层
BOOM Earnings Posted by downtowntrader | 2/28/2006 08:35:00 AM | 0 comments »

BOOM is trading higher this morning after reporting earnings. Here is my chart as of yesterday with the old comments left in. It looks like it will gap over the falling wedge and previous rising trendlines which should serve as support again. Good Luck to those trading it today.


Quasi Breakout Posted by downtowntrader | 2/27/2006 08:56:00 PM | 1 comments »

Techs and Smallcaps led a rally today, however, as many are noting, volume was pretty ordinary. I am respecting the price action and support/resistance breaks, however, I am playing this move safer then I normally would. Lot's of what I've been posting the past few days has been looking good and some remain in decent entry points. Read back the past few days to look at the charts. Also, if anyone liked the post from btuff, let me know and I will harass him to start posting more regularly. It's different from my mostly technical viewpoint, but worthwhile reading in my opinion. Just a few charts tonight.

CMED may of bottomed out. The daily chart doesn't look all that impressive but they have reclaimed the trendline and will prob. test 50 sma in the next day or two.

CMED Weekly looks better with it bouncing off a trendline and reclaiming the 10 week SMA.
TRCI action was weak today but held above previous resistance.
KLIC may get a bounce off the rising trendline here.
CMT has been forming a nice contracting triangle.
CTXS may of finally cleared this consolidation area.
ABAX had a strong breakout today on good volume.
TRAD looks very good to me here. Volume was good and MACD looks like it will cross back over.

Good Luck,

DT


Newer Posts Older Posts Home
金币:
奖励:
热心:
注册时间:
2006-7-3

回复 使用道具 举报

 楼主| 发表于 2009-3-20 07:14 | 显示全部楼层
Homerun Derby Posted by downtowntrader | 2/26/2006 09:08:00 PM | 0 comments »

One of my stategies is to take a small percentage of my portfolio and allocate it to small caps with high momentum. I never use more then 4-5% of trading capital on any one of these stocks because they can be volatile due to the big spreads and small floats on some of these. But some of these end up being huge winners which more then makes up for the many failed trades. You need to be very strict with your stops as well, because a some of these end up falling hard when the trend fails. Here are a few on my current watchlist.

COGO has some powerful intraday moves and this is one that could make the IBD 100 if it makes it to 15. This one has decent financials behind it.
ADAM looks like it will use previous resistance trendline as support in the near term. This is a motley fool tiny gem.
KLIC is another stock with strong IBD ratings.
SURG is basing in a bull flag.
EGY is another one with high IBD ratings and has worked off it's overbought indicators.
TRCI is yet another one with strong IBD ratings. Looks like it tried to breakout and pulled back, but if it rallies again, it may hold.
NICH looks like it has more room to run here.
Be sure to read my other updates from tonight below.
Good Luck,

DT


Sunday Night Update Posted by downtowntrader | 2/26/2006 08:57:00 PM | 0 comments »

In reviewing the indices this weekend, they actually looked better then I expected. Small caps in particular look decent, although they are right at upper resistance. I have reduced my portfolio to about 50% long and I am sitting on cash waiting for a move to either side while daytrading almost exclusively. In looking at some ETF's, I found two sectors in particular that look poised to move if we get a rally. Banks and Retails. Here are the ETF's for both.

Bank holders broke out on strong volume and seems like it will hold support.
RTH pulled back and had a higher volume doji at the trendline and a fib retrace area. I note that the doji was on higher volume. Sometime high volume on a doji shows a turn, especially when it comes at a trendline or moving average, because it shows that one side tried to make a strong push in a direction and only ended up in a stalemate.
Nice move for WBIC here as it cleared the upper trendline.
JPM looks really good as it moves to a 52 week high.
CHS is testing breakout support and formed a doji at the trendline. Wach for a higher high.
PNRA has formed a nice cup and handle but needs to clear pivot point. Risk takers can buy on break of handle resistance, but need to trade carefully.
JCP is another retailer that has tested breakout support.
COST chart reminds me of SBUX chart, although with a major difference. SBUX breakout was on huge volume, while COST initial breakout was merely a little above average volume.
BBD looks very good as it test two trendlines.
After looking at longer term OIH chart, I'm not too crazy about the near term prospects in this sector. It looks like the sector is in for a little more of a correction. However, CLB has shown some very good strength here.
CONN looks like it is on the verge of falling apart. I would wait for a break of mid 36's.
I mentioned on a couple of occasions that I thought FFIV looked like it was gonna move. They broke out here on good volume.
MFLX looks like it will bounce off the trendline here.
OXPS is another one I have been highlighting frequently lately.
Looks like a bounce off bottom of channel for ICE.
A reader had asked for a DESC chart on 2/9. I drew this chart saying I expected a trip to bottom of triangle, but to watch middle trendline. Look how nice it held the middle zone and then moved higher on strong volume. Still needs to clear upper resistance, but this is a good example of mid trendline support.

Good Luck,

DT
金币:
奖励:
热心:
注册时间:
2006-7-3

回复 使用道具 举报

 楼主| 发表于 2009-3-20 07:15 | 显示全部楼层
Weekly Charts Posted by downtowntrader | 2/26/2006 08:54:00 PM | 0 comments »

I firmly believe that you should look at multiple timeframes regardless of the type of trader you are. I use 5 minute charts for day trading. 15 and 60 minute charts for daytrading and swing entries. I then use daily charts for swings and weekly charts to corroborate what I see on the daily. I then use monthly charts for most indices and commodoties to assess what stage of a trend we are in. Here is a sample of some weekly charts I keep.

I've recommended SLW on several occasions, and looking at the weekly chart it's no wonder why. It will need to correct at some point, but right now daily chart and silver index are pointing to breakout.This is a pretty good exacmple where a weekly chart saved my ass. I was bottom fishing BCON but when the rising trendline was violated, it signaled that it was time to exit. When the horizontal failed, it signaled that it was time to short. This looks real ugly right now.
Gold stocks are looking good right now and the GG chart shows a nice increase in volume as the rend matures.
Here is an interesting one. CKCM broke support on the daily, but is still holding over the triangle on the weekly chart. You have to give priority to the longer time frame charts IMO.

Another thing on weekly charts, I like to use the 10 week and 50 week SMA's and I pay attention to MACD and RSI mostly.
Good Trading,

DT


Thursday Update Posted by downtowntrader | 2/23/2006 10:41:00 PM | 0 comments »

I will be taking a much needed day off tomorrow, so this update will be light. Todays late day reversal showed some weakness in this little rally attempt and at this point it's best to tread lightly until we have a direction. Here are some of my index charts.

SOX looks pretty weak, but has strong support below. Notice how it bumped against the previous support trendline.
DJIA is sandwiched between two trendlines.
Here is my NAS chart with the appropriate trendlines.
Here is my nas chart with fans. I wish stockcharts.com would add fib fans to it's charts. Notice that we may drift down to the fan line.
Looking back at my post last night, we had a few that worked out pretty well. NBIX is one that looks like a solid breakout.
ABAX looks like it is headed higher here.
INFA has refused to go down lately after making IBD 100 for second time. They hit a 52 week high today and I wouldn't be surprised with another 52 week high tomorrow.
MRVL reported earnings after hours today, and the action was wild. They dropped to 59.59 initially and reversed to hit as high as 67.25. They ended at 66.20. Looking at my chart below the descending trendline is near 66.50ish. My guess is that it will open near there but where it goes from there remains to be seen.

Good Luck,

DT


Nice move today Posted by downtowntrader | 2/22/2006 10:35:00 PM | 0 comments »

We had a nice move today in all the major indices. I debated last night as I posted all long charts with indices looking like they were gonna reverse, but the simple truth is, it didn't feel like the right time to initiate a bunch of shorts. We now have most indices poised to breakout, but trade very cautiously as this move has not been strong either. Keep an eye on Nasdaq tomorrow as banks and transports will get no where in the long run without the tech's.

Here are a few quick charts.

I don't like the possible trendline resistance on CHE but clearly broke out on higher volume.
WSO cleared resistance, but on very light volume. MACD looks like it may cross.
CHRW cleared all the noise and looks ready to extend it's gains.
NBIX cleared resistance and RSI back up.
MNST looks ready to challenge for a breakout.
If techs breakout then FFIV should follow suit.
OXPS is inching up.
ZIGO looks like it may test a breakout here.
Congrats to those who played JOYG today after I called for a 52 week high. We got the high, but closed a little weak. Still looks like a healthy move. Here is an updated chart.
Good Luck,

DT
金币:
奖励:
热心:
注册时间:
2006-7-3

回复 使用道具 举报

 楼主| 发表于 2009-3-20 07:16 | 显示全部楼层
JOYG Posted by downtowntrader | 2/22/2006 10:25:00 AM | 0 comments »

It looks like JOYG will hit a new 52 week high today. I think the next intraday pullback can be bought aggresively. Also, MNST looks like it is moving out of it's consolidation base for a retest of 52 week high. Please do your own DD and good luck.

DT


Gold and Silver Posted by downtowntrader | 2/21/2006 11:32:00 PM | 2 comments »

Here are my updated charts on gold and silver. I'm using my GLD etf chart here.

Looks like support held at the 50sma and trendline. Gold stocks have been drifting up. My favored play is GG right now. I also have been holding TRE for this last leg up.
Here is the silver index. I've like silver more then gold this year and silver stocks have been looking good lately. Take a look at SLW, SVM.TO, and PAAS for silver plays. I also like PAL as a metals play.

Good Luck and be sure to see my regular post below.

DT


Mixed Day Posted by downtowntrader | 2/21/2006 10:10:00 PM | 0 comments »

Mixed day today as indices were down on lower volume with market internals more neutral then bearish. I'm not shorting much as I wait for this move to play itself out. OIH is up against resistance but hasn't broken back down yet. Tech is also weak lately, but may be due a technical bounce. Congrats to those playing ADAM and COGO. Look for possible follow through tomorrow.

CMCO looks good as it breaks to new highs.
ASFI is building momentum as it breaks resistance.
GVHR has been building this base for a long time. Just poked it's head through resistance.
DIET pulled back on lower volume, but real story is NTRI earnings. DIET was moving higher after NTRI started running on earnings release.
I've mentioned TALX possibly bottoming out on a few occasions, and it looks like they are confirming support.
SLB looks like a decent energy play as they are not tied directly to oil prices. They provide information systems services to the oil industry.
Looks like CLB had a bunch of people waiting for a pull back.
SAY is testing support here.
SOX looks like it broke the rising trendline here. Support is nearby, but the break of the trendline can't be good.
SMH looks like it is forming a possible head and shoulders. This one also has more support nearby.
MRVL is coming up to support as well. If support fails, it could make a nice short. If it holds, well, then it's a nice entry for longer term traders.
AMD looks very strong compared to the rest of the semiconductors. If we get any kind of bounce in semi's, they will lead the way higher.

Good Luck,

DT


COGO Posted by downtowntrader | 2/21/2006 11:30:00 AM | 2 comments »

Keep an eye on COGO (a stock I mentioned last week) today. Looks like it is breaking out to new highs on a news release. If they manage to close over 15 any time soon they will probably debut pretty high on the IBD 100. Obviously, still a long way to go. They are at 10.30 as of this post, but the chart is delayed.


Charts, Charts, and more Charts Posted by downtowntrader | 2/20/2006 09:46:00 PM | 1 comments »

Interesting enough, I'm not finding that many solid shorts. I expected to find a lot in Oil sector but a lot of them look like they will be good shorts by the middle to end of week. I have a lot of charts tonight so let's get to it.

NBIX looks real nice if you dig deeper and look at the 15 minute chart over the last few days.
ADAM had a breakout with great volume. I would expect a follow through.
BBD has a very nice looking daily chart. Could come back and test the line where it would be a solid buy.
Need to clear recent highs before I would take BLKB.
CONN looks more like a short to me at this point, but I would be watching the support nearby.

ENDP is another one that looks like a short to me although it has had a decent move to reclaim the 50 SMA. Watch for a failure to hold the horizontal trendline.
GEOI is in the wrong sector right now, but chart looks pretty good. If GEOI ever makes it over $15 it will probably make the IBD100. As a side note, IBD has purged a bunch of oil service stocks from the IBD 100. Something to think about.
I've seen a few sites calling for an IBM short, but it look more like a wait and see to me. It can roll over for sure, but RSI downtrend is broken and there is a MACD divergence on the recent low. Also, 200SMA has actually turned up. If 200 falls, then it should test lower wedge trendline. But if upper wedge is broken, then we may have a bottom put in.
IHS look interesting. Sitting at bottom of channel with plenty of upside here.
INFA made the IBD 100 and also had a positive article on Barrons. Chart looks good and could be on it's way to 20's.
IRM may hold steady for a few days, but keep an eye on it.
KLIC may come back to rising trendline, but watch it for a break of the upper trendline.
Nice triangle forming on MIDD. I would wait for a clear break on volume though.
OXPS is also looking interesting lately.
PTRY never recovered from the open Friday, but looks like it may hold double trendline support here.
PWAV had a nice move Friday and may follow through.
STX looks good here.
Thanks to traderjamie over at Wall St. Warrior for TRID. Nice breakout here.
Another Latin Bank here. UBB has an upper trendline to deal with, but overall looks healthy.
VAR has been consolidating in a very tight range and could break out any day.
Also, I try not to repeat the same stocks too often, so try to read back once in a while as some of the ones I post move a few days later. ARBA, DIET, and HANS are recent examples that still look decent.
Good Luck,

DT
金币:
奖励:
热心:
注册时间:
2006-7-3

回复 使用道具 举报

 楼主| 发表于 2009-3-20 07:18 | 显示全部楼层
Monday Night Update Posted by downtowntrader | 2/20/2006 09:31:00 PM | 0 comments »

In looking at the index charts this weekend I am seeing some clear resistance in some and some that are somewhere in the middle. I will post NAS and DJIA charts tonight. Russell, and SP look a little better in the they are not smack dab into resistance.

Here is the NAS chart. It is up against resistance, but MACD looks like it wants to turn up.

DJIA is testing rising resistance line again. It has been rebuffed each time it has tested this line, but RSI downtrend is broken.

By the way I think everyone should read this excellent article that I found courtesy of Roberto over at Nasdaqtrader. Read "Excellent Paul Desmond interview on identifying tops and bottoms" in his Sunday Readings post.

Stay tuned as I will be posting some charts tonight as well.

DT


Sunday Update Posted by downtowntrader | 2/19/2006 03:24:00 PM | 0 comments »

Due to the markets being closed for the holiday, I will be posting my usual Sunday update tomorrow. Keep an eye on CKCM, HD,ORCT on Tuesday as they report earnings in the AM. RUTH, HLF, NTRI and WMT are up in the AH session. WOOF and LNUX, two stocks with recent momentum are also due in the after hours session. Good Luck and have a nice weekend.

DT


Thursday Update Posted by downtowntrader | 2/16/2006 11:36:00 PM | 0 comments »

Nice close for the markets today. Volume is running a little light for a bullish breakout, so be careful. It seems like people aren't diving headfirst into this rally, and we are not out of the clear. Tomorrow is options expiration and as such I won't be trading much. It will be intersting to see how the big guys deal with NVDA and DELL after earnings. Here are some charts to watch. No time for comments on the charts tonight but they are pretty self explanitory. Keep an eye on MNST (listed below). They had unusual traffic AH tonight.


Good Luck,

DT


Resistance Posted by downtowntrader | 2/16/2006 01:45:00 PM | 0 comments »

Nasdaq is pretty close to resistance so be careful of a weak close.


Is it rally time? Posted by downtowntrader | 2/15/2006 10:55:00 PM | 0 comments »

Most of the indices have broken downtrendlines, but Nasdaq is lagging. If tech can't join the party this rally will be short lived. Semi's may carry NAS tomorrow on heels of AMAT earnings. Some of the semiconductors started ticking up after hours. Careful with options expiration looming this Friday. The speculator blog had a nice post tonight on some of the options expiration games to watch for. Lot's of decent looking charts tonight.

RBA is a low volume stock that broke through an orderly cup and handle base.

NSC broke out of a bull flag today.
LVS has a nice looking chart. Today's volume was what you want to see when a stock breaks resistance.
CHRS also broke a cup and handle type base. Needs to clear the gravestone doji to follow through.
PHLY has had a very tight consolidation. This base reminds me of the starbucks (sbux) chart before the breakout.
HANS looks good here but is up at resistance. If you pull up a 15 minute chart on HANS you will see a nice triangle break over the past 10 days. Looks like a prime candidate for a daytrade tommorow.
OXPS is chugging along and may break overhead resistance soon.
TALX looks like it will hold these lows as the bottom.
CHS followed through today on it's breakout.
JOYG has been a horse this year. they had a good bounce off the trendline and fib retrace.
Good Luck,

DT
金币:
奖励:
热心:
注册时间:
2006-7-3

回复 使用道具 举报

 楼主| 发表于 2009-3-20 07:18 | 显示全部楼层
Market Bounce Posted by downtowntrader | 2/14/2006 09:35:00 PM | 0 comments »

I will keep it short since it's Valentines day. We got a nice bounce today and certain sectors look poised to follow through. Tomorrow may be volatile with Bernake deal, so I'm not sure I will enter any swings at all. There are several areas worth daytrading though. I am showing some ETF's to highlight possible sector plays.

First up is Retail Holders. Nice move today on the heels of the oil drop. OIH broke support and if oil keeps falling then retails will surely get a nice move. I like CHS, DBRN, BBY, and ANF here.

I'm showing HHH not because it's a good trade, but because Internets are severly oversold and the H's are at support. There may be some decent trades in YHOO, GOOG, AMZN, EBAY, etc.
Here is the Gold ETF. Pay close attention to everything in this chart. It appears that Gold is bouncing at support and although past action doesn't guarantee us anything, I have to respect the signals given in the past. I like GG, TRE, and NEM as gold plays.
As noted a couple nights ago, Basic Materials are getting their bounce.
Financials are close to breaking out.
Wireless plays may be getting a bounce as well.
PAL is a metal's play that looks tempting here.
I've seen stranger things happen then a stock follow up a steep channel.
TRCI may of broken out of a bull flag. Looks like today was a test of support. Watch for higher high.
QCOM may be the wireless play of choice. MOT also looks like it is getting a bounce.
PWAV looks like a possible daytrade opportunity.

Good Luck,

DT


Charts to watch Posted by downtowntrader | 2/13/2006 10:47:00 PM | 0 comments »

Not much of note today other then another down day but on lighter volume.


Energy stocks were hit pretty hard and OIH is at support. We may get a bounce back here as a lot of the energy stocks have quickly become oversold.
If energy correction continues, ARD may be a short play. They broke support today and without sector support it looks like it will pull back further.
Same story with CLB.
NGAS fell out of the triangle, but true support is near 10. If 10 falls it will probably head to 9 at least.
JOYG is a market leader in the energy sector and have held up very well. They look like they will pull back a little further but are on my watchlist for a long entry.
TRCI may be headed up after a quick consolidation.
DIET consolidating into a triangle like base.
MNST has consolidated into an orderly bull flag since earnings breakout.
SUF made the move up and not down, so can be played long with a tight stop IMO.

Good Luck,

DT
金币:
奖励:
热心:
注册时间:
2006-7-3

回复 使用道具 举报

 楼主| 发表于 2009-3-20 07:20 | 显示全部楼层
EGY Update Posted by downtowntrader | 2/13/2006 09:57:00 PM | 0 comments »

EGY has pulled back to support and if Oil rebounds soon they may have a nice pop.

Daily shows a 38.2% retrace and is meeting trendline.

Weekly shows support nearby.


SLW Earnings Posted by downtowntrader | 2/13/2006 09:42:00 PM | 0 comments »

SLW has been my silver play and they reported earnings tonight. They reported late, so not sure what reaction will be. They also released some news regarding a deal with Goldcorp to trade shares for rights to silver production. This will probably drive the stock more then earnings. Usually any type of share dilution is met with selling, but since this increases their silver production and leaves them with cash for a rumored acquisition, the news may not be sold. Also, SLW had sold off coming into earnings. Here are the links to the news above.

http://biz.yahoo.com/bw/060213/20060213006473.html?.v=1
http://biz.yahoo.com/bw/060213/20060213006466.html?.v=1

Here is the daily showing support nearby.
Weekly shows a nice strong uptrend.


CMED Earnings Posted by downtowntrader | 2/13/2006 08:30:00 AM | 0 comments »

Cmed is moving in the premarket after reporting earnings. Keep an eye on it as they have potential for a nice run. Looks like they are reclaiming chart support.


Sunday Night update Posted by downtowntrader | 2/12/2006 10:41:00 PM | 0 comments »

Nasdaq was setting up for a test of the upper trendline but Barons goog article has the chance to drag the nas down tomorrow. However, I think if the nas and goog in particular opens weak, there is a chance it will rebound and close strong. Looking at the charts this weekend, there is not a whole lot standing out to me. I have a lot that look like possibilities, but usually I have a few that really stand out. I also included more short setups as the market may be weak. I expect the market to be more choppy then trending this week, so I will focus on 1-2 day trades.

Here is the nasdaq chart. Pay attention to the two different fib retrace levels and the trendlines that may be possible support and resitance.

I noticed early last week that IBD 100 stocks were getting hammered. IWM which leads most small caps is looking like it will correct a little. IWM and small caps in general have been the true market leaders of the current bull rally and if they break down, then the writing is clearly on the walls. There is a chance that we are seeing the beginning of a sector rotation out of small caps to large caps, as usually happens in high interest rate environments. The underlying thought is that small caps are more sensitive to the cost of borrowing money and EPS and growth would suffer for them more then the blue chips. Still, we remain in a low interest rate environment and the overall trend is still up for small caps.
Here is a fib fan of SUF that I found interesting. Look at how SUF is holding the 61.8% retrace fan. I would watch for a break either way.
TALX is still fighting support and resistance. Looks like it will fall to me, but I would wait for the break.

CVCO looks good here.
DRQ looks like it will find support here at the trendline and 50sma.

MSTR looks like it may break down here. Watch for a break of the trendline, and then the 50 sma.
PARL tested it's breakout area for support and looks like it held. Watch for a higher high.
UPL looks like a failed triangle breakout.
VLCM may follow through.

Good Luck,

DT


Newer Posts Older Posts Home
金币:
奖励:
热心:
注册时间:
2006-7-3

回复 使用道具 举报

 楼主| 发表于 2009-3-20 07:26 | 显示全部楼层
Boom part 2 Posted by downtowntrader | 2/12/2006 10:29:00 PM | 0 comments »

This is in reference to the boom post below.

Boom tracks the xlb etf fairly well. The xlb looks like it may get a bounce at the 50 day sma (see chart below).

This is a boom chart with the xlb as an overlay.
Here is the xlb daily chart.
If xlb bounces watch for basic materials stocks to possibly get a lift. Keep an eye on ERS as well for a basic materials play.


Boom Update Posted by downtowntrader | 2/12/2006 08:53:00 PM | 1 comments »

Here is a boom analysis by request.

BOOM has fallen pretty hard lately and there could be several reasons. First, Small caps / IBD type stocks have been getting hit hard lately. Second, Steel / Industrial Materials have also been hit hard lately. Third, BOOM earnings are coming soon, and some are worried about guidance given on the last call. Whatever the reasons, it doesn't matter as there are more sellers then buyers, plain and simple. BOOM has broken some short term support, but the long term uptrend remains in place. It is very hard to say which way it is going in the near term, but there are some clear lines of support and resistance on all the charts.

We'll start with a fibonacci retracement and fan chart. I used the low of the last correction. The 38.2% retracement is near 28.52 and may hold. Next stop would be near 26. Looking at Fans, the 38.2 gave way, but they are not like horizontal trendlines. They are more like magnets and Boom may try to follow it back up for a small bounce. It looks like it may try and follow the 38.2 up and then give way to the 50% fan. Look at my previous post on how I usefans.

Daily chart: Boom broke the long term uptrend line and the 50 sma. There is a possible downtrend channel that shows possible support near 26-27. There is also gap support near the same area. There 61.8% fib retrace of the last leg up also points to the same area as possible support.

The weekly chart has given a SAR sell signal. Support looks to be at 25 and then 23 as a worst case scenario.


My thoughts are that boom is near support and may bounce around for a bit. There may be a short covering move before earnings, but it looks like there will be no strong move till after earnings. As a disclaimer, I do own my core of boom but have long since sold my traders.

DT


Choppy Day Posted by downtowntrader | 2/09/2006 10:56:00 PM | 1 comments »

Today was a prime example of why I have been saying to take profits quickly lately. Traders are getting spooked easily lately and any Fed speech, Yield Curve BS, Iran headline, terror alert rumor, and job and oil numbers are moving the markets one way or the other. I have been trying to keep trades limited to mornings and afternoons. I entered three swing trades as noted in today's earlier post and was stopped out of one (ISIL) and the other two reversed to near my buy points(POWI and PWEI). I decided to give PWEI and POWI the benefit of the doubt because they are in hot sectors and they both have PWandI in the name ;) . I saw a lot of hammers yesterday and today I saw a lot of gravestone doji's. This tells me I am probably better off playing golf tomorrow rather then trading. Lot's of charts today so let's get to it.

I blew it on my natural gas call a couple weeks ago and I'm gun shy about shorting energy stocks now, as they are quickly becoming oversold. But the following few charts are worth watching.
CLB has triple support here, so if it's gonna bounce it would be here. If it fails, it is a solid short.
GRP is a mutual fund darling, and they may be heading out the door. Failed to hold 50 sma and if the trendline breaks there is some room to fall.
OIS is holding the line, but dipped below and todays rally failed miserably.
A reader asked me to analyze DESC. I would not take a position either way right now. My analysis is on the chart.
MIND is right at support. Watch for a break either way.
BNT looks like a short to me. This is one of the many stocks that were looking like longs that failed.
CTRN is worth watching as two trendlines broke down.
GILD is another long that broke down. This is a sign that markets are deteriorating.
And now for the few longs left. Chips are holding up although SMH looked bad today. I daytraded MRVL today for over 1 point and noticed that it didn't want to give up it's gains. Chart is improving.
PETS followed through as I suspected it would. I think we may get another day or two up.
SWSI is having a battle right here. It had a false breakdown and a false breakout. Watch for the next move.
VLCM looks like it started a breakout and then it died down when the markets reversed. Watch to see if it follows through tomorrow.

Lot's to digest here. If anyone has questions for me on my charts feel free to leave a comment.
Good Luck,

DT


Quick Intraday Update Posted by downtowntrader | 2/09/2006 11:59:00 AM | 1 comments »

Market Internals look decent today and I see some decent movers on the day. I have lightened up on a few things, but did initiate the following positions.


金币:
奖励:
热心:
注册时间:
2006-7-3

回复 使用道具 举报

 楼主| 发表于 2009-3-20 07:27 | 显示全部楼层
Wednesday night update Posted by downtowntrader | 2/08/2006 09:54:00 PM | 0 comments »

Indices had a good day today, but there was a lot of stuff being sold too. For some reason I am seeing a lot of IBD 100 stocks getting hammered. IWM was up today but a lot of small and midcaps were down. Tomorrow will be interesting to see if we get follow through or if people take their profits and run. Here are a few charts.

PETS has been consolidating in a tight range since the earnings breakout.


AIZ reports earnings in the AM. They dipped back in the triangle but rebounded off the trendline.
ADAM had a nice move and is challenging it's high.
DGIN looks like a short to me if the markets are weak tomorrow.
ISIL is not giving up any ground lately.
DIET may of bottomed and could head back over 8.
PARL had a breakout day and closed above resistance. Should follow through in the coming days.
POWI looks like it will breakout of a pennant if semi's are strong tomorrow.


Also, keep an eye on ABAX and SBUX tomorrow. SBUX got a pump from Cramer tonight.
Good Luck,
DT


Tuesday Update Posted by downtowntrader | 2/07/2006 10:24:00 PM | 0 comments »

I was out all day so I didn't get a good feel for how weak the market was today, but do see a lot of technical damage on most indices and etf's. Markets a getting oversold, and we may get a bounce as soon as tomorow. Looks like people were happy with CSCO earnings and they were up AH. A quick look showed a lot tech's up in sympathy, so we should at least get a strong opening on the nasdaq. I will be looking to BRCM, FFIV, and MRVL for day trade opportunities tomorrow. Here are some other charts that may be interesting tomorrow.

MNST has been holding a lot of the breakout gains, and although I expected a further pullback, we may not get it.
FFIV may get a boost from CSCO.
OXPS got a Cramer pump last night and was trading over 30. I will wait for a pullback tomorrow and see if an opportunity for a trade arises.
MRVL was at 68 AH. They are sitting on support and about to meet a rising trendline.
CTXS has pulled back to near the ascending trendline. They were profiled on Wednesday's IBD.

Keep in mind that the indices are damaged right now. If you get a good move in your favor, it wouldn't hurt to take some off the table. We are not breaking all resistance overnight, so you will get opportunities to get back in if a stock shows continued strength.
Good Luck,

DT


VPHM Posted by downtowntrader | 2/07/2006 10:10:00 PM | 0 comments »

VPHM hasn't broken resistance yet, but it looks like it may. They have cleared the gap resistance which should serve as support now. They had positive news but the overall market weighed down on them. Keep an eye on the resistance lines the next few days.

The weekly chart shows VPHM may of cleared a level of resistance and is consolidating that move.

Here are VPHM's IBD ratings.
Here is VPHM's short position.

Please do your own DD as the above is only my opinion.
Good Luck,

DT


Charts Posted by downtowntrader | 2/06/2006 09:08:00 PM | 0 comments »

Here are some charts to consider. Congrats to those that played CKCM with me. Nice breakout today and may just be starting the run. Others in my portfolio that looked good today were SBUX,REDF, and EGY. Keep an eye on most of the stocks from last nights post as a few are looking like they will move higher.

Also, please click on one or two ad's if you like what you see on my blog. I appreciate the support.

BNT has consolidated above the breakout point and is starting defend support.
GLG:Not to crazy about gold in the very near term, but this stock is acting well.
TRE may be worth playing if GOLD takes off in the next few days and TRE hold support.
FFIV is trading tightly near a breakout point. Maybe CISCO earnings will push it (or kill the sector all together).
GILD: Still holding above breakout area and meeting the ascending trendline.
GOL: Ticked a little higher today.
INFA: Consolidating into a bull flag.
MRVL: Still probing for support here, but may be ready.
I also posted an update earlier which can be found below.
Good Luck,

DT
金币:
奖励:
热心:
注册时间:
2006-7-3

回复 使用道具 举报

 楼主| 发表于 2009-3-20 07:28 | 显示全部楼层
Do we still have the same Market Leaders? Posted by downtowntrader | 2/06/2006 08:12:00 PM | 1 comments »

We are having some interesting action in a few "market leaders". Sometime's when market leaders falter, it could be a signal of a market top. Think back to the weeks leading up to aapl, goog and even hans earnings. Analysts didn't have enough good things to say about them, with upgrades and increased price targets. I want you to stop and think about something. Why does an analyst upgrade a stock or increase the target? If they don't own the stock or are buying more, why would the upgrade it? This would just increase the price they have to pay for it. They need buyers to unload their shares, so they upgrade it. Sometimes, there are other institutions that are buying, and sometimes the upgrading institution just wants to pare down the position and the stock chugs along. However, in January, everyone was pumping aapl and goog. If that many instituions felt that strongly about them, then why did they let them slip past the 50 sma (typically a buying point for institutions) so easily. Some people say, well earnings were disappointing, but the name of the game in the stock market is percieved future earnings, not past. Some institutions are worried about the near term future, and decided to lock in their substantial gains. If institutions that typically scarf up shares of market leaders at the 50sma are now letting them slide by, then there certainly is a danger of a market top. However, there is a debate to who the true market leaders are. Some would say the small and even mid caps have been the true market leaders. This could certainly still be the case and we may just be having a rotation take place in a few stocks. The IWM etf is still looking decent, and the SP600 is in much better shape then the other indices. If we are indeed rotating market leaders, then a case has to be made for who the replacements will be. I have listed some charts of possible market leaders moving forward, and interestingly, chip stocks are what's been being bought on dips. Look at AMD, NVDA, and BRCM's charts for proof. The key point here is to not be blind to the possible rocky road ahead. No one can call an exact market top or bottom consistently, but when there are warning signs, it makes sense to be cautious. Here are the charts of the stocks mentioned.


Good Luck,

DT

keep an eye out for another post tonight with a few charts.


Charts of interest Posted by downtowntrader | 2/05/2006 11:05:00 PM | 0 comments »

The markets are at a crossroads right now. I am seeing conflicting signals in the indices so I am tightening my stops and I will keep my trades shorter in time frame. I still don't feel it's time to go predominantly short, but I am seeing some more short setups. Here are some interesting charts from this weekends scans.

Keep an eye onQSSI for a breakout. There is a chance it pulls back and forms a triangle.
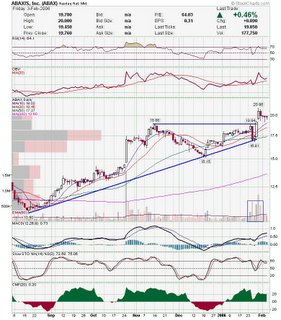
ABAX is showing an aversion to dropping below the breakout point. It's a buy if it makes a higher high in my opinion.
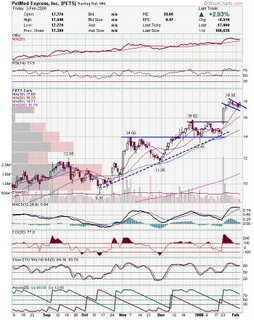
PETS is pulling out of a quick bull pennant and may be good for a 2-3 day swing.
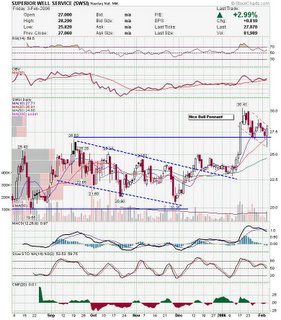
Nice bull pennant on SWSI. Wait for the break of the trendline.
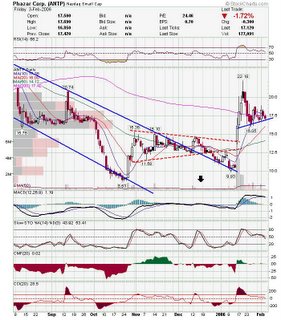
ANTP is forming a very loose pennant type consolidation base, and could have a breakout. With the base this sloppy, I would be quick to lock in profits.
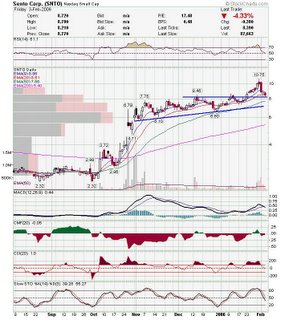
SNTO broke out of a nice triangle and is pulling back to test breakout area. Keep an eye for a bounce.
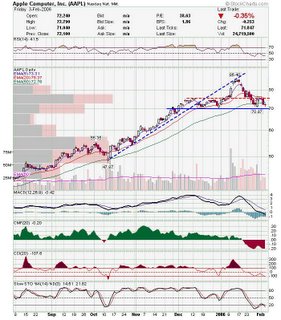
Is AAPL still a market leader. We will soon find out. It is looking pretty weak and is setting up for another test of support. Keep an eye on it for a bounce or breakdown.
DIETS is consolidating substantial gains, and formed a nice hammer. May be ready for a little bounce.
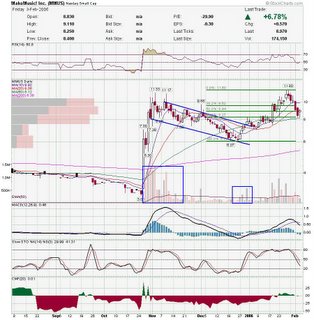
MMUS is a chart I highlighted a few days ago as a possible cup and handle base forming. I think this is the bottom of the handle (61.8% retrace) and that it will resume the uptrend here. Watch for a breakdownnear previous pivot low.
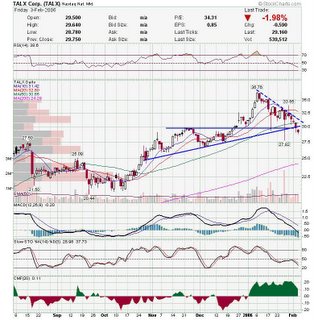
TALX had defended the 50 day sma aggresively twice in the past few weeks, but failed to do so again. Now we have a broken trendline. This could be headed toward 200sma.
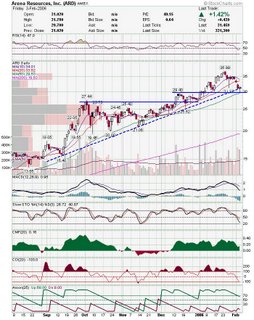
ARD is sitting right on support. Watch for a break to either side.
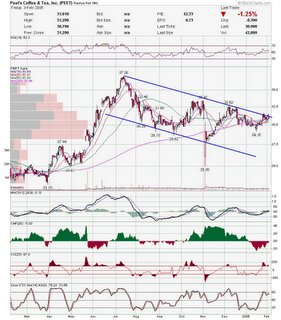
PEET is right at top of channel and struggling to overcome resistance. Could be headed lower if it fails to hold SMA's.
If you're looking for more charts, swing by Roberto's Nasdaqtrader blog (link on my sidebar). He posted a bunch of charts this weekend.
Good Luck,

DT


Great day for MCX Posted by downtowntrader | 2/03/2006 06:01:00 PM | 2 comments »

MCX finally closed over 15 and should debut pretty high on the IBD100. I've been posting on them quite a bit lately and the past 2 days have shown a remarkable increase in volume. Not only did they close over 15, they almost challenged their 52 week high. If they make it high on the list, 16's should be eclipsed rather quickly. Here are my updated charts.

Daily looks great and MCX clearly broke a nice base on strong volume.
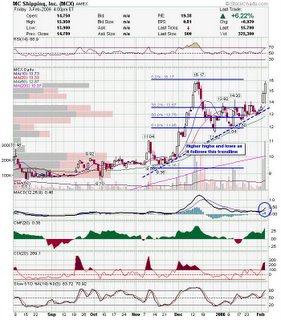
Weekly looks nice with increased volume in the second base.
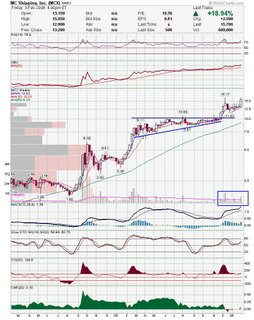
Congrats to those who played MCX with me and good luck in the coming week.

DT
金币:
奖励:
热心:
注册时间:
2006-7-3

回复 使用道具 举报

 楼主| 发表于 2009-3-20 07:29 | 显示全部楼层
Stocks Holding up Posted by downtowntrader | 2/02/2006 09:41:00 PM | 0 comments »


CKCM was down early and retested support, but finished well.

MCX was up all day.
ABAX has been finding support in low 19's. Watch for next higher high.
CRI tested support and reversed pretty good.
ESRX is absorbing a lot of profit taking.
GOL is pulling back to support. Held up today and may be ready to resume uptrend.
GILD gapped lower and held up. It is holding over the breakout point.
RELV did not want to go down today and is holding the ascending trendline.

Good Luck,

DT


Wednesday night update Posted by downtowntrader | 2/01/2006 09:32:00 PM | 2 comments »

Nice day for indices today. I am seeing more and more good looking charts lately which may be telling us there are more good times ahead. Be sure to read my previous post's as I posted intraday for a change today.

ERS is too over extended to recommend as a swing trade, but it may present decent opportunities for trades the next few days. They were profiled on IBD tonight and should remain #1 on the IBD100.
FFIV looks good if nas can break out.
FDRY also looks good if nas holds up.
HANS pull back may be done.
MRVL is setting up for the next leg up. Doji today near expected support.
RELV is setting up for a bounce off the trendline.
CTSH Profiled on IBD tonight and close to breaking out of this base.
ADAM broke a pennant type triangle and may retest or overtake highs.
This chart looks good but may be a little extended from the breakout area.
APLX looks good breaking out of channel on high volume. Careful as earnings are 2/3.

Good Luck,

DT


SBUX Update Posted by downtowntrader | 2/01/2006 04:21:00 PM | 0 comments »

Starbucks handily beat estimates and was trading higher in after hours trading.


Here are my updated charts on SBUX. I've recommended SBUX on a few occasions as I felt it would break out this sideways consolidation based on the support it was getting near 30. Looks like earnings are enough to break out of this consolidation and take SBUX to it's first target of 36.

Here is the daily chart. RSI downtrend is broken and MACD has crossed over. Look at last MACD cross.

Weekly chart yields a much larger target of 43.
Here is a snapshot of SBUX's short position. It would take 4.4days for shorts to cover at average volume.

Please do your own DD before initiating a position.

Good Luck,

DT
金币:
奖励:
热心:
注册时间:
2006-7-3

回复 使用道具 举报

 楼主| 发表于 2009-3-20 07:30 | 显示全部楼层
MMUS buying opportunity Posted by downtowntrader | 2/01/2006 02:36:00 PM | 0 comments »

MMUS looks like it is forming a cup and handle base and today touched near the 50% retrace of the right side of the base. I think, this presents a buying opportunity for those willing to be aggresive. Others may wait for the next higher high. MACD is crossing over, so I expect it to trade more sideways for a bit. But this could be the bottom of the pullback.


QDEL Bottom being put in? Posted by downtowntrader | 2/01/2006 10:23:00 AM | 0 comments »

QDEL is coming off a bottom and may be headed back up. Looks like a double bottom with a break of the down trendline. This looks like a play that will take a little time to develop, but ultimately should prove profitable.

On the daily, I am looking for a rebound to the 38.2% retrace and 50sma as a minimum. The 50% is also in play, before waiting to see how it shakes out. Every indicator is diverging with the second test of support, and Slow stoch has crossed back from oversold. AROON also is holding it's crossover.

The weekly seems to support my theory of a bottom being put in. QDEL stopped on the 50% retrace of the larger leg up. Look at past big winners and you will see they ALL had these types of pullbacks. In the grand scheme of things, these shakeouts are healthy for a stocks longer term uptrend.


This is only my opinion, but I think QDEL makes a low risk / high reward play right now. Please do your own DD before commiting money to it.
Good Luck,

DT


Quick Update Posted by downtowntrader | 1/31/2006 08:35:00 PM | 0 comments »

Just a few charts tonight. Not sure what tomorrow will bring with most stuff down after hours with GOOG disappointment, but a few stocks still look decent. A lot of what I have been mentioning still looks good such as CKCM,CMED,SLW,CME and most of the gold stocks I mentioned. Keep an eye on the indices tomorrow for a retest of support. Also, looks like Bush will focus on Oil tonight and the need to use alternative energy sources. This could cause a run in the alternative energy stocks.


Good Luck,

DT


More charts Posted by downtowntrader | 1/30/2006 10:33:00 PM | 0 comments »

If anyone remembers my natural gas post (http://downtowntrader.blogspot.com/2006/01/natural-gas-plays.html), i mentioned that I thought natural gas was bottoming. Looks like it may start moving higher, and most of the charts I posted back then are looking good. Read back on that post for more charts, but I have listed a few below. Be careful as tomorrow will probably be choppy with FED meeting, Goog earnings, President's speech, etc. Lot's of disruptive forces at work.

I also posted a Gold update previous to this post.

Nice Triangle. Target would be around 19.
ABP has been fighting with a trendline for months. Looks like it may follow through.
XTO held above breakout level and hit a new high.
Here are a few couple non oil/gas charts.

Good Luck.


Gold Stocks Posted by downtowntrader | 1/30/2006 10:29:00 PM | 0 comments »

I was thinking gold would pull back but it is up again and gold stocks are breaking out. Careful of a top reversal, but at this point we have to assume gold will move.


金币:
奖励:
热心:
注册时间:
2006-7-3

回复 使用道具 举报

 楼主| 发表于 2009-3-20 07:31 | 显示全部楼层
Charts Posted by downtowntrader | 1/29/2006 09:17:00 PM | 0 comments »

Lots of charts tonight, and most look very good. Not sure if this is foretelling for the market. I think we are in a precarious position here as far as market health is concerned. I would be worried about a top here, until the markets prove otherwise and make new highs. I am being quick to take profits on some of my newer positions.

NWRE: May be breaking out here. Earnings are 2/1Nice bounce off the lower trendline here.
long consolidation for esrx.
Nice volume for BNT as it takes out resistance.
CTRN also has had a good volume increase.
FDRY also had volume as it breaks a trendline and earnings are out of the way.
NTRI has possible resistance above, but has been a high flyer before.
POWI may break out of a pennant type formation.
Another pennant type formation here for QCOM.
BOOM has been trading in a tight range and just broke to a new high friday. MACD crossing over.
CMED pulling back to a possible trendline.
SWSI is a thinly traded stock that has broken a trendline and is now testing support. Looks like it is headed back to test the high.
ZYGO broke out but reversed. Look for a test of the trendline and a possible reversal back up.

Lot's of charts to digest, but I'm sure some of these will be nice movers this week.
Good Luck,

DT


Newer Posts Older Posts Home
金币:
奖励:
热心:
注册时间:
2006-7-3

回复 使用道具 举报

 楼主| 发表于 2009-3-20 08:45 | 显示全部楼层
Here is the daily chart. The upper sloping trendline from a larger triangle has been broken. There is still resistance to 29.20 and CKCM is still in the process of testing the trendline as support. The 20SMA just crossed over the slower 50SMA.
Here is the daily from a fibonacci fan perspective. While CKCM is by no means in the clear, they are attempting to break the horizontal trendline and trade near the 50% fan line.
The weekly clearly shows a break of the trendline resistance. RSI has been sloping down as it consolidates. I wouldn't count this as the typical negative divergence as CKCM is really trading sideways and not up on the weekly. RSI is near breaking the trendline resistance as well.

Now for my disclaimers. I really don't like they way CKCM trades. It is very volatile and for those trying to daytrade it, there is a tendency to get chopped out. I think there is a realistic chance that CKCM could fail, but it looks to me like most charts are showing strength, and with earnings coming soon, and the huge short position, CKCM has more reward then risk at this point. I have already taken a position in CKCM and will add if it breaks my resistance lines. Please do your own DD. I will be adding some fundamental analysis from btuff in the coming day or two. Also, I will post my usual charts later tonight.
Good Luck,

DT

Rally Resumption? Posted by downtowntrader | 1/26/2006 09:22:00 PM | 0 comments »

We are not out of the woods yet, but with BRCM, MRVL, and MSFT up after hours it looks like tech will lead the way again tomorrow.

Nasdaq still needs to clear the trendline, but the technical picture doesn't lool too bad. Look at the convergence of the trendline and the fib retrace.
With an eye on tech's, it looks like FFIV will attempt a new 52 week high tomorrow.
CTXS pulled back from the gap up high and tried to fill the gap on the downside. Stopped short and looks like it will start a run towards the high.
Congrats to those who have traded in to SLW with me. I have posted the chart on several occasions. This looks very bullish for silver stocks.
SBUX is looking like it will break it's long time consolidation. I am showing two charts below showing why I think it will break. First is a fib fan of the daily chart. Look at how SBUX is starting it's move off the 50% line.
This chart shows a nice orderly consolidation and RSI broke the downtrend. MACD looks ready to cross and SBUX held support at 30.
CKCM tested support today and finished above it. Tomorrow should be the follow through day.
Nice break of the triangle for AIZ. I keep seeing AIZ on the gorillatrades ad's on IBD and they have good IBD ratings.

For daytraders: I think BRCM and MRVL will provide excellent daytrading opportunities tomorrow.

Good Luck,

DT


Quick Update Posted by downtowntrader | 1/25/2006 10:26:00 PM | 1 comments »

Still dealing with a family emergency so I am just posting a few quick charts.

TALX beat earnings estimate afterhours.
I've been posting CME pre breakout charts the past week or so. Watch for the next move up.
CKCM broke long time resistance and needs to follow through.
SLW hade huge volume and cleared resistance.

Good Luck,

DT


No update tonight Posted by downtowntrader | 1/24/2006 03:59:00 PM | 0 comments »

Due to an emergency there will not be a post tonight.

DT


SUF Again Posted by downtowntrader | 1/24/2006 09:19:00 AM | 0 comments »

For those looking to me for a SUF update, unless it reverses strongly at the open, I believe SUF will close below my trendlines and therefore be broken. I will look to exit my position and then track it. Good Luck,

DT


Will these breakouts hold? Posted by downtowntrader | 1/23/2006 09:12:00 PM | 0 comments »

I am more then a little wary of stocks that are breaking out in the current market environment. At this point I am looking for stocks that can possibly buck the general trend if the market does deteriorate further. The reason I am still looking long is that we are still technically in a rally and shorting (for a swing) at this point would result in being chopped out I believe. Here are a few that may be able to sustain the breakouts.

XTO held above the support line and is in a good sector. Weekly chart looks good too.
CRI broke out in a big way today.
Weekly looks great.
PETS reported earnings today and took off. The reason I think they can follow through is that if PETS closes the week over 15 they should make the IBD 100 list again. They debuted pretty high on the list last time and looks like they will close over 15.
Weekly looks OK.
I've been posting a lot on MMUS but today was another strong day for them with a new closing high. Volume is building so 52 week high may may be next.
Congrats to those who traded these picks.

DT
金币:
奖励:
热心:
注册时间:
2006-7-3

回复 使用道具 举报

 楼主| 发表于 2009-3-20 08:46 | 显示全部楼层
SUF Update Posted by downtowntrader | 1/23/2006 08:30:00 PM | 0 comments »

Well SUF took a pretty nasty haircut today. I didn't expect it to fall this hard on a negative article of all things. This reacted like it was being investigated by the SEC or like a biotech whose drug had killed someone. My normal strategy when a stock gaps down this severely is to wait 5 minutes and see if it will reverse. I treated SUF differently for a couple reasons. First, I had locked SUF earlier that my core position is comprised purely of profits. Second, I thought this reaction was a little overblown and my weekly chart was still holding up. I ended up selling half at 13.55 when it made a new 30 minute low. I bought them back and then some just under 10 as I expected 10 to hold based on my daily and weekly chart. It almost retraced a full 61.8% which also coincides with two trendlines I have drawn. It held all the trendlines and is near 10 week average as well. I sold some traders at $12.30 when the mid day rally finally fell apart. All in all, I can't be disappointed as I was able to recoup some losses and actually lowered my average cost on my existing shares, but it does suck to have a stock move 47% down against you. I will probably exit if it violates my trendlines though. Hopefully some of you didn't get hurt too bad with this move.

DT


Natural Gas Plays Posted by downtowntrader | 1/22/2006 09:52:00 PM | 1 comments »

This is my third post of the day so be sure to read the previous posts.

I found a lot of intersting natural gas plays this weekend and I've been thinking that Natural gas has been oversold for some time. Although it doesn't look like we will have a cold spell anytime soon, the natural gas futures chart looks like it has bottomed.

Here is a six month chart of the natural gas contract. It hasn't been this oversold in quite some time.
NGAS may move if it breaks this large triangle.
CHK always runs with natural gas prices and insiders can't get enough shares.
EOG broke the bearish wedge, so let's see if it can follow through.
DVN broke a cup and handle type base although it still has a little overhead resistance.
IVAN has retraced 38.2% and could explode here.
XTO may be the prettiest chart this week. They broke a pretty nice base and MACD just crossed over.
I may be early on this, but this many charts in the same sector looking good at the same time looks very promising to me.
Good Luck,

DT


Interesting Charts Posted by downtowntrader | 1/22/2006 09:33:00 PM | 1 comments »

Here are some interesting charts to look at. Funny enough but I am seeing a lot more long charts then short. Some of these could go either way as they are charts where stocks have fallen to support.

CRI Looks ready to break this contracting triangle base.
CWTR could go either way but 19's has proven to be support.
GFIG looks interesting here as bulls and bears are at a stalemate.
HANS has pulled back to the gap up. Let's see which way it continues.
JCOM looks very good here, especially if market attempts a rally.
PTC should have good support here.
RELV debuted on IBD 100 this weekend.
QDEL may be ready to turn back up here.

I am not posting my short targets as I think we are not ready for swings on the short side. I will wait for an attempted rally and if it fails use it as a shorting opportunity.

Good Luck,

DT


SUF - Pump and Dump?? Posted by downtowntrader | 1/22/2006 12:08:00 PM | 2 comments »

Initial Disclaimer: I have been in SUF from near 10 and continue to hold a position.
金币:
奖励:
热心:
注册时间:
2006-7-3

回复 使用道具 举报

 楼主| 发表于 2009-3-20 08:46 | 显示全部楼层
Volume patterns can more easily be seen in weekly charts IMO. The big picture can more clearly be seen and the distinction between up and down volume is also more clear.

BOOM: Look how boom volume exploded from near nothing as it started it's run. Boom had a couple nasty pullbacks, and I bet there is a long list of traders that are upset they got shaken out on those pullbacks.
TIE: They had a little more volume before the increase, but nonetheless there was an large increase each time it has taken a step forward.
HANS: HANS had a little mini run and then the volume poured in much like SUF did from 3-5 then volume poured in. HANS had some good shakeouts early too, but once the story was known, it was pretty smooth sailing.
Here is a daily chart of HANS from the period of the initial breakout.
Which brings us to my SUF charts. Here is the weekly chart which shows a spectacular jump in volume as it more then doubles in price. Look at how volume started creeping in before the move. Someone knew something. Is this a pump and dump... I would think not as the amount of the float has been traded many times over.
Here is my daily chart. This has been trending up at just a little over 45 degrees which is not too steep. Are we due a pullback, probably. I have support near 15 and I doubt we will drop below that in any pullback, however.. we could pullback all the way to 11ish or we could blow right through 20 and pullback later. We could also consolidate sideways. I for one, will wait for the patterns to develop and make my decisions based on the charts and not on hype and fear.
I apologize for this long winded post, but I think a lot of traders get shaken out without trying to determine what they are really trying to accomplish with a certain trade. If a trader is playing for a quick swing, then they should of sold SUF already, or at least taken partial profits. I will disclose that I have already sold my "traders" and will hold my core for the time being. If we get a dip, then I will be ready. If we continue to move up, thenI am happy with my position. I will only sell out of SUF if I see a complete erosion of the chart. Good Luck,

DT


PS. Other stocks that are showing similar Volume patterns are MMUS, and possibly DIET, and HAUP. There are others but I think MMUS shows the most similarity as it has sustained the increased volume for 13 weeks now. If anyone has similar stocks, feel free to leave a comment.

Pretty Ugly day Posted by downtowntrader | 1/20/2006 04:31:00 PM | 2 comments »

I won't be posting till Sunday night, but I will say that today was pretty ugly. In December, this is the call I made, that we would rally in January and then pull back, but after the strong run we had, I was thinking I may of been wrong. Initially, it looks like the market is setting up for a possible head and shoulders with the next rally being the right shoulder on SP and NAS. I will try to analyze the indices this weekend. Notice that some stocks held up pretty well today and those should be the first to move when we get a bounce.

Have a good weekend,

DT


NAS Island and Is Cramer reading my blog? Posted by downtowntrader | 1/20/2006 12:23:00 AM | 0 comments »

Nasdaq may of formed an island gap reversal today. I am showing it on the hourly cause it is easier to see the gap area. Notice the gap down on Wednesday and the gap up on Thursday leaving the Wednesday session in an island. This is bullish and should provide support until there is a CLOSE below the gap up. The only caveat, is I like islands near the bottom of a downtrend or top of an uptrend. This is after a pullback and may not hold the same strength.
Well, I am seeing that Cramer gets a lot of his ideas from IBD. I posted on VAR earlier this week as an earnings play and PRAA as a cup and handle breakout candidate and funny enough Cramer pumped both of them tonight. Luckily I was in VAR already, but I will probably leave PRAA alone for a few days. I will probably milk this run and get out before earnings on 1/25. Here are the charts on both.

Here is another that I have been profiling lately. Looks like it wants to break out here.
HAUP:Here is a high flyer that is testing a trendline.
MDCC:Looks good here after testing trendline. Watch for a break over the consolidation base.
RACK: Testing a trendline here and they have been hot.

Tomorrow will be a tricky day with options expiration and indecision over today's rally confusing traders. I will stay away from most plays tomorrow.
Good Luck,

DT


Late night update Posted by downtowntrader | 1/19/2006 11:38:00 PM | 0 comments »

I will be posting an update tonight, but it is later then usual.

DT


Two Gaps Down? Posted by downtowntrader | 1/18/2006 09:01:00 PM | 0 comments »

We have two straight gaps down on the Nasdaq and both days ended as stalemates for bears. Indices don't like to leave gaps and I think these will soon be filled. Today looked like it would be a bloodbath but aside from a few techs I didn't see too much follow through for the bears. Tomorrow will be telling after Apple disappointing guidance and EBAY's miss. Dow looks worse right now as it touched the 50 day SMA already.
MMUS: I've been following this for a while and today they released some news and it seems like this has just been waiting to explode. Keep an eye in it tomorrow.
I love how volume has been building on weekly chart.
I've been waiting for a TALX pullback and I'm not sure if people got confused with the split today but TALX reversed hard after touching the 50 SMA. I added to my position at 29.70 this morning and was rewarded almost instantaneously. They report earnings soon and there may be an earnings run.
VAR: I profiled this Monday night as a possible earnings runner and this morning when everything was down, they were quietly moving up. Resistance is broken and they are at all time highs with no resistance in sight.
PRAA: They were profiled on tonights IBD in the New America section and the chart looks interesting. Looks like a cup with a high handle base.

Good Luck,

DT
金币:
奖励:
热心:
注册时间:
2006-7-3

回复 使用道具 举报

 楼主| 发表于 2009-3-20 08:47 | 显示全部楼层
CMED Charts Posted by downtowntrader | 1/17/2006 05:24:00 PM | 0 comments »

Here are updates on what my CMED charts are looking like. I commented last night that they were pulling back on decreasing volume and were looking like they were ready to move higher. They did just that and I added some shares as they eclipsed fridays high. They held my trendline and may run through their earnings release. Weekly chart is looking good too. I am also seeing a nice increase in what I call "basher shorts" on the yahoo public board which is a good contrarian indicator.


Target List Posted by downtowntrader | 1/16/2006 10:23:00 PM | 0 comments »

I'm starting to see a few more interesting set ups but there are still a lot of stocks that are too extended for a safe entry. There are two types of plays I will be targeting in this market environment. The first setup which is reliable in bull markets and rallies is the pullback to support. I look for stocks that have broken from a base and are making the first pullback to test support. I typically buy my first lot as close as possible to support, and then the next lot after I see a bullish candle confirmed at support. When I say "confirmed", what I'm looking for is a higher high after a hammer for example. The second play is a pre earnings run. We are starting the earnings season and I try to find stocks that are expected to have good earnings. These stocks tend to rise up to earnings day. I exit the position before earnings about 99% of the time.

TALX: This stock was one of the first to move on this rally and has pulled back a little. This may be ready to resume uptrend. TALX will split soon and stocks tend to run towards the split date.

CMED: Very orderly pullback to the 10 day SMA. This sector is hot and CMED has some IBD buzz right now, so I expect a breakout to a new all time high soon.
VAR: This may be a good earnings play. They report earnings on 1/25 and the chart is looking good. They broke out of a pullback channel, and are trying to break out of the current base. MACD is crossing over.
BLK:Another earnings play. They report earnings on 1/19 so this would be a quick play. I would wait for them to make a higher high at this point.
SAY: They pulled back and seem to be holding the trendline.
GROW:Nice bullish candle on test of dotted blue line. Read my previous post on GROW.
CME: This might be a decent mid term trade as metal ore rallies in GOLD, SILVER, and COPPER may of brought in more money in. Triangle was broken and is now testing the trendline as support.

If any of these trigger tomorrow I will try and post a more thorough analysis of it intraday.
Good Luck,

DT


Update Posted by downtowntrader | 1/16/2006 08:49:00 PM | 0 comments »

I will be posting an update later tonight.


Quick Update Posted by downtowntrader | 1/12/2006 10:43:00 PM | 0 comments »

Here are a few quick charts.

ANTP: Could be a major league squeeze here. ANTP was up over 30% after hours on earnings and it may not be over.

Looks like a possible daytrade short as it bumped it's head on trendline and market may be weakening. I wouldn't hold too many short positions overnight right now by the way.
Same as above. MRVL may be headed towards 60 where it would be a screaming buy.
CME may follow the trendline down, but is probably a buy on next higher high.

Keep an eye on DGIN. If it breaks higher it may be a buy as it would prove support at trendline.
GILD: I was expecting a pullback to circled area, but it never got there which is bullish.

I expect a choppy day tomorrow so I may just sit on the sidelines. I did take a position in ANTP after hours and will probably take profits tomorrow.

Good Luck,

DT


ANTP Posted by downtowntrader | 1/12/2006 05:15:00 PM | 0 comments »

Looks like an ANTP short squeeze is on after they released earnings. Watch this tomorrow. Also, MCX squeezed pretty nicely today, but came back down a little with market. Market was expected to pull back and this felt pretty mild.

I will be posting late tonight after I'm out of my poker tourney.

DT


MCX Analysis Posted by downtowntrader | 1/12/2006 09:39:00 AM | 1 comments »

I posted a chart on MCX a couple nights ago, and they did prove support near the 61.8% retrace again. This stock has a lot of potential for a few reasons. There is a chance that MCX will debut on the IBD 100 if it closes over 15 on any given Friday. It has an EPS of 96 and RS of 95 on investors.com. Here is the post that alerted me to the IBD 100 rumor. (Thanks to bulltrader)

http://www.thebulltrader.com/2005/12/18/mcx-ibd100-rumors/

Also, I believe there is a fairly large short position in MCX due to the previous large runup and subsequent pullback. This is the open interest as of December 15, but the numbers may be higher at thispoint. I know I can't find any shares to short right now. With the combination of high short interest and extremely thin trade for this issue, shorts could be in a world of trouble here.
Here is the daily chart showing the previous run up and the 61.8% correction. It actually went a little deeper, but with low volume stocks I like to give a little leeway. All other indicators are healthy at this point and ready to turn up in my opinion.


Here is the weekly chart. Volume is building back up a little and MCX is respecting support.


It seems to me that all lot of things are lining up giving decent odds on playing MCX to the long side. Yesterday could just be the beginning of a push to 15. After that, who knows if IBD crowd will follow suit.... Just look at IFO as an example of IBD100 debut.

Good Luck,

DT


Newer Posts Older Posts Home
金币:
奖励:
热心:
注册时间:
2006-7-3

回复 使用道具 举报

 楼主| 发表于 2009-3-20 08:48 | 显示全部楼层
7 Days running Posted by downtowntrader | 1/11/2006 10:20:00 PM | 1 comments »

Seven straight up days on nasdaq on higher volume. Very nice indeed. If you read back you will note that I expected a rally in early January, but I didn't expect this strong of a move. However, this move is already pretty strong and I am not seeing too many chart setups right now that have a good risk reward ratio. Not saying things will fall apart, but I'm not buying much right now.

Look at last 7 day rally on q's and see that it had to take a breather. We may see the same the next few days, if not a pullback.

Semi's may be the hottest group right now. Look at charts of AMD, MRVL, POWI, etc. SMH is looking a little tired but indicators are not seriously overbought yet.
Crazy Mad props to Btuff for putting LMIA on my radar a few weeks ago. This might just be the beginning of a nice move. Look at volume as it cleared previous high. MACD is just crossing. This should trade into the 20's soon.
RIO: Not crazy about this, but it did break the triangle.

SAY: This is one I've been waiting on to pull back. Didn't notice it had pulled back so far today. I will wait for confirmation here before acting on it.
PHLY: Also not crazy about this, again, thinking that the market will consolidate.
GROW:This is a chart request, but on a stock I have been watching. GROW retraced 50% of the last leg up which is healthy. It seems to me that it is still consolidating and that it will drift back a little more. I didn't show it in the chart to not add more lines, but it also retraced UP 61.8% from the 16.50 - 11.92 pullback. This is resistance until it is broken. I would wait before initiating a new position but wouldn't sell at this point if I was already in.
Good Luck,

DT

Also, check back tomorrow morning as I am preparing an analysis of MCX.


REDF analysis Posted by downtowntrader | 1/11/2006 09:19:00 AM | 0 comments »

I think REDF may be an attractive buy around here. I think there are a few early signals on the chart pointing to a move higher.

Daily: This is the chart giving me the most signals. REDF has been holding the channel depicted below by solid blue lines. It is near the lower trendline, but sitting above the SMA's. They have been consolidating the run to 22 so they have worked off the overbought condition and actually were recently oversold.I also like to look for CCI levels near -100 as an early signal of a rebound, and REDF never gets there, but bounces near a horizontal trendline (shown below). They usually bounce once, and then a second time. Also, Slow Stoch crosses from below 20 to above have been pretty reliable. So, I would look for maybe one more weak push down, and then maybe the rebound I'm looking for.

Weekly also shows a nice channel, although MACD looks a little overbought.

REDF has pretty good IBD ratings and they buy as it approaches the 10 week line.


SLW Target increased Posted by downtowntrader | 1/10/2006 11:46:00 PM | 0 comments »

Forgot to mention that SLW target was increased after the bell to $9 Canadian by GMP. It hasn't been posted anywhere but I got it on the Dow Jones Newswire. May get some buying tomorrow as it moved a little AH.


Tuesday Update Posted by downtowntrader | 1/10/2006 09:59:00 PM | 0 comments »

Nice finish for the indices. I believe in the theory that in a bull market/rally, stocks tend to open weak and finish strong. In bear markets, it's the opposite. The Pro's take advantage of the amateurs at the open, and sometimes it's hard to not get shaken. The best you can do is stick to your rules and keep the overall market in perspective. Look how BCON had a push down in the morning and then rebounded hard. Same with CKCM, although they were able to shake me out of a few shares on CKCM as I was anxious to protect profits. I can't find a whole lot that looks attractive from a risk reward perspective, but there are a few that merit watching.

BCON: I've been looking for a move from BCON for a while now, and it may finally be breaking out of it's base. There were a lot of alternative energy stocks moving today, no doubt due to oil moving. Although BCON has nothing to do with oil per se, it moves with the rest of the alternative plays such as DSTI, SPIR, SPWR, etc. I wouldn't be surprised though if there was some news released soon.

PCU: Copper was the only metal ore that moved today. PCU went along for the ride. If copper breaks to new highs, PCU will follow suit.
Here is the copper chart.
TRE: This is a gold play that is near a trend line and fib retrace level. Very solid volume building here.
MCX: I think MCX correction is near over. Corrected 61.8% and now coming back to test support. Volume has been decreasing on the pullback and MCX should stay above the recent bottom at 11.68.
GILD: I was waiting for the pullback after the new 52week high. Looks like we may get a 31.8% retrace to the breakout area. Solid entry there.

Good Luck and take profits.

DT
金币:
奖励:
热心:
注册时间:
2006-7-3

回复 使用道具 举报

您需要登录后才可以回帖 登录 | 立即注册

本版积分规则

本站声明:MACD仅提供交流平台,请交流人员遵守法律法规。
值班电话:18209240771   微信:35550268

举报|意见反馈|手机版|MACD俱乐部

GMT+8, 2025-7-20 23:15 , Processed in 0.054648 second(s), 9 queries , MemCached On.

Powered by Discuz! X3.4

© 2001-2017 Comsenz Inc.

快速回复 返回顶部 返回列表