搜索
楼主: hefeiddd

一个笨蛋的股指交易记录-------地狱级炒手

  [复制链接]
 楼主| 发表于 2009-3-19 17:56 | 显示全部楼层
Indices at important trendlines Posted by downtowntrader | 7/25/2006 10:17:00 PM | 0 comments »

The Dow and SP500 are testing major trendlines and this is a logical place for a failure if a rally is not in the cards. Could go either way at this point really, with fair arguments for both bulls and bears.

Here is a chart of the industrials showing the trendline resistance. The SP500 is in a similar pattern. The Nasdaq doesn't have a similar downtrendline, but closed one point above the previous June low. It needs to move decisively over this area for bulls to feel a little better.Commodities are getting interesting at these levels. The question is are commodities experiencing a normal correction or topping? Here is a chart I created that watches the link between the $crb and the Dollar index. Notice that these markets trend opposite each other. The Dollar has strengthened a little recently as the $CRB has pulled back. Notice the $crb (gold area) has been bouncing between the upper band and the 39 week average. The dollar is the green histogram and notice the possible reverse head and shoulders bottom. It will be interesting to see how this works out after the next fed meeting.
Here is a chart of the Natural Gas index. It looks like it may test the upper trendline soon.
Telecom's broke out today after AT&T's bullish earnings report. I think telecoms are worth atching for the next pullback.
GLG could go either way at this point, but I see a couple of possible bullish patterns here. If it clears this pennant type pullback, it could form a reverse head and shoulders with the neckline being near 39.
VIVO is struggling under the major trendline break.
OMNI had a nice day today and may be headed towards the previous highs. I also own EGY in this area and both are looking decent.
HLTH continues to chug along the previous breakout area. Aggresive traders may buy on a higher daily high. Conservative traders may wait for it to clear resistance.
EOG looks like it may be setting up for a nice short. It is up against the 200sma and trendline resistance.
HAL is attempting to retrace some of the recent losses. I would doubt it closes above the gap. The target is listed by the red box.

Notice I have both Shorts and Longs in the Oil / Energy sector. While I think the energy sector is in the process of topping, it looks like it is moving higher short term. I am looking to play a spread by going long on the stronger stocks and short the weaker ones, until this resolves itself.

Good Luck,

DT


Low Volume Bounce Posted by downtowntrader | 7/24/2006 09:13:00 PM | 0 comments »

Markets had a large percentage gain today, but volume was pretty low. The markets may be putting in double bottoms here but volume will have to increase for any sustainable rally. Here is an updated SP500 chart showing the possible reverse Head and Shoulders that I mentioned last week. It looks like the neckline will at least be tested.
I highlighted the Oil Sector last night as possibly topping. The OIH fund bounced off the neckline today. Although the I still believe the Energy markets to be near a "top", it looks like there is a decent chance for a retracement here, or even a near term bottom.

Drug stocks are starting to perform well on a relative basis and may be the beneficiaries of a market rotation to more defensive groups. Here is a chart of AMGN clearing a long term downtrendline.


Here is a larger view showing a falling wedge which also supports a possible bottom theory by finding support near a horizontal trendline.


Careful the next couple days in case the indices are merely getting a technical bounce.

Good Luck,

DT


Sunday Night / Monday Morning Update Posted by downtowntrader | 7/24/2006 12:43:00 AM | 1 comments »

It's a little late here and I have a bunch of charts, so I will just run through them.

Here is an updated weekly chart of the Nasdaq showing a possible support trendline under the October lows that have been breached.

Here is a weekly chart of the Russell. The trendlines speak for themselves. One thing to notice are the ratio charts under the indicators. It looks like smallcaps may finally underperform big caps.
I mentioned a possible head and shoulders top in the OIH fund, and it looks like it is very close to completing if it hasn't already done so.
Here is a weekly chart with the Oil overlayed on it. Typically, the Oil stocks peak before the commodity and notice that Oil kept rising as OIH made a lower high.
BWP has been pulling back from resistance, but is holding up rather well as the markets have deteriorated. Watch for a breakout if markets move higher.
I suspected that BIDU may trade near 89 based on options Max Pain level. It closed pretty near and with a doji on support. If it makes a higher high it may be a decent buy.
CRY has held near it's breakout area and may follow through with a bounce off the 20sma.
Here is a chart of NTRI for those holding for earnings. This is another that was pinned to 65 for options expiration. It rose to 66 after market Friday so expect a gap up.
JCOM fell out of an expanding trading range and may be headed to it's 200sma.
LVS broke under a risising trendline and may be headed to 50.


VIVO broke down friday and may be a decent short if it bounces back to test resistance.
DRIV has been holding the previous resistance trendline as support. This could be a good trade either way, and I suspect it all depends on the near term market direction. If it breaks lower, it has a LONG way to fall.
CACC is at critical support near 25. This is another that could go either way depending on how it deals with a major trendline.
INFA is looking very good as a long play, but of course, a lot depends on the markets near term. Here is a weekly chart showing INFA bouncing off of two converging trendlines.
Here is the daily chart that isn't that exciting without the context of the weekly chart.
CSH is back to the breakout area. Watch to see if it bounces here.


The markets are at another crucial point as there is a chance of a strong rally off a possible double bottom, or there is a chance that things will get really ugly, really fast if the Dow and SP500 follow the Nasdaq lead in making new lows. Trade Carefully,


DT

PS. I also noticed KOMG as a possible short after finishing this post. I'll try to post a chart tomorrow.
金币:
奖励:
热心:
注册时间:
2006-7-3

回复 使用道具 举报

 楼主| 发表于 2009-3-19 17:56 | 显示全部楼层
Expiration day Posted by downtowntrader | 7/20/2006 08:54:00 PM | 0 comments »

Tomorrow is expirations day and as such I will be taking the day off. Here are a couple of charts to check out if oil continues to break down. If commodities are indeed peaking for now, it could signal that the economy is in for a downturn. In that scenario, industrial and commodity type stocks could be headed for major trouble.

EOG looks like it has already peaked and is back below the neckline of a large head and shoulders.
I need to give credit for EOG to Trader Tim who mentioned it tonight.
Here is a closer look using candles.
VLO may also be topping here after making a lower high.

Trade carefully as tomorrow could be a choppy rangebound day.

DT


Strong Move Posted by downtowntrader | 7/19/2006 09:12:00 PM | 0 comments »

Very strong move today coming from a combination of things. The indices have been oversold and any time there is a mention of stopping the rate hikes, the shorts scramble to cover. I believe if the fed does pause it will ignite a decent rally, but it won't hold up because the underlying reason for stopping hikes would be due to a slowing economy. This will eventually show up in corporate earnings. Keep in mind the past three 100+ point days got the indices nowhere. Todays rally as impressive as it was, really only took the indices to some declining sma's. That being said, this rally should last a few more days. I mentioned earlier this week and last week that I would be focusing on longs and there have been some good moves on stocks I've mentioned (such as BIDU,CSH,IBCA,MED,VOL,etc.). Now is the time to start locking some profits in as there are no gaurantees that any of these moves will last.


Here are a few charts that look promising.

ANDE may try and clear resistance here. They made a higher low and if they can clear the downtrendline, they should make the higher pivot high.
CRDN is bouncing off the 200sma.
JCOM looks to be stabilizing at the 50sma and trendline.
I have a bit of a quandary with HAL. They have broken down here and present a nice shorting opportunity anywhere near 35, but they report earnings on Friday. I hate holding stocks over earnings, but this looks like a nice chart.
The following are some utilities which should remain one of the stronger sectors for the near future.

FE cleared a nice base today. I would look to any retest of the breakout for an entry.
TXU looks like they are accelerating their uptrend here.
AES may be clearing a bull flag here although it may be a little early.
AVA chart looks similar to TXU with an accelerating move higher. I would probably wait on this one as it is moving higher above the 9ema.

Tomorrow should be interesting to see if the markets get any sort of follow through. Apple was trading 10% higher after hours so keep an eye on sympathy plays such as MRVL. Also, EBAY and MOT were looking good. QCOM and CTXS were getting hammered when I last checked.

One additional thing to mention. Keep in mind that options will expire on Friday and some of the games will begin or have already begun. Also, keep an eye on earnings releases for any stock you may play.

Good Luck,

DT


Clinging to support Posted by downtowntrader | 7/18/2006 09:54:00 PM | 4 comments »

The Nasdaq actually breached the October lows today but managed to reverse by the end of day. I would wager to say that if todays low is breached in the next few days then it will be the start of a nasty downturn.

Here is a chart of the Nasdaq showing positive divirgences on RSI and MACD. A rally to the declining sma's would not damage the bearish charts and would alleviate some of the oversold conditions.
Here is a chart of the SP500. Nice candle today confirming support. This level was confirmed as support on the last downturn, so it makes the candle more significant. While I'm not crazy enough to call it, it looks like there is a possibility that the SP500 could form a reverse head and shoulders as marked on the chart. This would be an interesting development if the pattern came to fruition as the short covering would be frenzied (maybe fed pause ;).
Here is a chart of the very oversold $sox. May get a bounce here on a previous trendline. I couldn't find any charts of semi's I liked, so if anyone has suggestions feel free to leave a comment.
Here is a chart of MED continuing to drift towards the 50sma. They had a decent day today and could follow through tomorrow.
BWP may get a bounce off the trendline here which could turn into a triangle breakout. I don't care for low volume stocks, but this one trades well.
ODFL pulled back to the 50sma and could find support here.
Here is an updated chart on CSH which was highlighted earlier this week. This looks like a solid breakout.
NTRI came back to test support and had a bullish engulfing pattern today. They could be headed for a test of the 52week high if they can clear the small cup and handle base from the past month and a half.

Good Luck,

DT
金币:
奖励:
热心:
注册时间:
2006-7-3

回复 使用道具 举报

 楼主| 发表于 2009-3-19 17:57 | 显示全部楼层
Interesting day in the oil market Posted by downtowntrader | 7/17/2006 10:41:00 PM | 0 comments »

Oil closed lower today inspite of all the turmoil in the Mid East. There are some interesting patterns developing on the Oil Charts showing a possible top nearby. Although it looks like there will be some weakness near term, keep in mind that Energy and Energy related stocks have been the strongest sector and remain comfortably in long term uptrends.

Here is a chart of the Oil contract. An evening star candle pattern formed today which is a reversal pattern. A common misconception is to interpret candle reversal patterns as signals that the trend will actually reverse to the opposite trend. In practice, it is far more common that the trend will pause and then either continue or reverse. I would look at this pattern to suggest that oil will pullback or consolidate. One possible target is to the previous trendline breakout area highlighted by the blue arrow below.
Keeping in mind that Oil just broke to new highs, it is interesting to note that the Oil Services ETF OIH, failed to make a higher pivot high along with the commodity. In fact, it looks like it is tracing a possible head and shoulders top. It is too early to determine if the pattern will complete, but it sure looks like it will at least test the neckline.
Here is a chart of the XLE Energy Select spdr. Note the same possible Head and Shoulders top along with a lower high and lower low. What is interesting to note is that I don't believe that it is normal for commodities to top so close to stocks. This poses lot's of different scenarios depending on how this plays out.
There are some interesting charts in the energy sector with possible short setups although at this point I would take the charts above more as a warning to protect profits or to wait on initiating new positions in the sector.

Here are a couple of charts on individual stocks.


Here is a chart of LVS pulling back to a rising trendline. If the market cooperates, this could be a decent entry.
Here is a chart of VOL showing strong buying in the 44 area.

Keep an eye on recent picks, BIDU, IBCA, CSH, and TZOO. BIDU and IBCA had nice days today in particular.

Also, check out The Bulltrader for a promotion they are having to celebrate their one year anniversary. Congratulations Johns and company.


Good Luck and good trading,


DT


Russell Breaks down Posted by downtowntrader | 7/16/2006 10:15:00 PM | 0 comments »

The Russell index is now the next index to break down after the Nasdaq. The Dow and SP500 are barely clinging to support and it looks like we are now in a bear market. While it looks like there will be continued weakness in the long run, we may experience an upturn this week. There are a few reasons for this. First, it is difficult to break through support in an oversold state. Second, this is options expiration week and the past few options expirations have trended opposite the underlying trend as the max pain theory takes effect.

Here is a Dow Industrials monthly chart showing several things. First is a possible top at a previous high. Second, look at the Dow/Nasdaq and Dow/Russell ratios towards the bottom. The Dow is outperforming both which shows that market participants are rotating to "safer" instruments. This is bearish for the markets in general as investors are more apt to take risks in bull markets.
Here is a chart of the afore mentioned Russell Index. This is the weekly chart showing a break down out of the rising wedge after an upside breakout failure a couple months earlier.
Here are a few charts. All of these are long charts because I believe that is where the reward is again, at least for the next few days.

ARGN refused to go down the past few days and is finding support along a rising trendline and MA's.
OMNI may find support near the rising trendline and 20sma.
BTU is testing the downtrendline it cleared for potential support. It is wedged between the 50sma and horizontal trendline support right now.
CSH looks like it may find support at the rising dotted red trendline.
FMD is finding support at the previous rising trendline after the nasty breakdown the past two weeks. This is a decent chart to watch to see if it breaks under the blue line for a very nice short, or if it can get back over the red rectangle.
HLTH is holding over the horizontal trendline which was the previous breakout area.
IBCA was an anomaly last friday heading higher as the market was breaking down. They are close to breaking out of this solid base.
MED isn't giving me a clear chart pattern to work with, but the price action and volume are giving clues that a big move is in store. Look at how narrow a range and how light the volume has gotten over the past few days. Keep an eye on it to see which way it breaks.
SII has been trading this range for the past year and is near the top again. It may need dip one more time if it is gonna breakout, but it is worth watching to see if it attempts it now.
TZOO has been acting bullish and is reporting earnings soon.

Also, keep an eye on BIDU as they were strong last friday as the market was weak. I should have some BIDU charts in the archives.

Good Luck,


DT
金币:
奖励:
热心:
注册时间:
2006-7-3

回复 使用道具 举报

 楼主| 发表于 2009-3-19 17:58 | 显示全部楼层
Support Posted by downtowntrader | 7/14/2006 03:04:00 PM | 1 comments »

There is a decent chance the Nasdaq will find support here after testing the October lows as mentioned last night.


DT


Indices Posted by downtowntrader | 7/13/2006 09:23:00 PM | 2 comments »

Poker night so I will keep it short. It looks like the Nasdaq will test October lows as soon as tomorrow.

Here is a chart showing the recent breakdown. We could double bottom, but at this point it's better to wait for this to resolve itself, or scalp some short plays.
Here is the sp500 chart. As you can see it's in much better shape then the Nasdaq and is still in the long term price channel. It looks like the Nasdaq and SP500 could both find support at the same time increasing the odds of a bounce. Keep an eye on these support levels tomorrow if all the bulls throw in the towel.

Good Luck,

DT


Indices give back gains Posted by downtowntrader | 7/12/2006 10:45:00 PM | 4 comments »

The major indices gave back all of yesterdays gains and then some. While volume was lower, technicals were pretty negative. The Nasdaq looks like it will retest June's lows with most techs looking extremely weak right now. Here are a few charts to check out.

POWI just fell out of a channel it was trading in, and may have a quick run down here.
VOL may find support at the 20sma.
ATHR looks like it is forming a bear pennant up to it's 200sma and previous trendline.
BWNG just fell under a large support area.
CTXS is hovering near major support. They may get a bounce back to the blue descending trendline, but they could just as easily head down here.
XRTX hasn't broken the support line and 200sma yet, but it is looking like it will. ADX is curling up here.

If we manage to get a bounce tomorrow, take a look at some of my previous charts from this week such as eye, celg, cldn, tzoo, etc. Otherwise, we may be in for continued weakness in tech stocks.

Good Luck,

DT


Rally still intact Posted by downtowntrader | 7/11/2006 10:08:00 PM | 0 comments »

The markets rallied off their lows today and the Nasdaq held support near 2100 again. The fact that semiconductors led the way bodes well for the indices as they have been the real drag lately. There are a lot of hammers on the daily charts again and there are some decent looking charts around.

SUG looks like it may find support at the breakout area.

KSS is holding above the trendline and looks like they may bounce here.
ADS has been pulling back nicely and the ADR is narrowing.
BIDU continues to trade this tight range and should have an explosive move to either direction, although a bullish move is more likely.
HBHC looks like it will breakout out of this triangle base.
HLTH had a nice volume increase today as they held support.
PFG has come back to the breakout area and is offering a decent entry.
CHRW is also looking like it may hold support near the blue trendline.
LVS is another one coming back to test support at the previous breakout area.
IBCA has been consildating for months now, and may be ready to clear this base.

Let's see if the markets follow through over the next couple of days.


Good Luck,

DT
金币:
奖励:
热心:
注册时间:
2006-7-3

回复 使用道具 举报

 楼主| 发表于 2009-3-19 17:59 | 显示全部楼层
Nasdaq Weakness Posted by downtowntrader | 7/10/2006 10:03:00 PM | 0 comments »

I can't overstate how weak the Nasdaq tech stocks have been. Chips have been a real drag on the market and the Nasdaq was the first index to breach the lows of the Fed day rally. We are close to seeing if the markets will rally in July or if the downtrend will start to pick up steam again. Here are a few charts to check out.

FMD had a pretty nasty drop last week and it looks like the dead cat bounce is over.
OII may be getting support witnessed by the spinning top at the 20sma and previous breakout area. Spinning tops are a candles that have long wicks and small bodies. They signal indecision which can be an early clue that a trend may be ending.
AMLN wants to break resistance and were pretty strong today.
NWRE is stalling fairly quickly after trying to retrace into the gap down.
CHH may be breaking out of a bull flag here.
EYE formed a doji at support via the trendline and 9ema today. This could be a signal that they will bounce back here.

Good Luck and be extra careful the next few days.


DT


Markets at Crossroads Posted by downtowntrader | 7/10/2006 07:47:00 AM | 0 comments »

The Markets are at a crossroads again after failing to make a higher high and stumbling at resistance. This is a good place to stand aside if you are averse to shorting as the markets could chop around or accelerate to the downside. We won't know if the downtrend is resuming in full force or if we are testing support until the previous lows are taken out decisively. There are key levels to watch and one of them is the indices Pre Fed levels. With earnings season kicking in today, markets will be keying on guidance. Here are a few charts to watch.

Here is a weekly chart of MTH. Homebuilders have some nice divergences on the daily chart, but price action is saying there is still some room to go down. The target for the head and shoulder top on MTH is in high 30's.
CELG bucked the trend on Friday and is just shy of a 52 week high.
CLDN is forming some nice tails on recent candles showing support near breakout area.

KSS is consolidating near the breakout are. Looks like it will touch the line one more time.
ANDE may be failing at this previous support trendline.
BAS ran into some steep resistance at the 50sma.
MYOG has been trending nicely down this expanding channel and looks like it will head to previous lows.
WIRE also stopped at previous support and 50sma. Watch to see if it breaks the short term rising trendline.
ARGN is hovering near support and could be an attractive risk vs reward long play here.

A coupe other items to note. HANS 4 to 1 split is effective today. Also, watch AA (Alcoa) earnings today and possible sympathy plays in AL,CENX,SCHN,PCU,CMC, etc.

Good Luck,

DT


Sunday Night Update Posted by downtowntrader | 7/09/2006 10:39:00 PM | 0 comments »

I will post my regular update tomorrow morning.

DT


Market Indecision Posted by downtowntrader | 7/06/2006 11:03:00 PM | 0 comments »

Markets were undecided again today and it looks like many are waiting for the jobs report tomorrow after ADP's report suggested a much higher jobs number then forecasted. Whatever is reported, I would imagine that a stronger move is put in. Earnings season kicks in next week so that may end up driving the markets for now.

Here is an hourly look at the Nasdaq composite. Notice it has been getting support at the 200 bar SMA and previous pivot high. I would watch that level first tomorrow and then the trendline's above and below that area.

ET is looking like a good risk reward short trade as it struggles with the down trendline and 50sma.

Thats it for tonight.


Good Luck,

DT
金币:
奖励:
热心:
注册时间:
2006-7-3

回复 使用道具 举报

 楼主| 发表于 2009-3-19 18:00 | 显示全部楼层
Nimble Trading Posted by downtowntrader | 7/05/2006 10:22:00 PM | 0 comments »

With the indices still under the last pivot high, you have to treat each failure at resistance carefully. While I expect further rallying, the fact remains that the path of least resistance is currently down. My advice is to adhere to your stops and stick to your trading plan. I have started to scale in some short positions although I am still biased to the long side right now. Here are a few charts worth watching tomorrow.

ARGN is near support and may get a bounce.

TSCM tested the breakout area today and had some nice buying come in to support it.
VOL may of already cleared this flag, but the safe play is to wait for it to clear resistance.
SNDK fell out of a small descending triangle today.
MNST may of fallen out of a consolidation area today. (even after a strong jobs report)

Although I was bullish on GYMB earlier, if it falls out of this triangle on a closing basis it could make a decent short.

Good Luck,

DT


Happy Independence Day Posted by downtowntrader | 7/04/2006 02:11:00 AM | 2 comments »

Happy Independence Day to my readers in the US. I hope everyone has a safe and enjoyable holiday.

DT


Indices retracing Posted by downtowntrader | 7/02/2006 11:15:00 PM | 0 comments »

Tomorrow is a short day and volume should be very light. The indices have quickly moved up to some fibonacci retrace levels and may need to consolidate the recent move up.

Here is the Nasdaq Composite chart stopping right at the 38.2% retrace.

Here is the SP500 stopping right at the 50% retrace and 50day sma.
Here are a few charts to add to this weeks watchlist.

GOL may of cleared some important resistance here.
HBHC looks like it may be ready to clear this ascending triangle.

HLTH may offer an opportunity to get in near the breakout area tomorrow.
MIKR has been running hard lately and made a run at 15 on friday which would of likely put them in the IBD100. There may be a pullback to the lower trendline if some are disappointed with the close under 15.
PFG cleared an ascending triangle friday.

TSCM looks promising with volume surging on the ascending triangle breakout.
I highlighted UARM recently and they were able to clear strong resistance. I believe a pullback to the breakout area would offer a pretty good entry.
UACL has had a hard time with resistance here, but may be ready to move higher.
VOL is trading in a nice flag pattern and looks like it has plenty of gas left in the tank.

Good Luck,

DT
金币:
奖励:
热心:
注册时间:
2006-7-3

回复 使用道具 举报

 楼主| 发表于 2009-3-19 18:01 | 显示全部楼层
Strong Day for Bulls Posted by downtowntrader | 6/29/2006 09:40:00 PM | 2 comments »

I'm having all sorts of dsl problems today so I'll keep it short. Today may of been the confirmation of the rally I've been expecting. I think we need to keep things in perspective because days like this tend to get the majority of people too excited. The major indices are all still weak with Nasdaq still below 200sma. That being said, today was a very positive day and if tomorrow holds up it would keep the sp500 monthly macd in positive territory avoiding a major sell signal.

Here are some good looking charts.

CELG tested the breakout area and had a nice move today.
ADM looks like it will hold this line as support.
ADS may be breaking out here.
CLDN tested it's breakout and may be off to the races.
EYE came back strong the past two days and looks good here.
KSS looks like it will finally clear resistance here.
NTES tested support after breaking out of this channel and had a solid move late today.

Be patient and keep in mind that there are a lot of stocks that look pretty good right now. Be selective and don't chase. If this is the beginning of a multi week rally then there will be plenty of chances to get on board.
Good Luck,


DT


Market Update Posted by downtowntrader | 6/28/2006 10:04:00 PM | 0 comments »

Not much really happened again today as the markets have been happy to stay in the current trading range. Lately, trading typically gets light coming into the Fed meeting with lots of wild swings following the meeting minutes release. It will be interesting to see how the markets react, as it seems like everyone expects this meeting to set the tone for the market in the near term. Here are updated charts on the Nasdaq and SP500.

The Nasdaq has held this very steep channel so far and while I still don't expect it to hold the channel, there is still a farily decent chance it takes another leg down. It looks like we will at least get a retest of the recent lows. I am watching the range shown by te horizontal blue lines over the recent price action. We are in a trading range until either of those lines are taken out on a closing basis.

The same goes for the SP500 chart, except that the index remains in the longer term channel while the nasdaq has remained below the channel.

The longer the indices remain under the 200 sma the more likely that we have indeed entered a bear market. Some can argue that we are in a secular Bear market following the 2000 top and that we are now at the end of the cyclical bull that started in 2002. What will be interesting to see if we indeed are headed toward extended weakness, is how the impact of so many hedge funds and program traders will be felt.

Good Luck out there,

DT


Then I review all my charts. I usually review most of my charts on Sunday night and then focus on certain sectors throughout the week. I review the indices and my watchlist every night. I use stockcharts.com for storing my annotated watchlists. After narrowing down the list, I go through each chart in more detail and annotate them. Once I have annotated the charts, I upload them to blogger and work on updating my blog.

One thing you'll notice, is that I don't waste my time on public boards or forums. I am a member of a couple private boards and I read the updates via email. I find that most of the posts on public boards are pure trash and not worth the time. Another thing worth mentioning, is I don't read all the above looking for stockpicks, I read them for the commentary and their interpretation of the markets action. I have plenty of picks from my watchlists and Trade-Ideas. I also try to focus on sites that focus on concepts or ideas that enhance my trading strategy and timeframes.

While I'm not saying that everyone should read what I read, I think every trader should try and establish a nightly routine for being in synch with the markets.

Good Luck,

DT


Newer Posts Older Posts Home
金币:
奖励:
热心:
注册时间:
2006-7-3

回复 使用道具 举报

 楼主| 发表于 2009-3-19 18:18 | 显示全部楼层
Weekly Charts and Short term trading Posted by downtowntrader | 6/26/2006 09:32:00 PM | 4 comments »

Since the markets aren't doing anything I decided to show why I use weekly charts even though I am a short term trader. A lot of beginners assume that they only need to look at the time frame they are trading

however, it is very important to check out several different timeframes to try and determine possible support and resistance areas. I like to use the daily and weekly charts to determine what stock to play and then use the 5,15, and 60 minute charts for fine tuning my entries and exits.

Here is XPRSA which I took near 24. This still looks pretty good on the daily chart with volume expanding as it moves higher. However, it is sitting pretty much at my target which isn't apparent anywhere on this chart, unless you measure the triangle breakout (which also yields a target near 27).

Taking a look at the weekly chart you can notice a resistance area that begins at 27. There is no guarantee that it will stop at 27 on the dot, but this is a logical place to tighten up on my stop. It is very doubtful that it will zoom past the resistance area altogether, so the risk /reward diminishes each move higher.
Here is another example. I added to OMNI today on a test of the breakout area. While this is a risky move in the sense that the stock was falling, I felt comfortable with the risk I was taking vs the potential reward. Flag breakouts offer some of the best moves and OMNI has already cleared substantial resistance.
Here is the weekly chart which shows OMNI trading over significant resistance. OMNI looks to be accelerating the trend since it moved over the ascending trendline. Most of the time these accelerated moves can't be sustained, but I could care less since I am trading this for a short move.

I monitor 15 min, 60 min, daily, weekly and monthly of the major indices as well. I think that anyone trading short term should be aware of what trend is persistent in all of those time frames.

Good Luck and trade carefully as we are in a dangerous place yet again,

DT


Lot's of Charts Posted by downtowntrader | 6/25/2006 10:27:00 PM | 0 comments »

With the Fed meeting coming up, the markets may not move meaningfully in either direction. If we get a sharp move one way or the other, I would expect a reversal of that move after the fed meeting. Since we have worked off some of the extremely oversold indicator readings, it makes sense that we will get a retest of the recent lows soon. Lot's of charts tonight, so I'll get right to it.

Long Charts


OMNI just cleared a bull flag chart pattern.

EYE traded to a new 52 week high and while it's a little extended on the daily chart, the weekly chart looks pretty good.
Looks like BLS confirmed support at the breakout area.
CHH cleared a downtrend channel Friday.

CLDN is close to breaking resistance and volume is confirming the move.
ENS is clearly extended, but if it clears this pennant it could have a nice quick move.
FORM is looking like it might clear the downtrend channel here.
JCP looks a little tired but it has stayed overbought for long stretches before.
KSS has been trading a very tight range for a few days right up at resistance. If it clears resistance the move may be powerful.
OII is testing resistance here.
XTXI looks like it wants to test the resistance line above.
NTES took it's sweet time trying to fill the previous breakaway gap and still left a portion unfilled. This is bullish as buyers stepped in and now it is trying to clear the pullback channel.
Some Short Charts

ABAX is up to a fib retrace level and is overbought. May be ready to pull back down.

AMX looks like it is trading a nice little bear pennant / wedge up to resistance.
GFIG is still up against resistance.

Thats it for tonight.


Good Luck,

DT
金币:
奖励:
热心:
注册时间:
2006-7-3

回复 使用道具 举报

 楼主| 发表于 2009-3-19 18:18 | 显示全部楼层
Terrorist Raid in Miami Posted by downtowntrader | 6/22/2006 09:27:00 PM | 0 comments »

The FBI took some terrorist suspects into custody here in Miami and the story is that they were plotting to blow up the FBI building here and possibly the Sears Tower. We now have two public terrorist raids in the span of a month with the Toronto raid and this one in my backyard. Makes you wonder if something is imminent and counter terrorists are trying to be proactive.

As for the markets, I should of taken the day off as they really didn't do much. Although the indices lost some ground, volume was low and most of the drop came early. We may of set a higher pivot low on the 60 minute nasdaq and sp500 in the early afternoon depending on tomorrow's action.

Here are a few new charts for tonight. Most of this weeks watchlist has been pretty good so lock in those profits.

PEIX may of set a bottom here.

BOOM was holding it's ground all day today and had a nice little move in the afternoon. I am highlighting my next target and possible resistance.
While I'm not a big fan of the broadening base breakout, BLS did clear the formation and is in the process of testing support.

Good Luck and stay safe,

DT


Nasdaq leading Posted by downtowntrader | 6/21/2006 10:18:00 PM | 0 comments »

While today left many questions as to the potential strength of the current move, a definite clue has been given. The Nasdaq is taking the lead on the way up. This is a positive for bulls and ultimately, the Nasdaq and smallcaps would need to lead for any sort of sustainable rally to occur. I didn't like the weak close and that leaves the door open for some weakness tomorrow morning and possibly until Friday. Trade patiently as the indices worked their way up to their descending trendlines and could fail here. We've had some good moves in some of the charts I highlighted for this week so try to not let some of those profits slip away. Here are a few more interesting charts.

MWRK had a nice breakout today and while it's extended it deserves to be on the watchlist.
SIMC looks like it is putting in a low here and getting ready to challenge the previous peak.
RMD looks like it wants to clear the downtrend channel highlighted on Sunday night.
ODFL finally made it out of the wedge.
CHH looks like it will test the downtrendline tomorrow. Watch to see if volume comes in. That is the clue as to whether to buy or not.
CELG attempted to breakout today but couldn't follow through. If tomorrow is a solid day it should bust through. Be careful here though, as it is obviously having a hard time with this line.
BWP may follow through tomorrow.
BIDU has been holding gap support while consolidating the earnings breakout. It might be ready to follow through here.
ADS is back for a test of the upper trendline and it's do or die time as trendlines are converging.
ODP is looking like it will fail here. I am keying off the horizontal trendline which would complete a descending triangle continuation pattern.

Good Luck,

DT


Stocks and the Miami Heat Posted by downtowntrader | 6/20/2006 09:25:00 PM | 1 comments »

My plan was to go through all my charts while watching the Heat Game but it is looking like it's not gonna happen ;) . I'll leave you with a couple of updated charts from monday's post.

XPRSA is looking like it wants to clear resistance. I am tightening my stop in case it is a failed breakout here.

CELG hasn't taken out resistance yet but I am still watching it. The chart pattern still looks constructive.

Good Luck,

DT
金币:
奖励:
热心:
注册时间:
2006-7-3

回复 使用道具 举报

 楼主| 发表于 2009-3-19 18:19 | 显示全部楼层
The case for a bottom Posted by downtowntrader | 6/19/2006 08:44:00 PM | 0 comments »

Here are two charts showing the recent downtrend slowing to the point were a more substantial rally attempt can occur. Picking bottoms or lows is very difficult, but with prudent stop losses the chance for good risk reward trades is good.

Here is the SPY 60 minute chart over the past 20 days. The ADX line is almost flat and there were some good diverences on RSI and MACD on the downtrend. SPY is oversold again and could get a bounce as soon as tomorrow afternoon. Here is the Nasdaq Composite chart showing similar action to SPY.
There were some nice shorts today including some of the ones I highlighted last night, but I am keeping my stops tight on both longs and shorts until we either make a higher low or take out the recent lows. I am also keeping a close eye on gold to see if it did capitulate last week.

Good Luck,

DT


IBD100 Charts Posted by downtowntrader | 6/18/2006 08:43:00 PM | 0 comments »

Although I believe there is still money to be made going long this market, it appears that there will be some weakness the next few days. I am posting some IBD 100 charts both long and short. I will keep it brief tonight.

Watch Zolt to see if the drop below the trendline was a headfake or if it is headed lower.
UARM was highlighted last week and has made a nice move. I am watching to see how it handles resistance above.
Watch RMD here as it is threatening to break out of this pullback.
SHG looks like it is a decent risk reward short play here as it touches trendline resistance.
ODP is another that looks weak here. Watch to see if it fails at the 50sma.
ODFL is consolidating in a pennant type base and volume is building on the up days.
LIFC may of cleared the downtrend line on this pullback.
GFIG looks like it will fall here after breaking down severely over the past couple of weeks.
FORM has held withing a long rectangle base and may be ready to test the 52 week high.
FMD closed over long time resistance and although I was doubting the ability for it to hold, I must give it the benefit of the doubt here.
EXPD may be nearing some resistance so keep an eye on it to see how it handles it.
CME looks like it is clearing a consolidation pattern here, but volume was very weak.
CHRW broke out of a falling wedge but stopped at 50sma. It will probably come back and test the wedge breakout and give a better risk reward setup.
CELG is still hanging around the top of this triangle and may be just a few sessions away from making a move.
I really like BRLI's chart, however I want to watch it for a better entry. It would be nice if it pulled back gently about 2-3%.
ADM is another possible short. The ethanol stocks are losing some momentum and ADM broke the first important trendline.
Thats it for tonight.
Good Luck,


DT
金币:
奖励:
热心:
注册时间:
2006-7-3

回复 使用道具 举报

 楼主| 发表于 2009-3-19 18:19 | 显示全部楼层
Options pinning Posted by downtowntrader | 6/15/2006 10:12:00 PM | 3 comments »

Well we got to the top of some downtrend channels pretty quickly after a really strong day today. How much of this is short covering or options pinning remains to be seen, but channels this steep cannot be sustained for very long. I would expect some trouble with these resistance levels but I don't think a quick reversal is in the cards.

Tomorrow is options expiration Friday and as such I will not be daytrading. I was expecting a strong move to the upside and there may be more of the same early tomorrow. By the end of the day the program trading will really kick in. I would expect that we would see some weakness early next week, especially if tomorrow is a strong day.


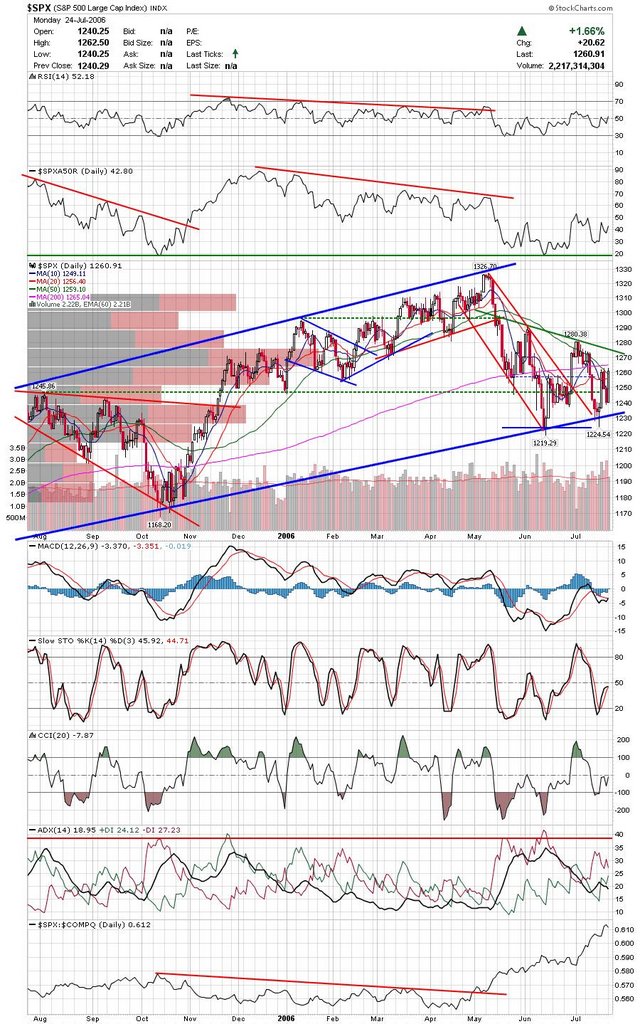
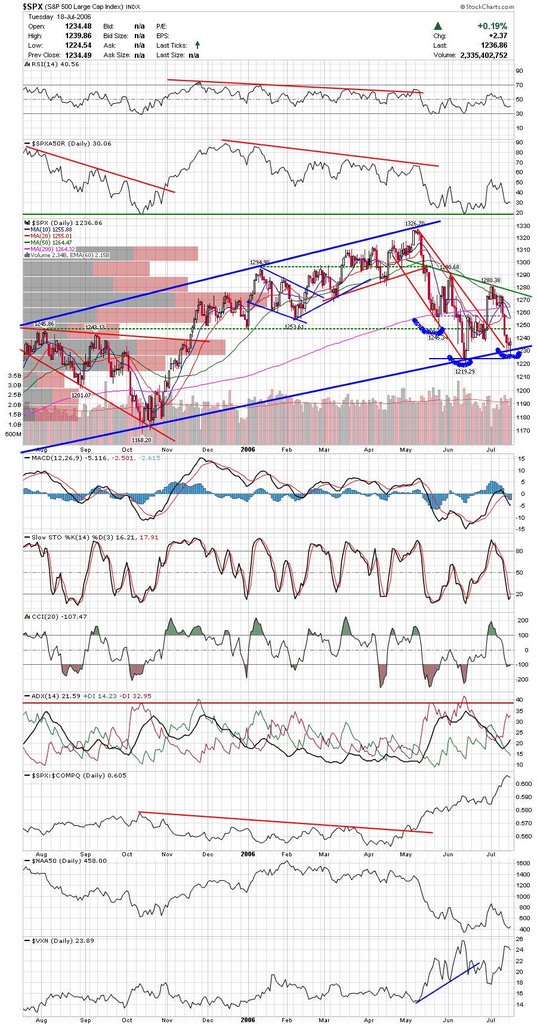
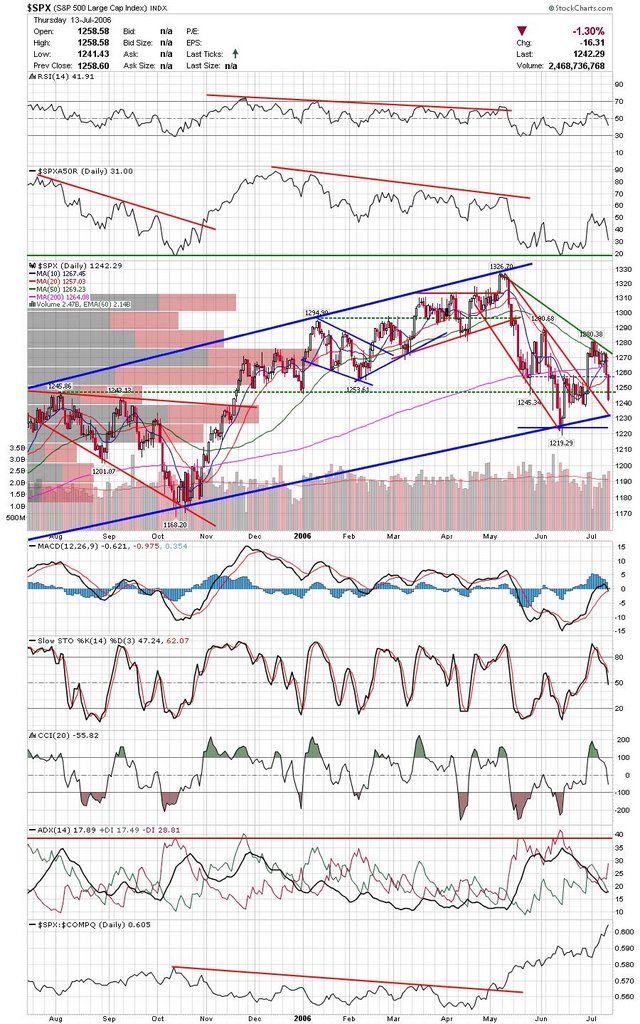
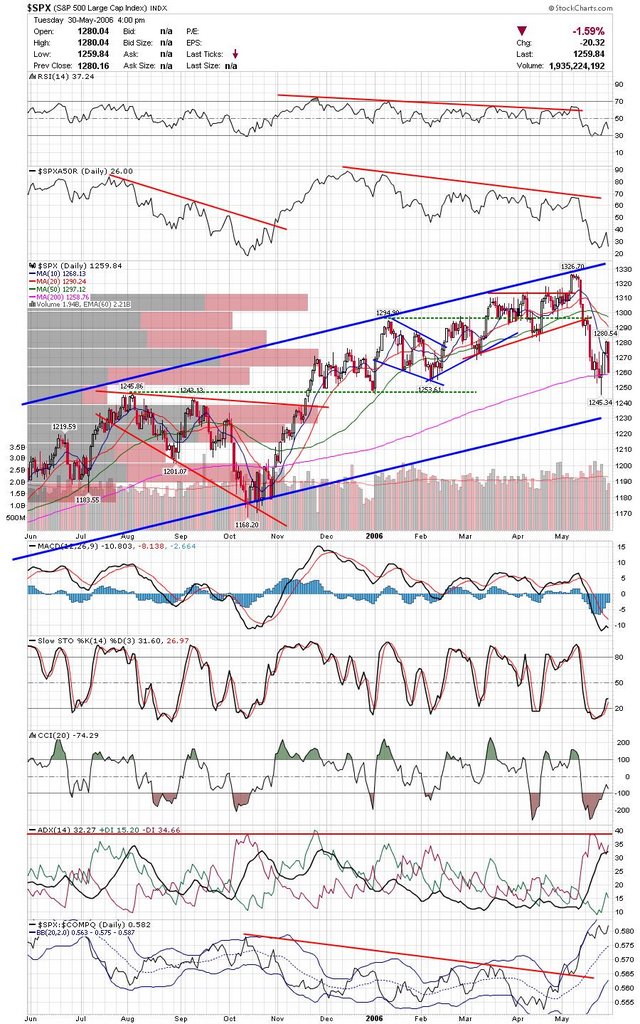
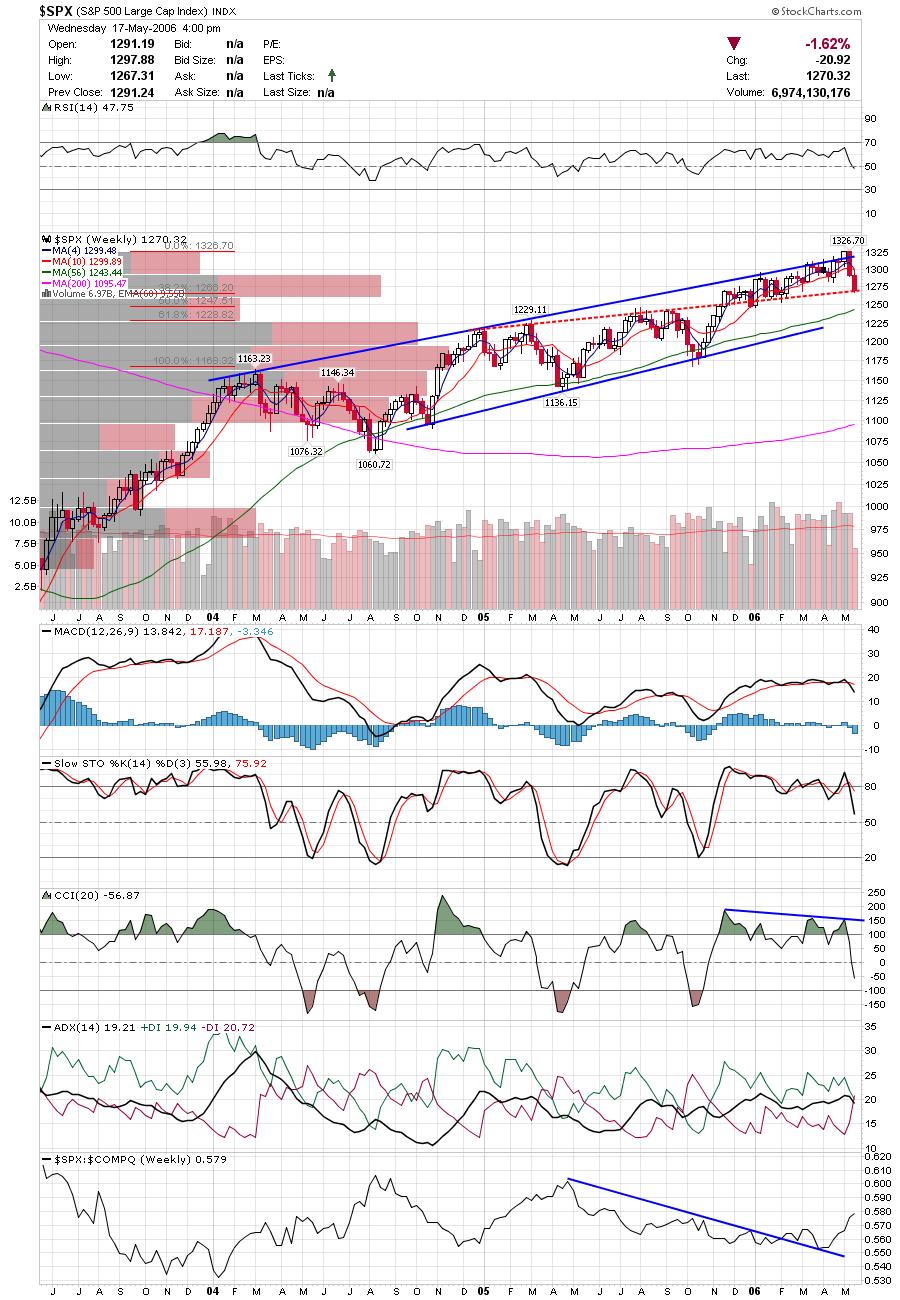
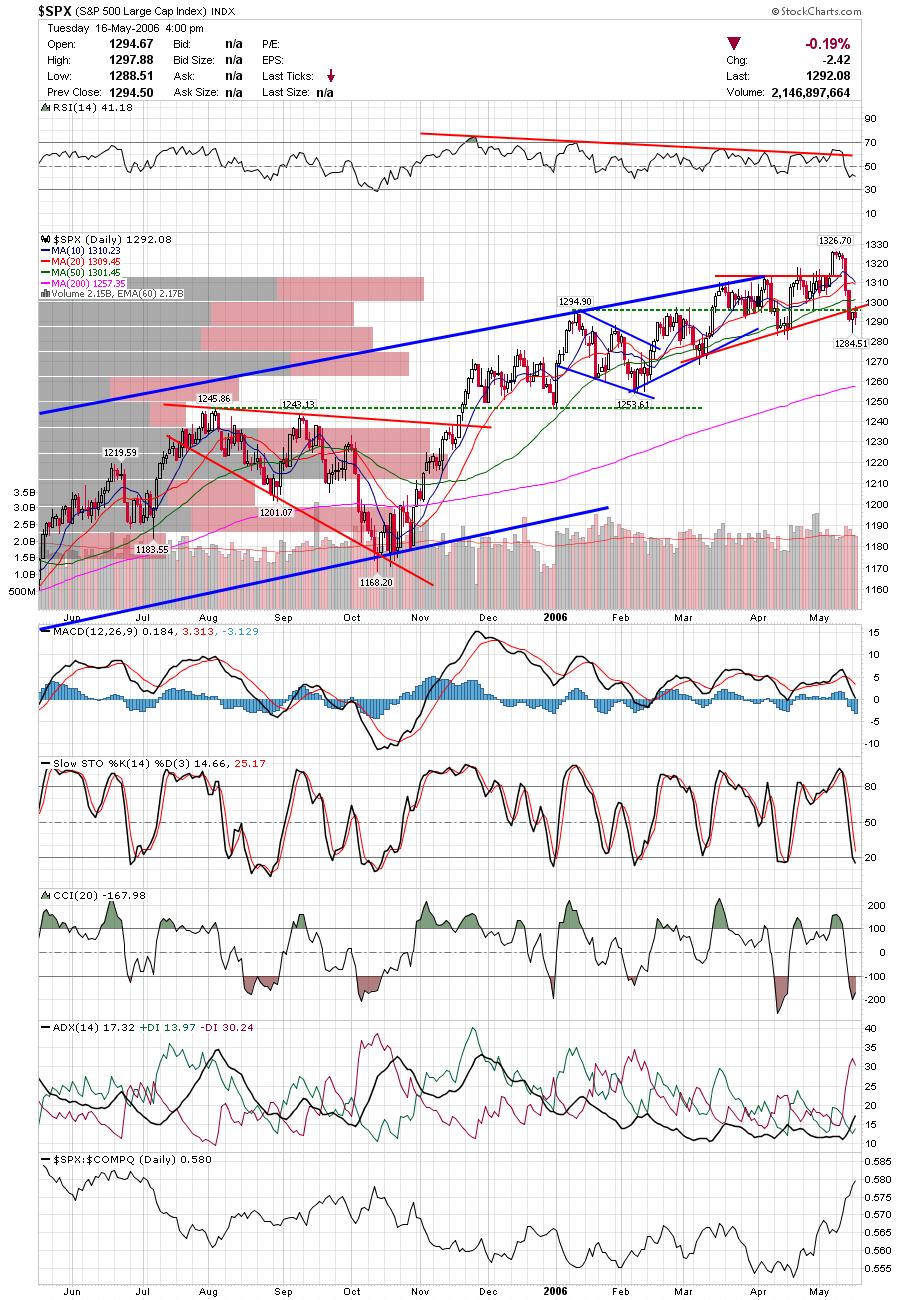
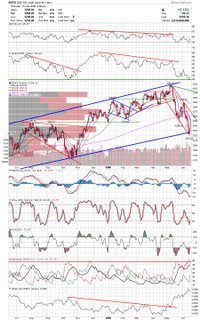
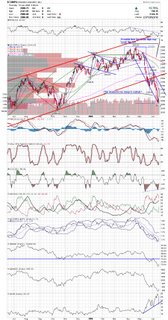
Here is a chart of the SP500. Note the steep downtrend channel and how we have moved pretty quickly to near the top of the channel. There are some signs that we will edge our way higher after the next few days of choppiness. Take a look at the stocks trading above the 50sma indicator and notice it is at an important low that marked the October low.
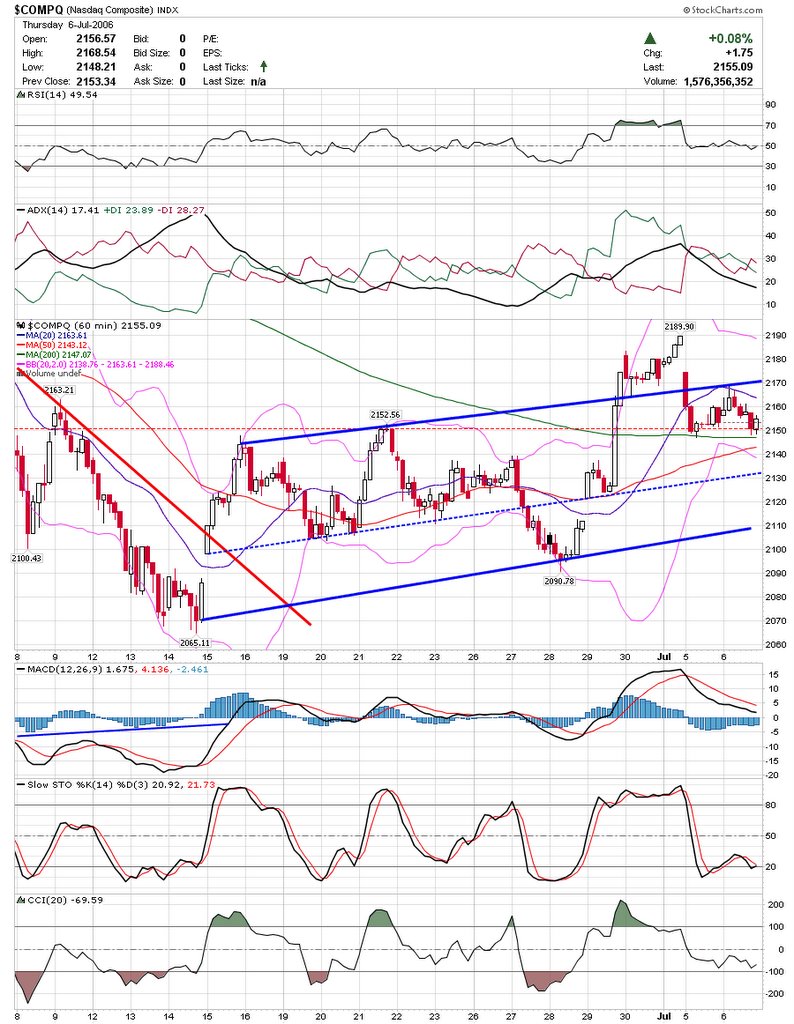
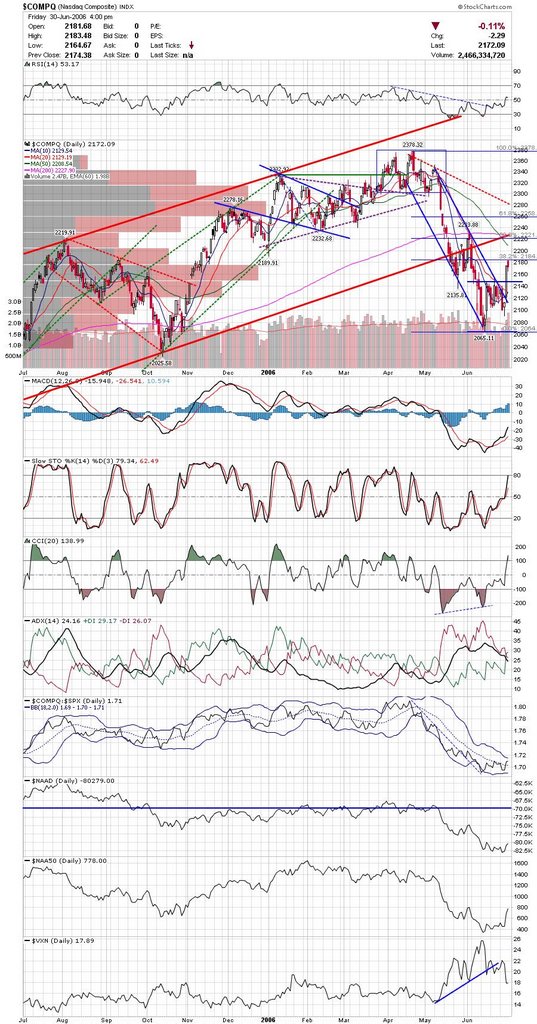
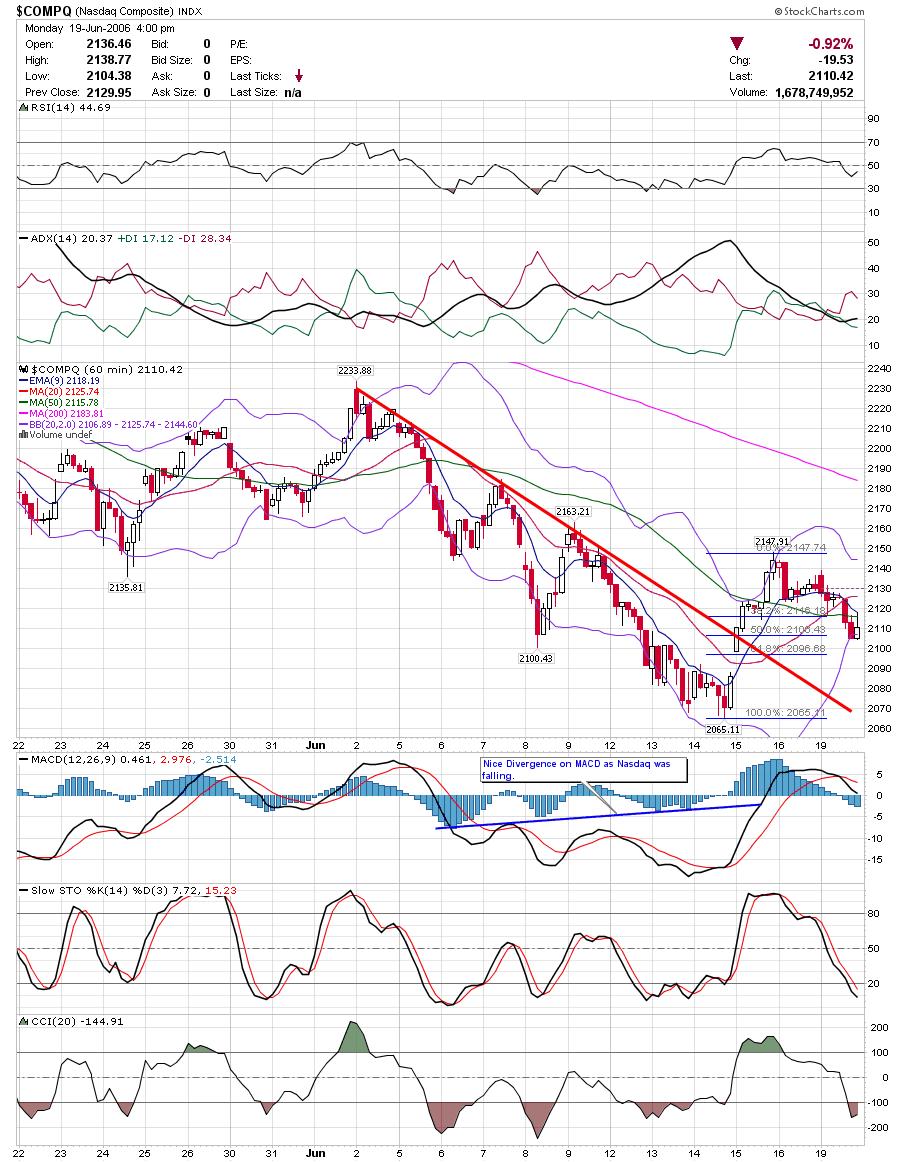
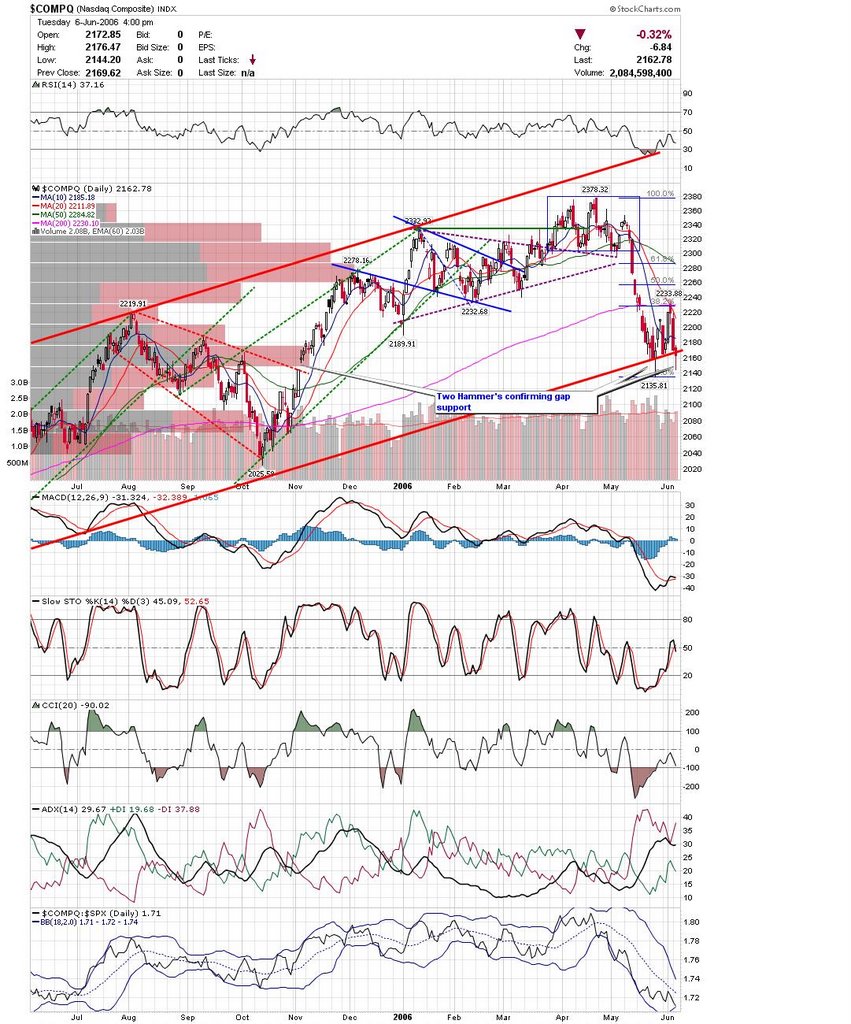
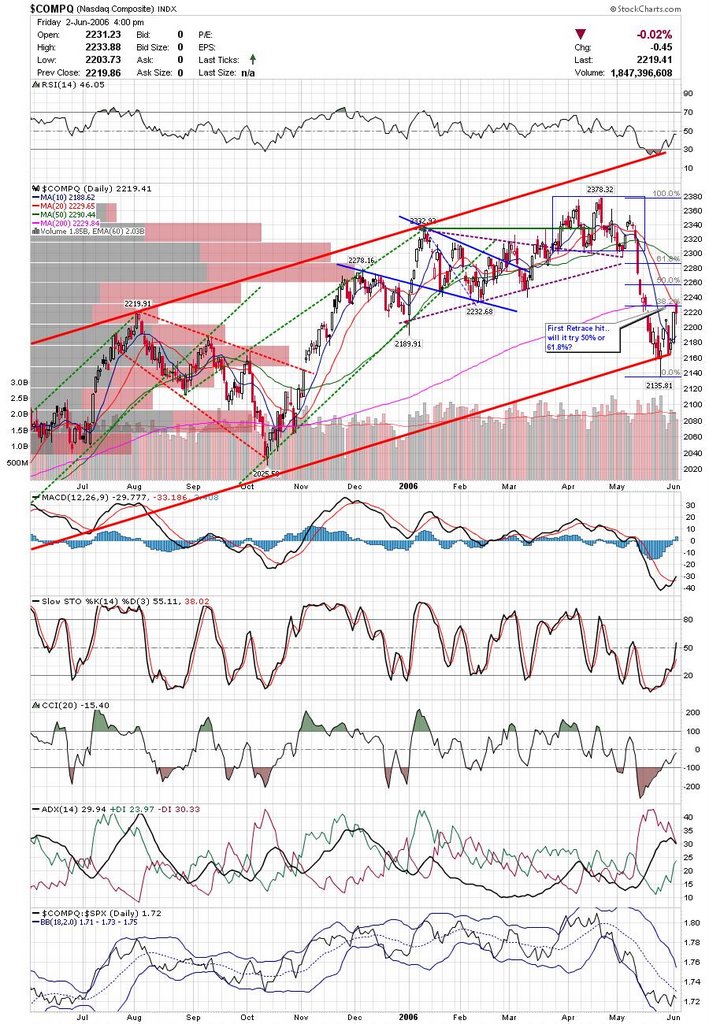
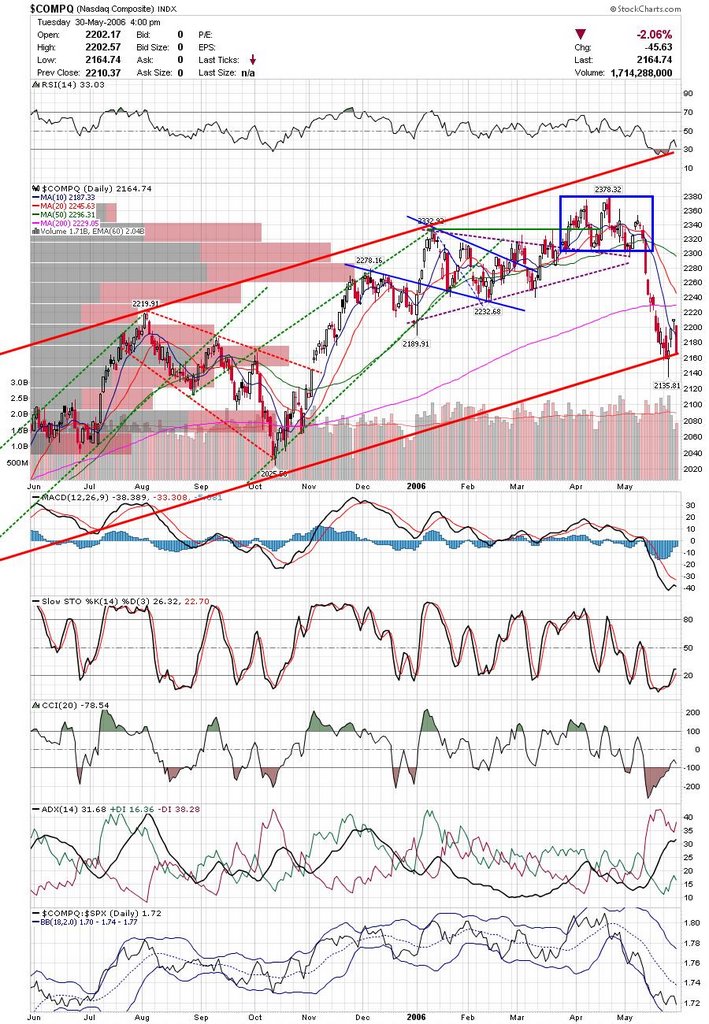
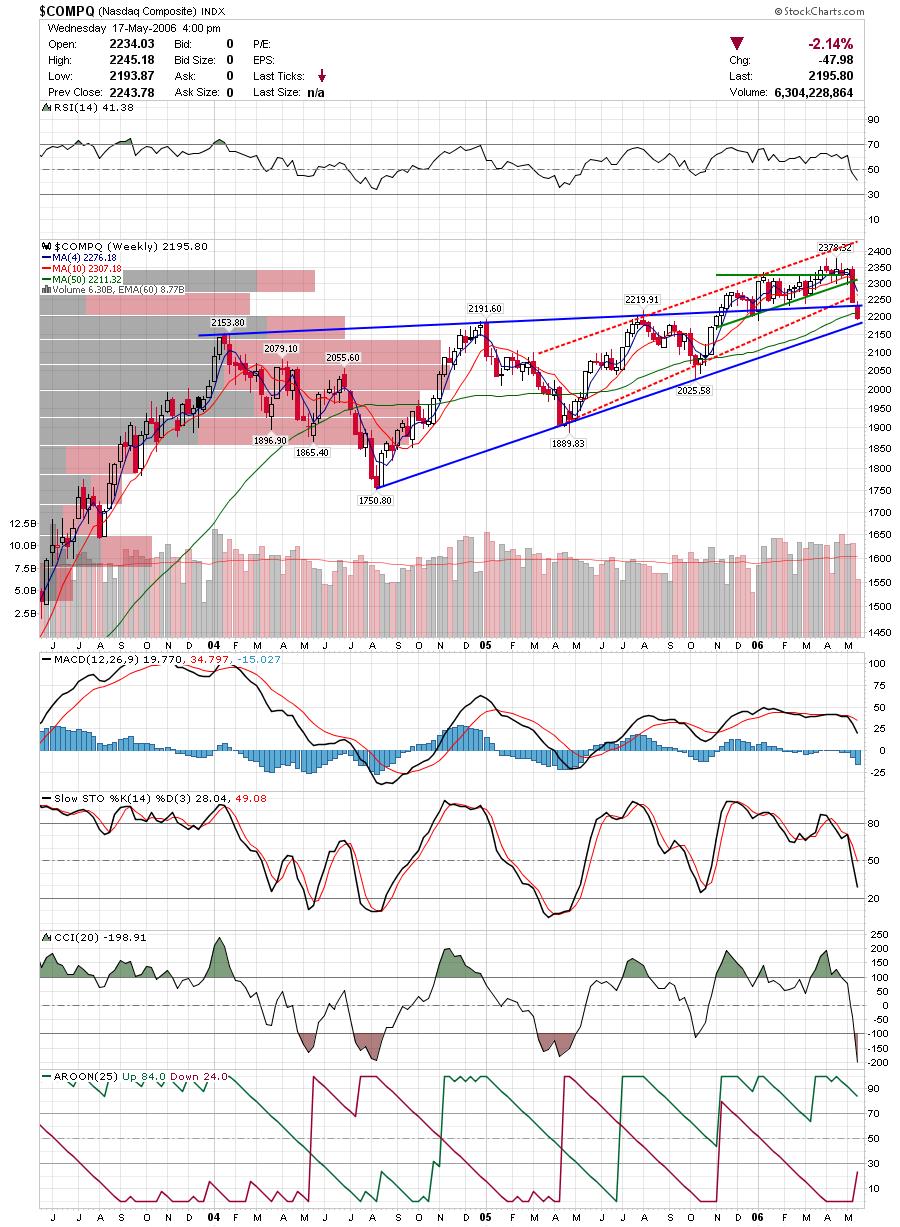
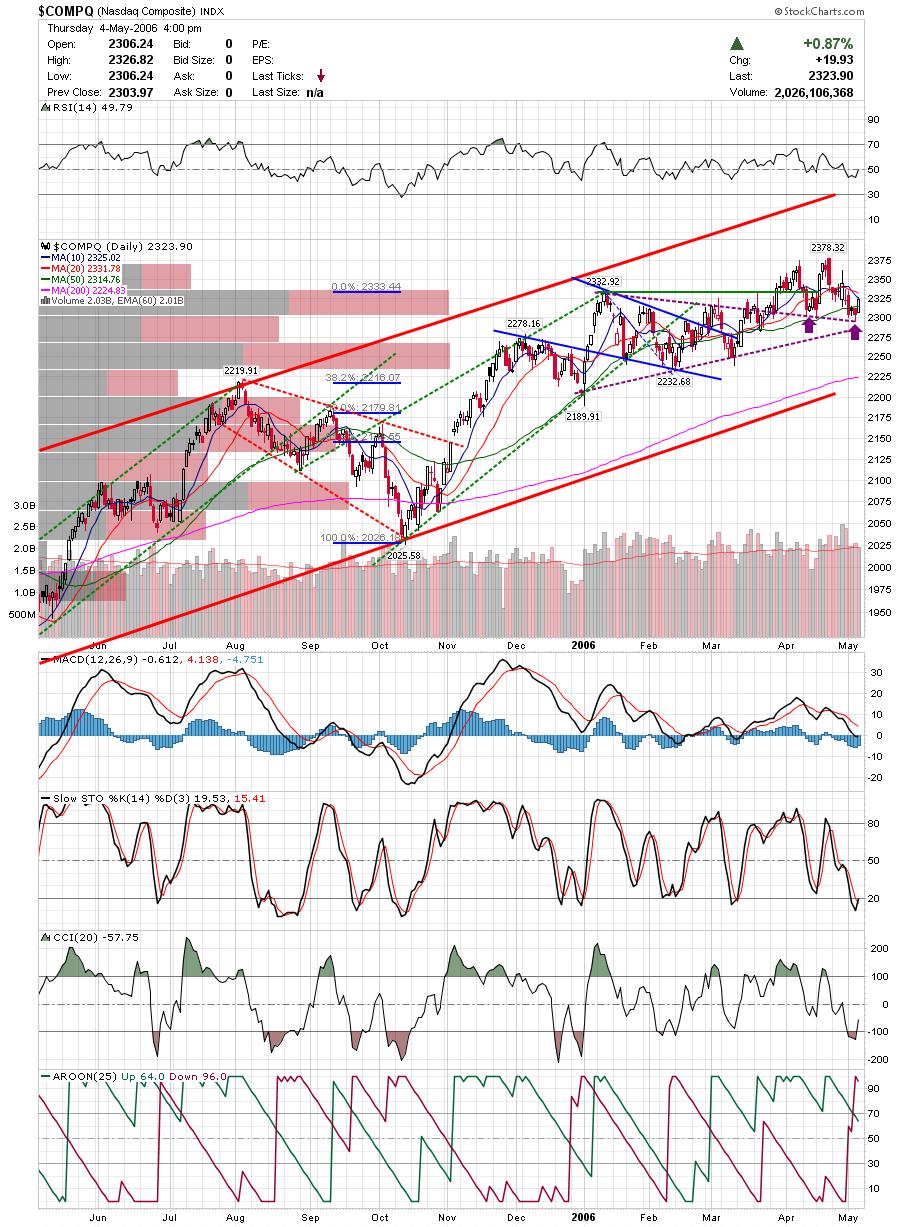
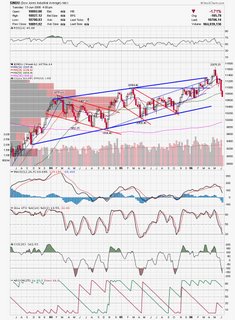
Here is the Nasdaq chart showing similar indicators, however, the Nasdaq is clearly below important support. Something that is interesting, is that the Nasdaq outperformed today and the Nas/SP500 ratio is starting to turn up a little signifying that market participants may be ready put some money to work.


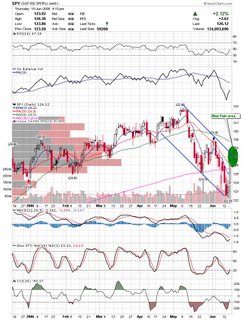
I mentioned that I don't trade on Options expiration and the main reason is the program trading and pinning of prices by the institutions. Keep in mind that in general, it is the institutions that write options and retail investors that buy them, and since they have more money they can protect their positions. If you are in a position or are trading, keep an eye on the open interest and try to look at it from the perspective of an institution that has written all these options to the retails. Here is an example, although it is a little harder to manipulate the SPY's. Look at the SPY chart and where it closed (126).

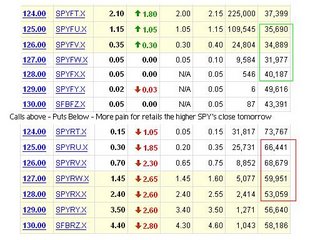
Now take a look at open interest for June Calls and Puts. There are a lot more puts out there then calls, therefore there will be more people in pain if the price runs up tomorrow. I would expect that there would be no way they let it fall below 125 so I would not be short tomorrow.

Although I expect some continued stength in the coming weeks, I believe that we have topped and a new downtrend will begin in the near future. I just don't think it will happen in the next week. I will be playing to the longside for daytrades or short swings for now while keeping my eye on the recent lows.

Good Luck,

DT


No Update Tonight Posted by downtowntrader | 6/14/2006 09:31:00 PM | 0 comments »

Sorry, but there will be no update tonight.

DT


Some Chart Damage being done Posted by downtowntrader | 6/13/2006 11:23:00 PM | 0 comments »

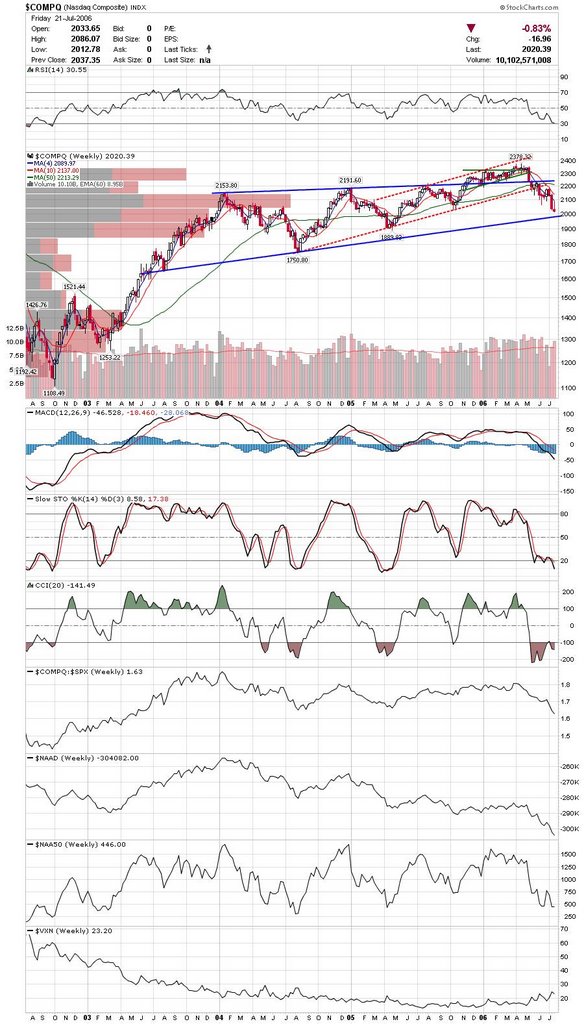
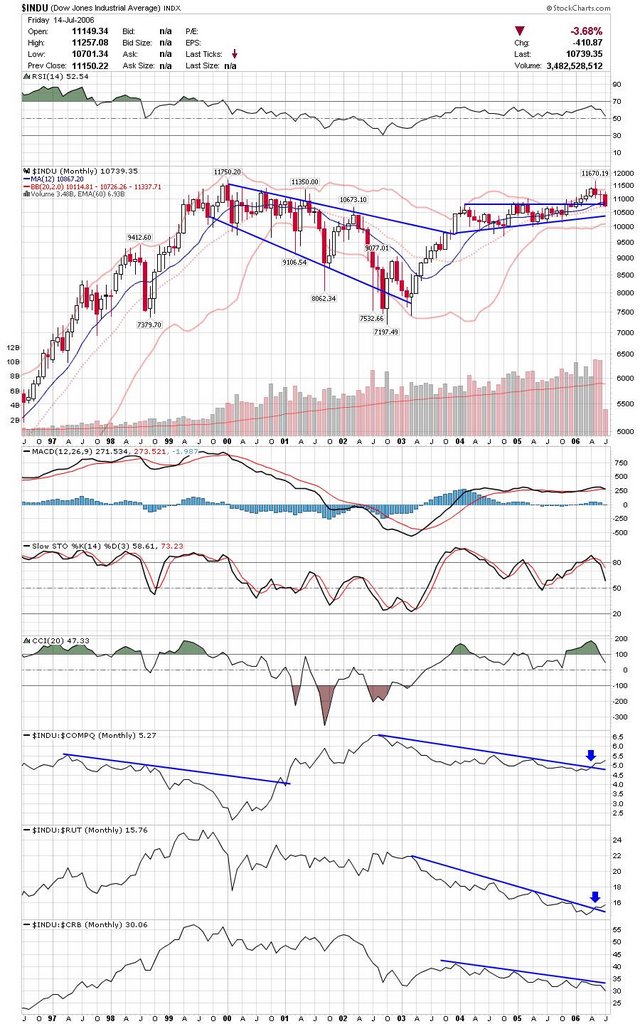
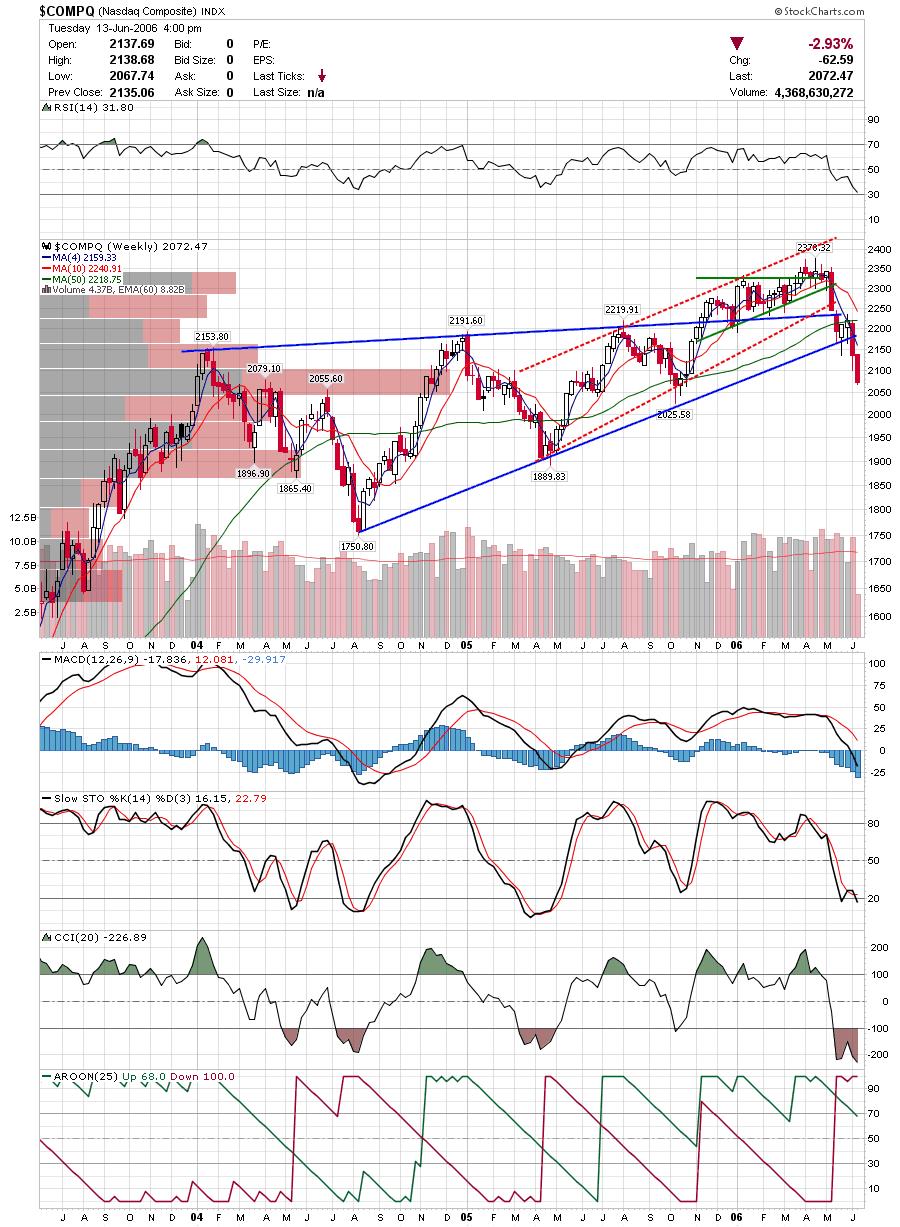
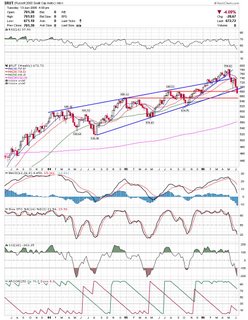
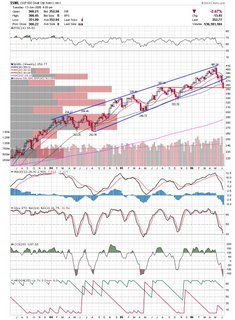
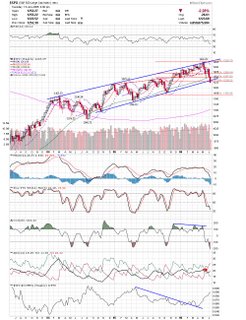
There has been some serious chart damage the past few sessions on all the indices. While I still maintain that we are near a bounce, it really looks like we still have lots more downside before the year is up. I think it's a dangerous to initiate new shorts here and there is not much to be had on the long side. I am posting my weekly charts of the major indices for a little perspective on where we stand.

Here is the Nasdaq Composite breaking all kinds of support.

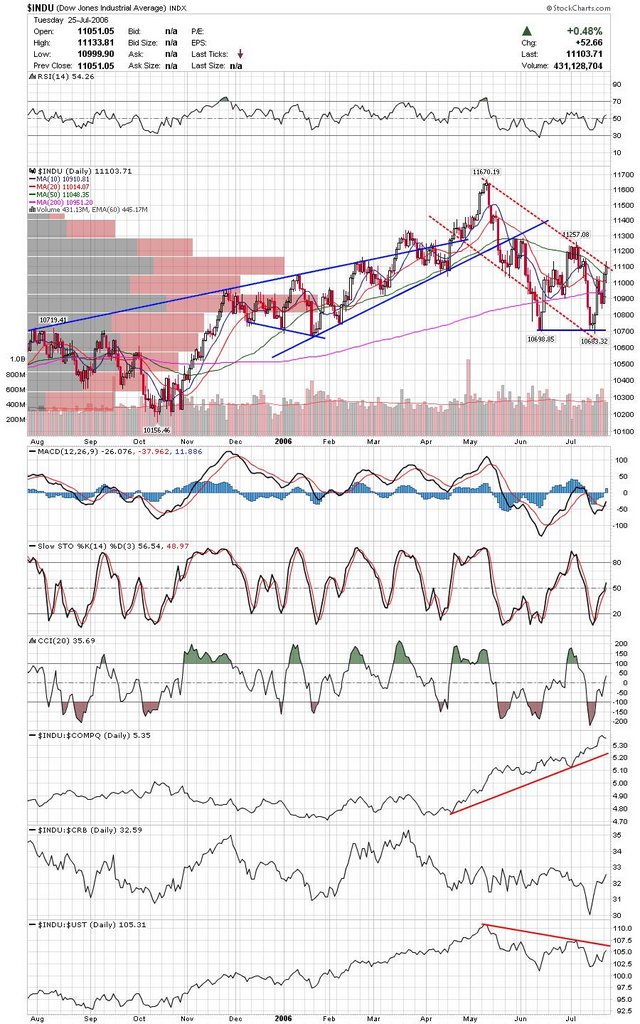
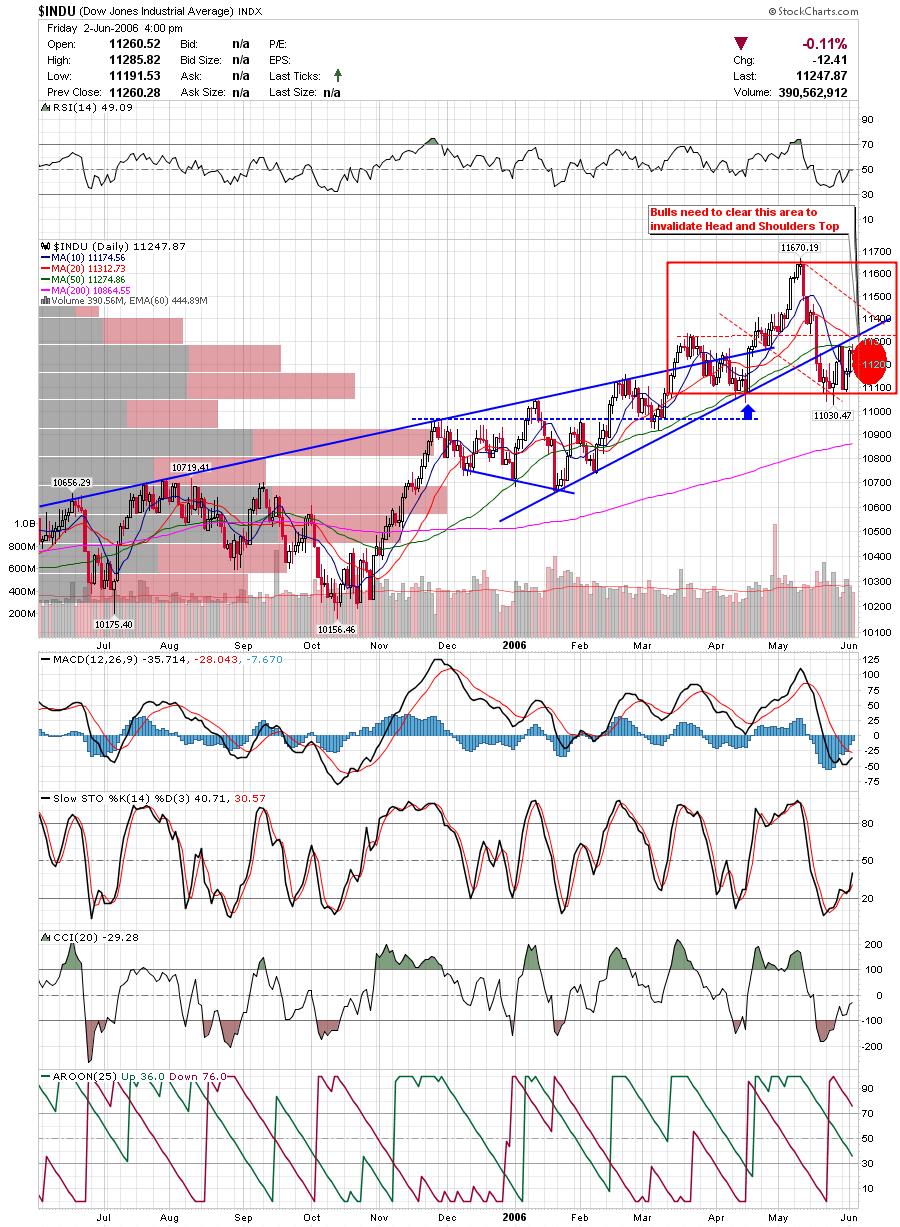
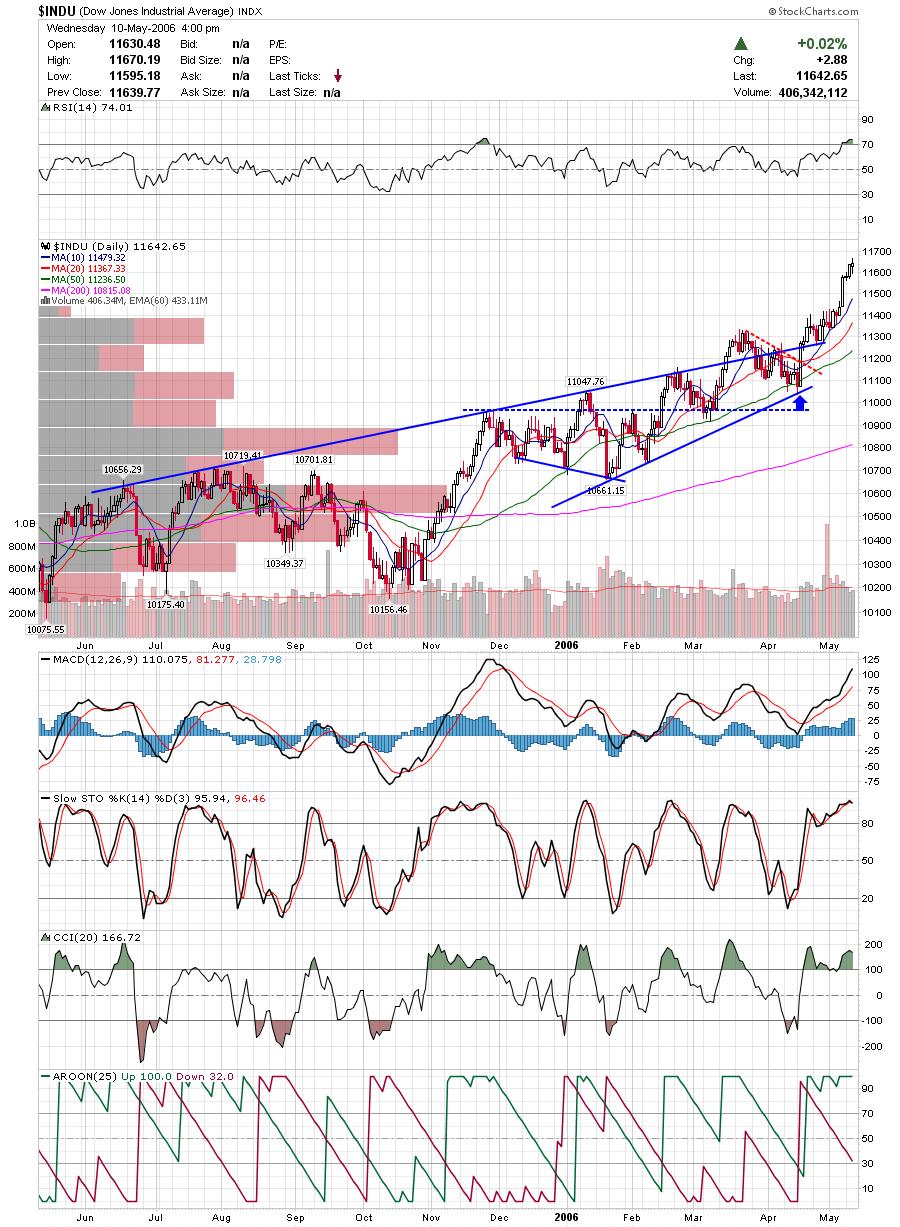
Here is the Dow Industrial Average which has broken some support levels but remains well within the long term channel.

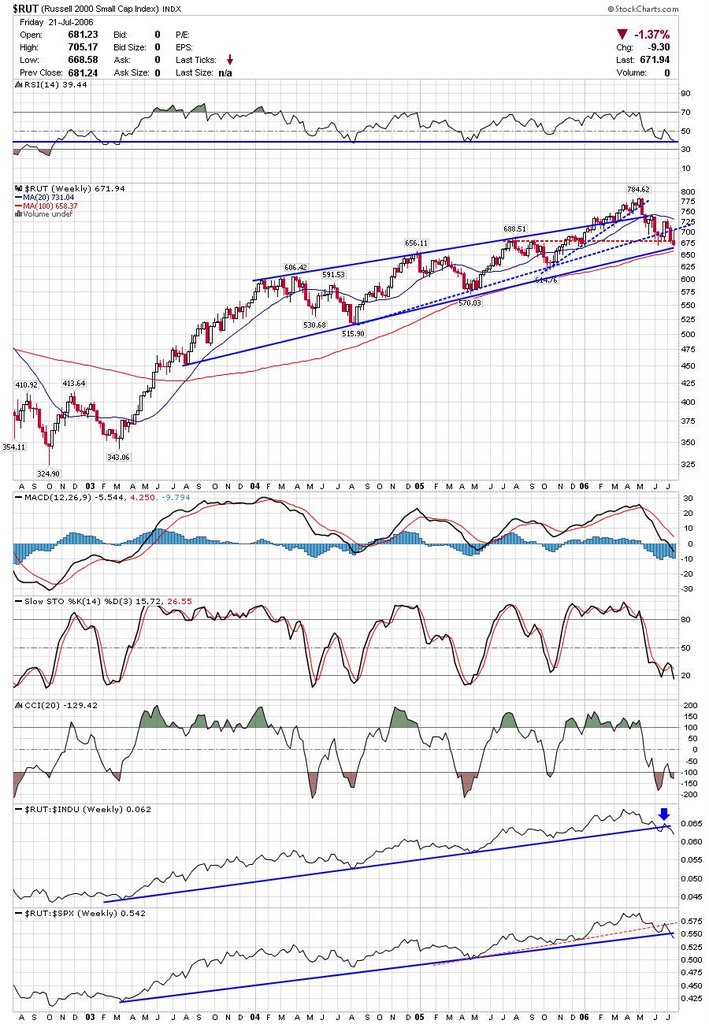
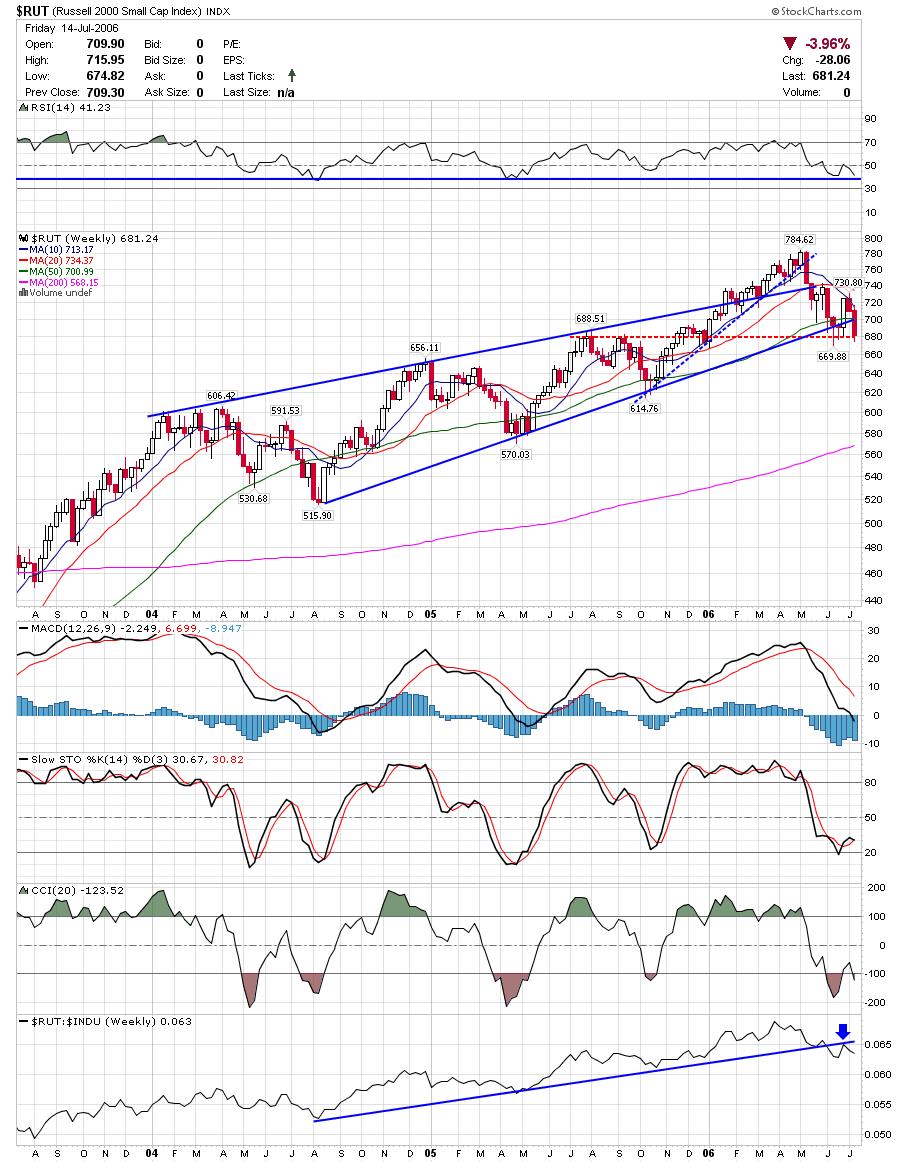
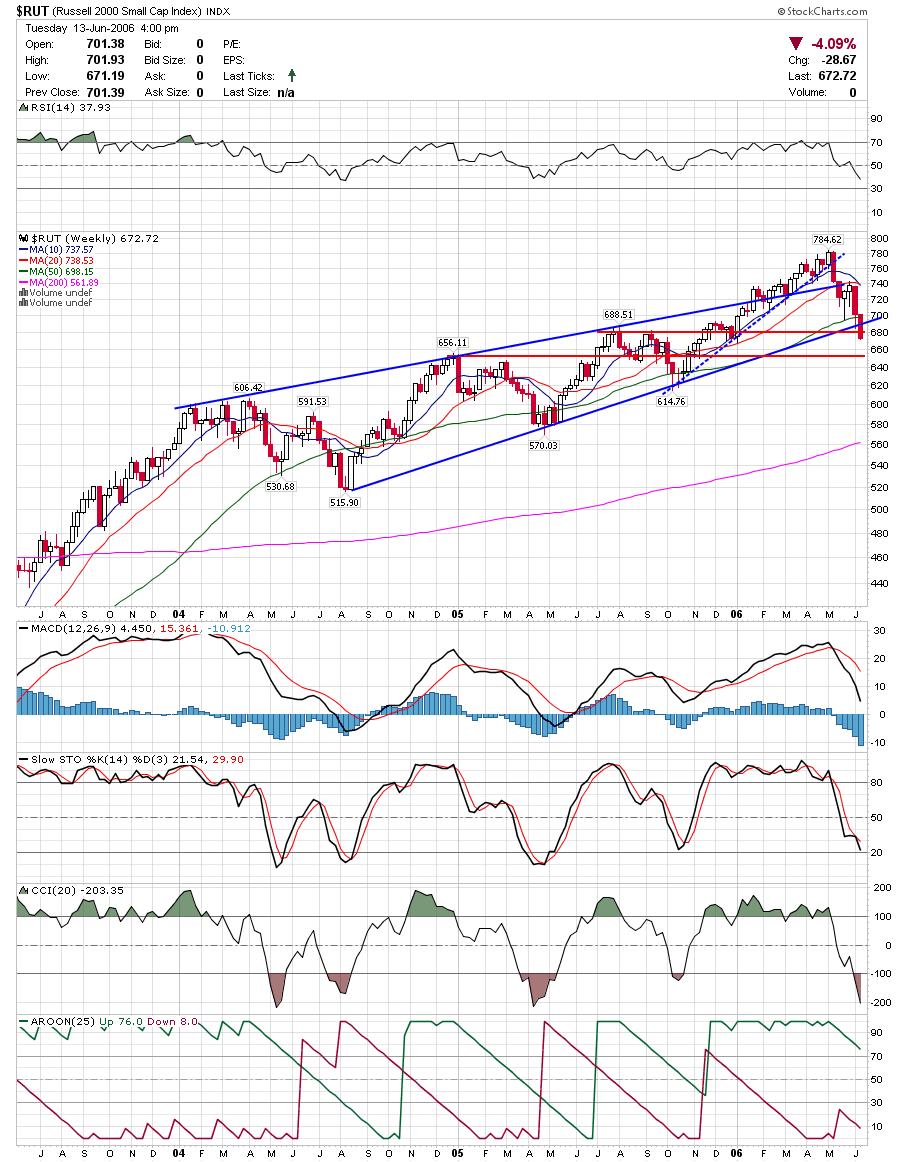
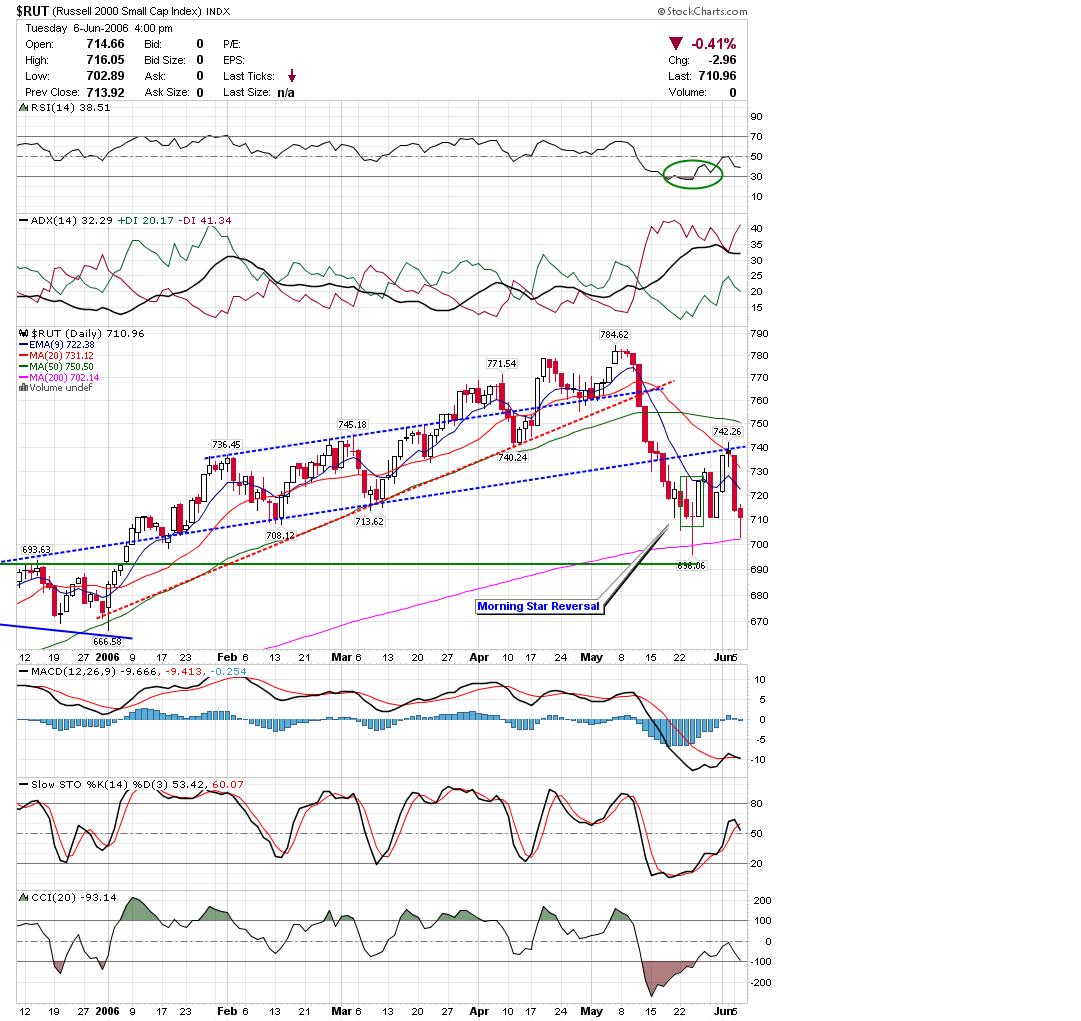
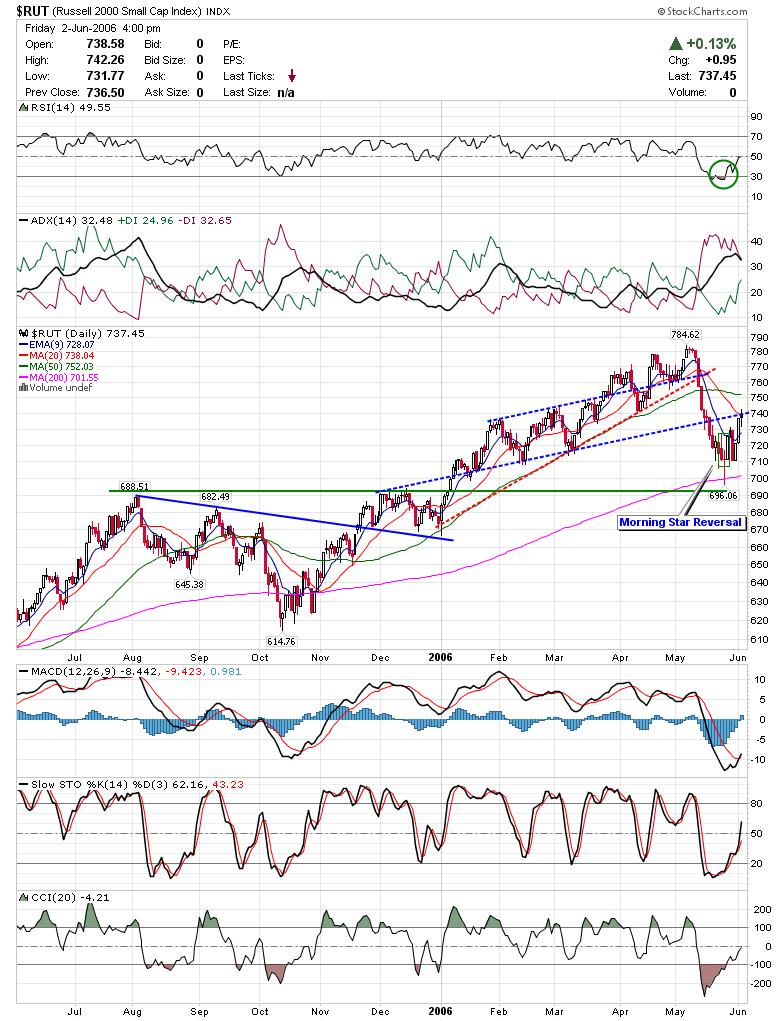
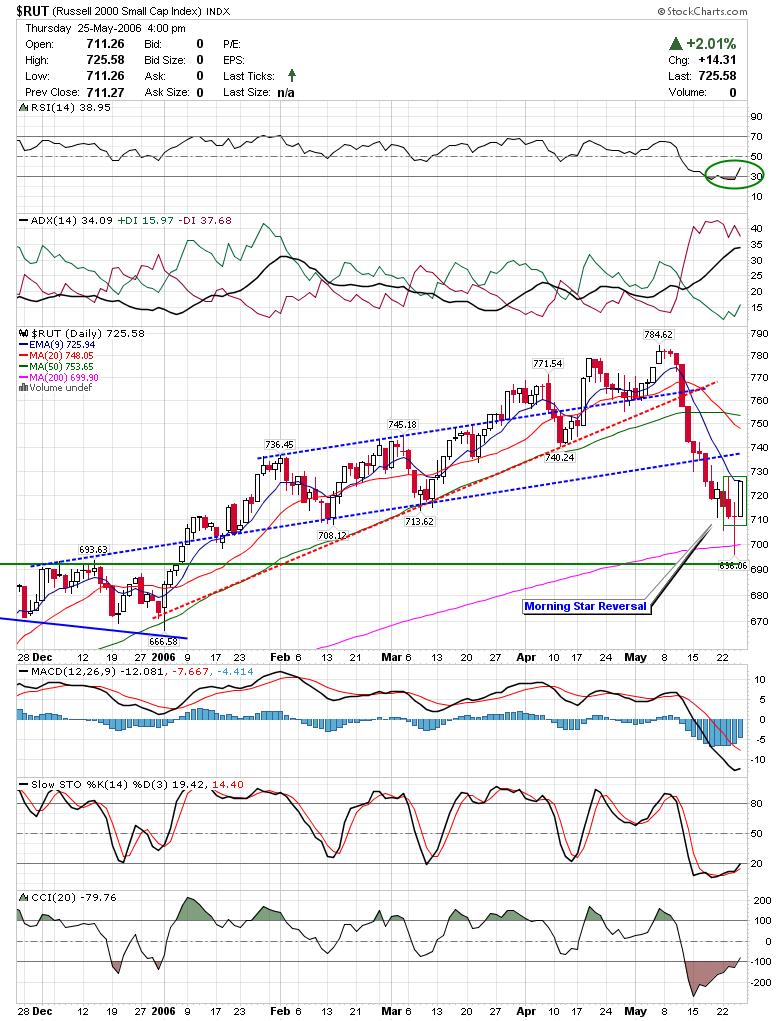
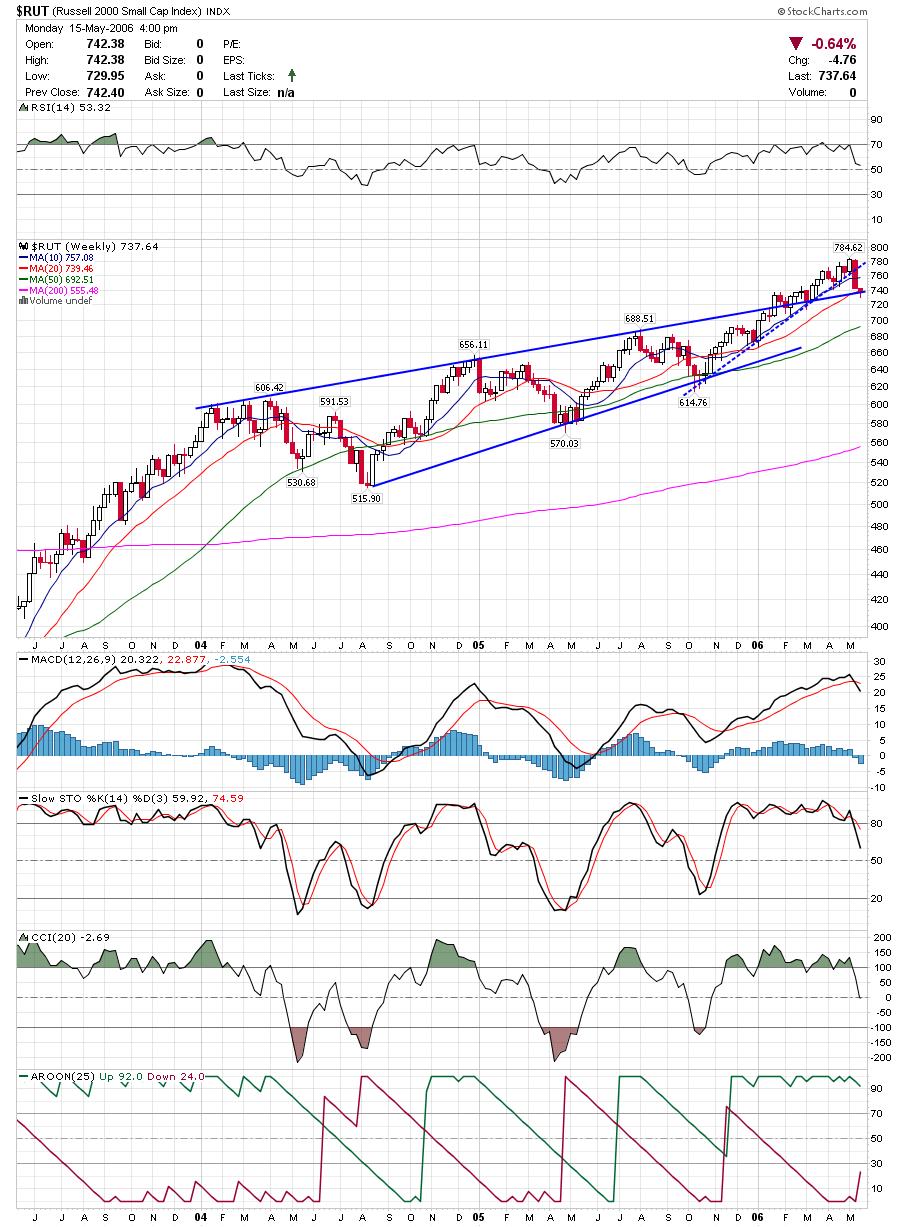
Here is the Russell who still has a decent shot of closing the week within the channel.
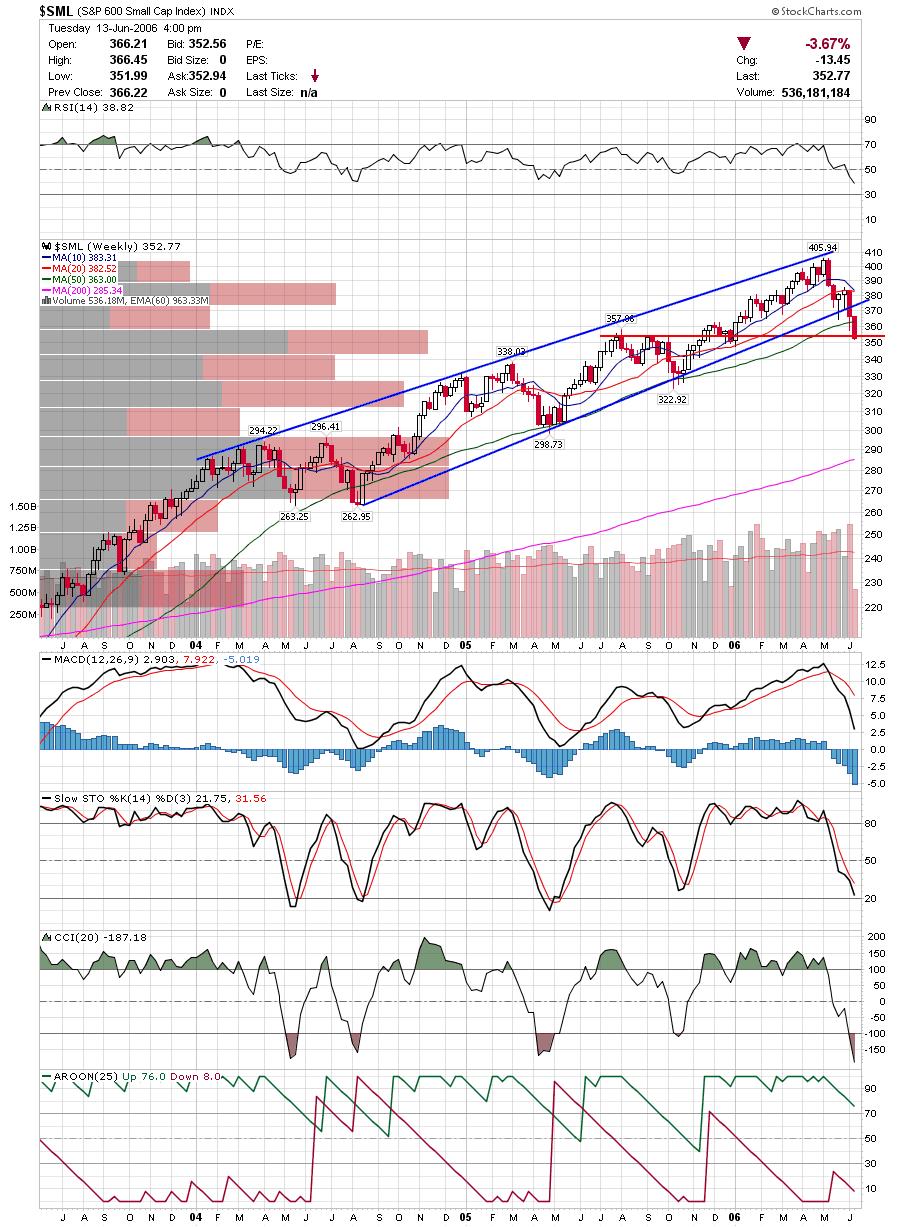
The smallcap SP600 is trying to hold a horizontal trendline but there are clear signals that there is major distribution occuring.
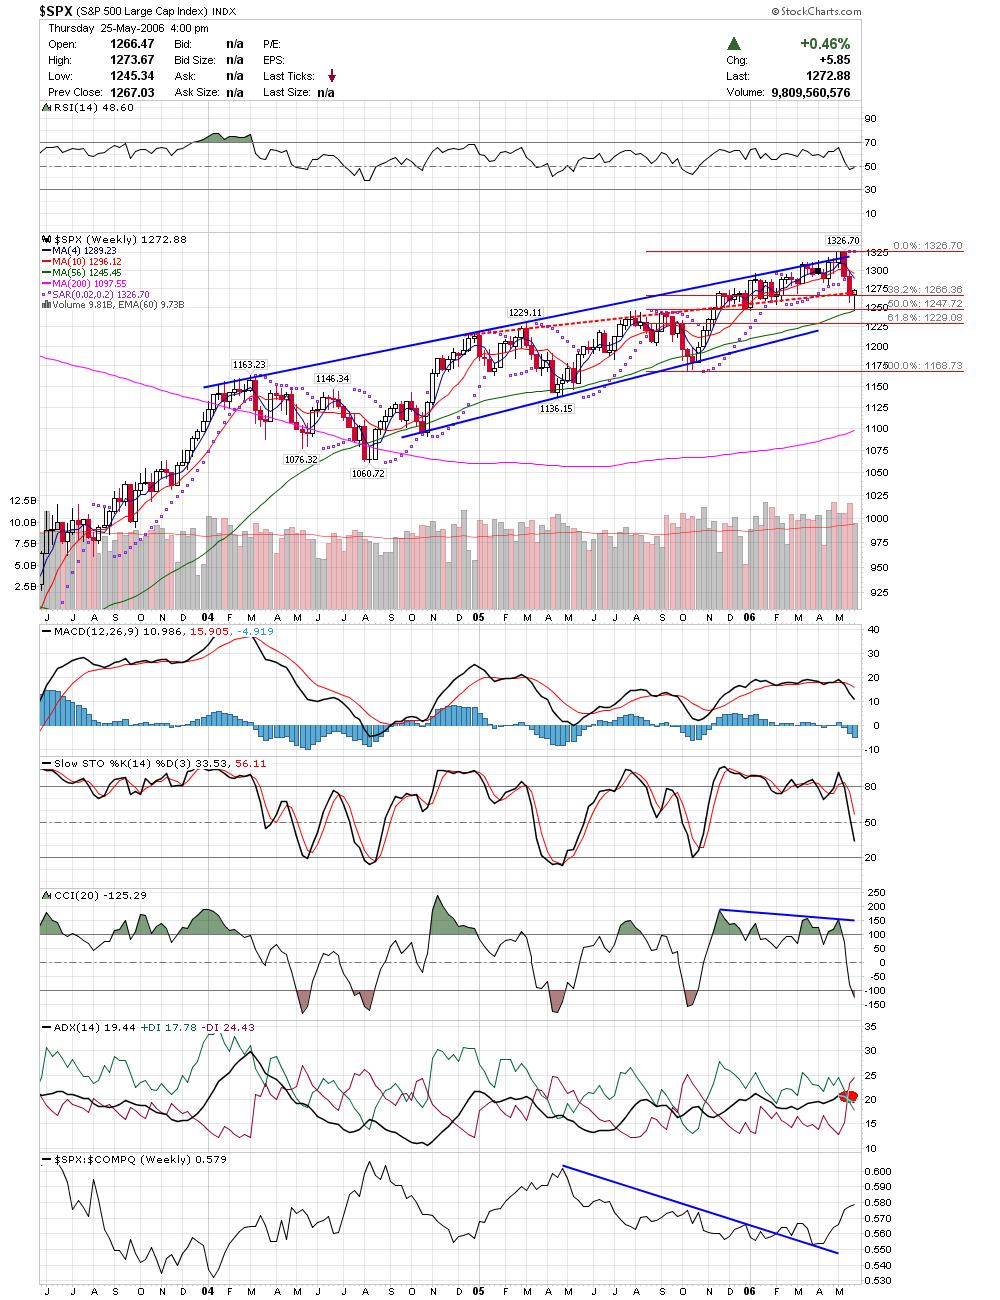
The SP500 is trying to cling to the channel.
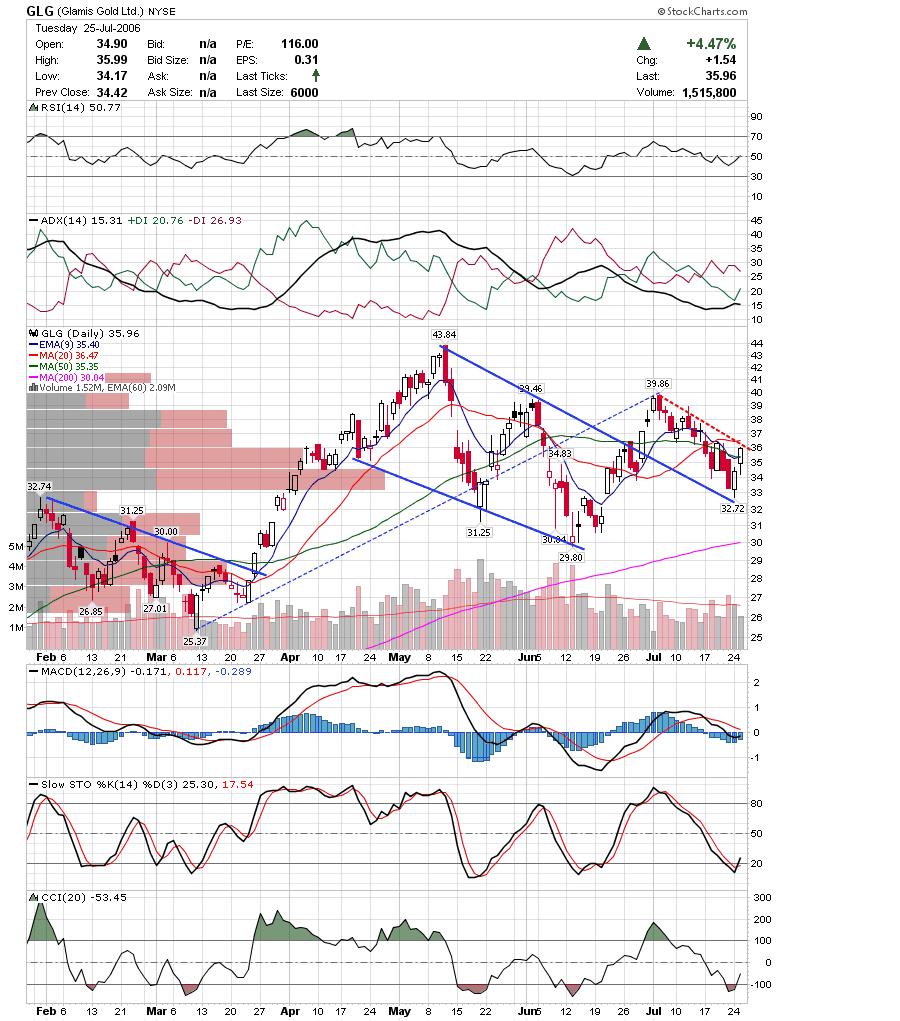
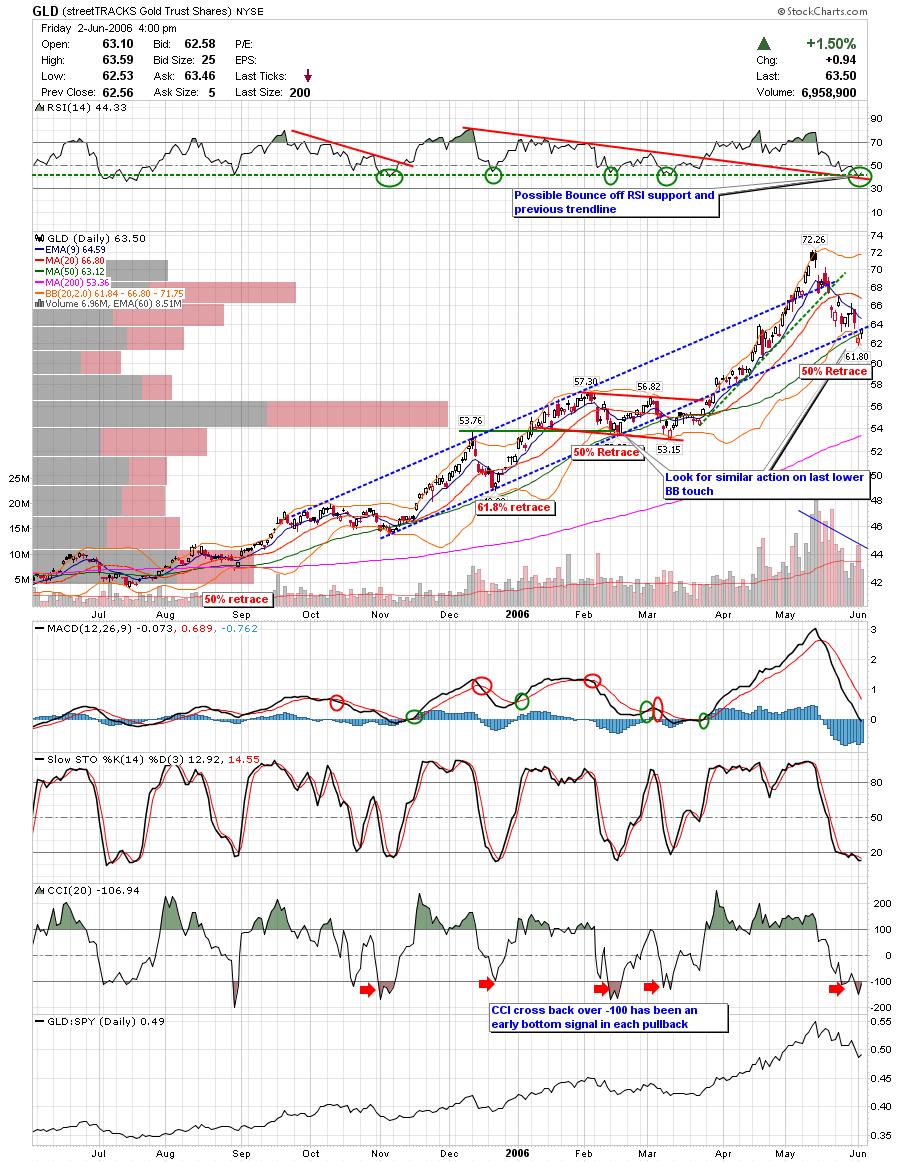
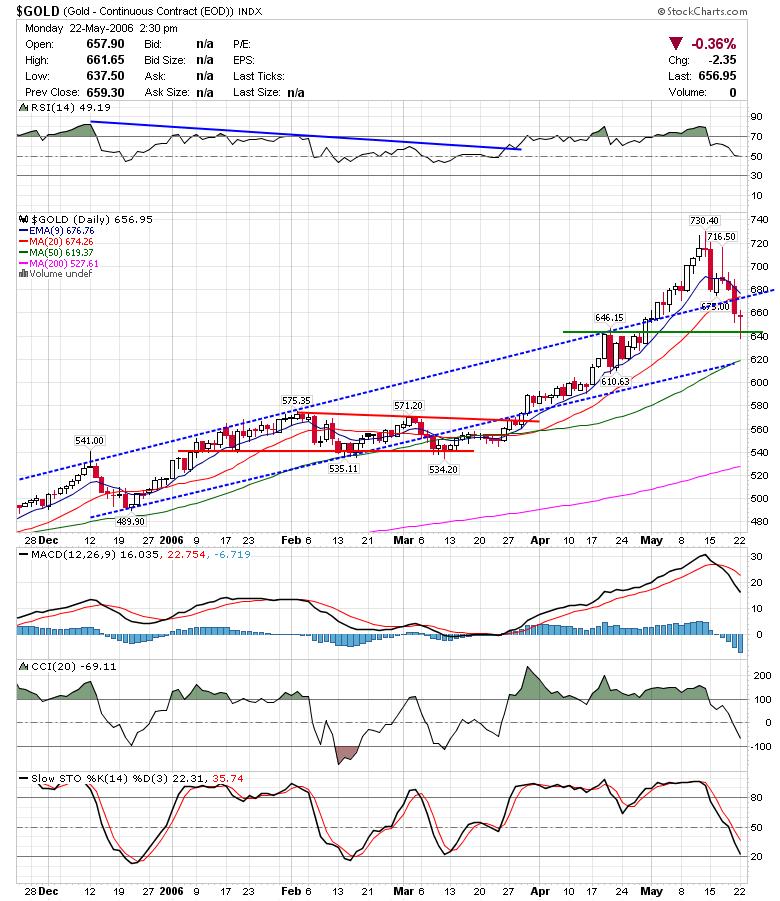
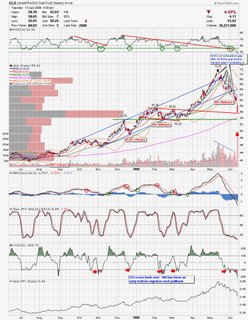
Has Gold capitulated? Today's move in GLD seemed like a panic move and may signal the short term bottom. Looking at the chart I see all sorts of gaps down followed by this large gap on the largest volume since inception. I will be watching the gold stocks here.
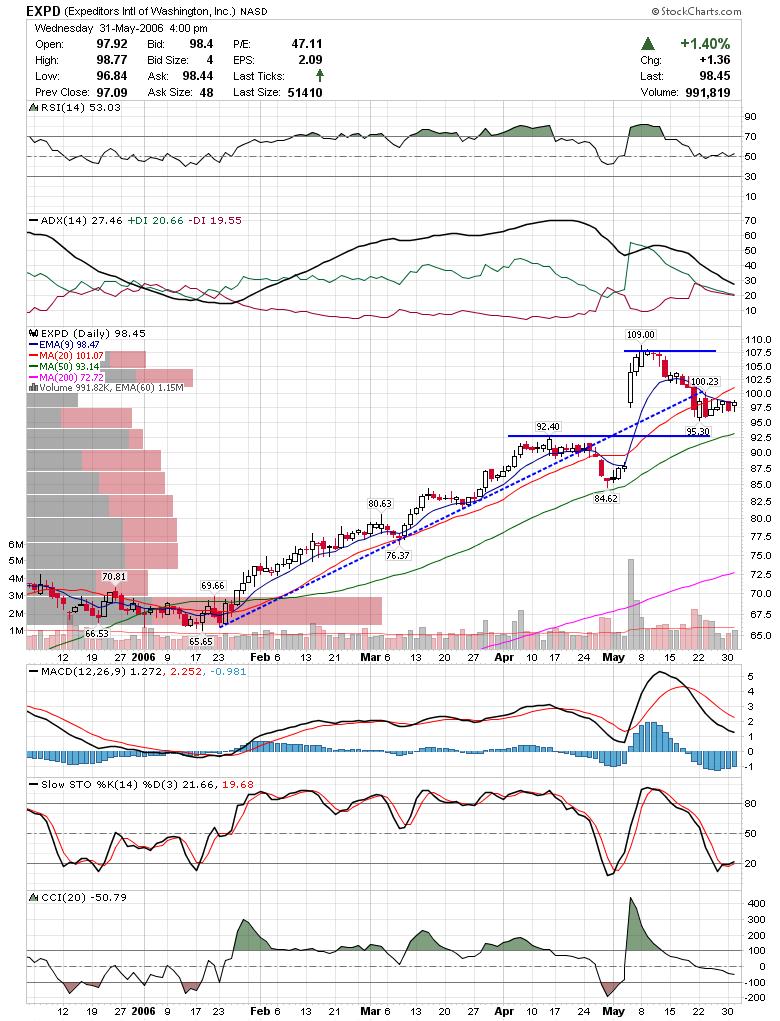
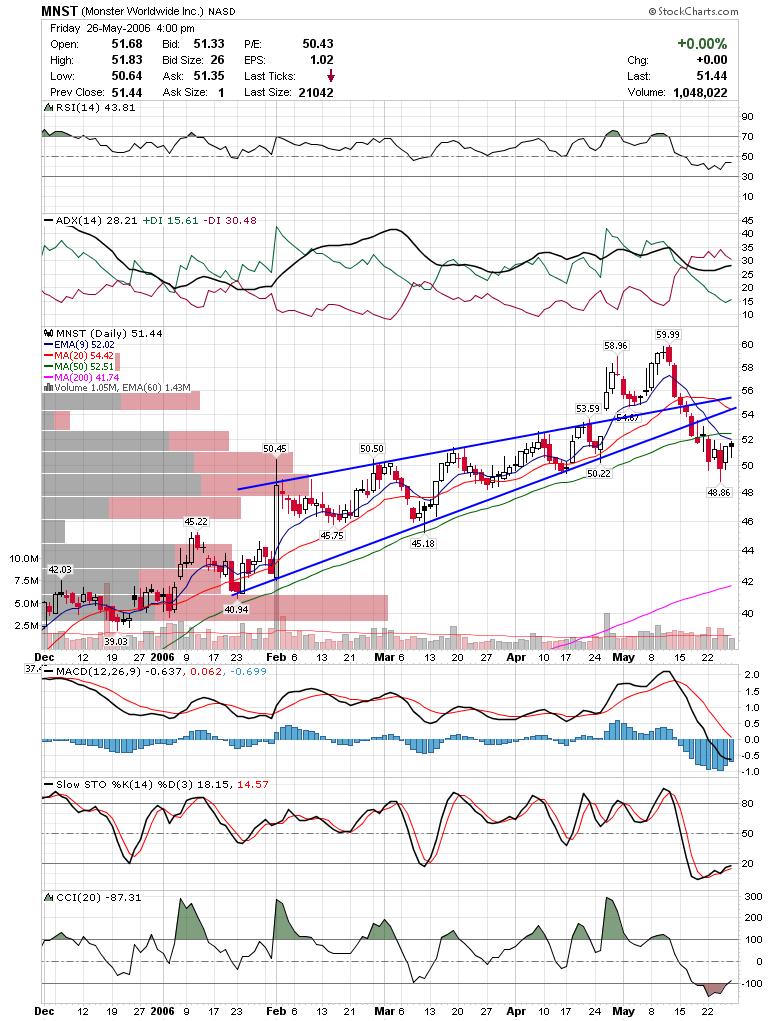
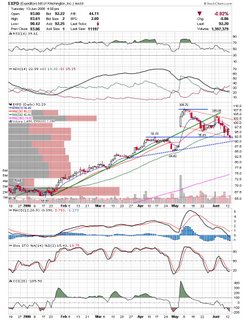
EXPD has held gap support and may get a bounce here near previous resistance.
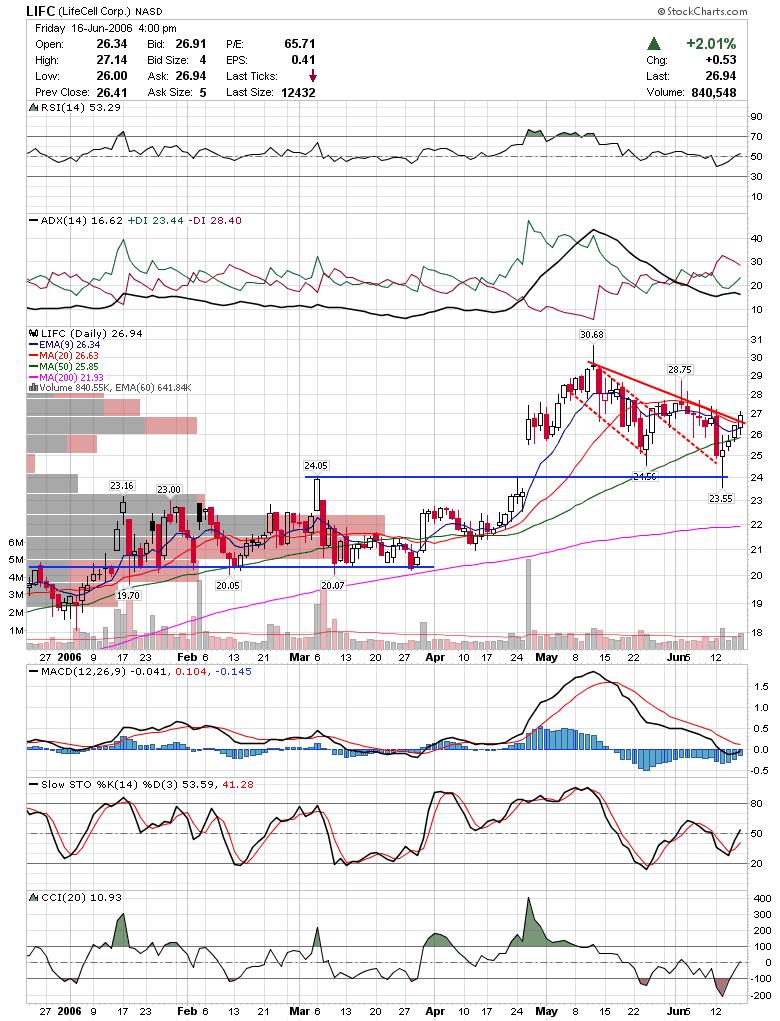
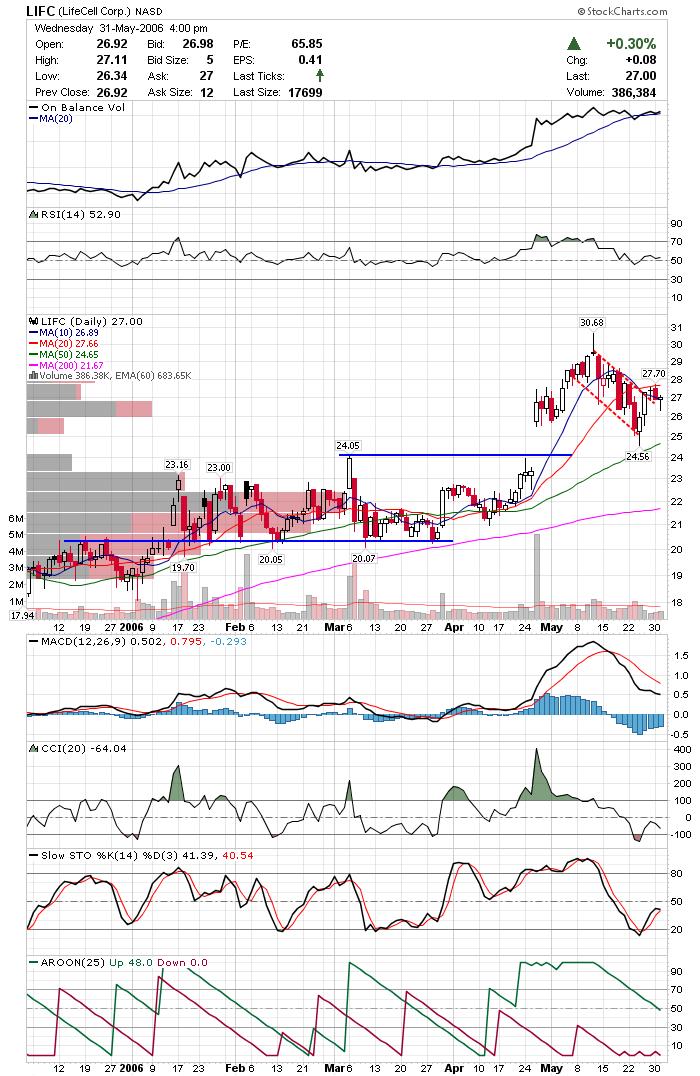
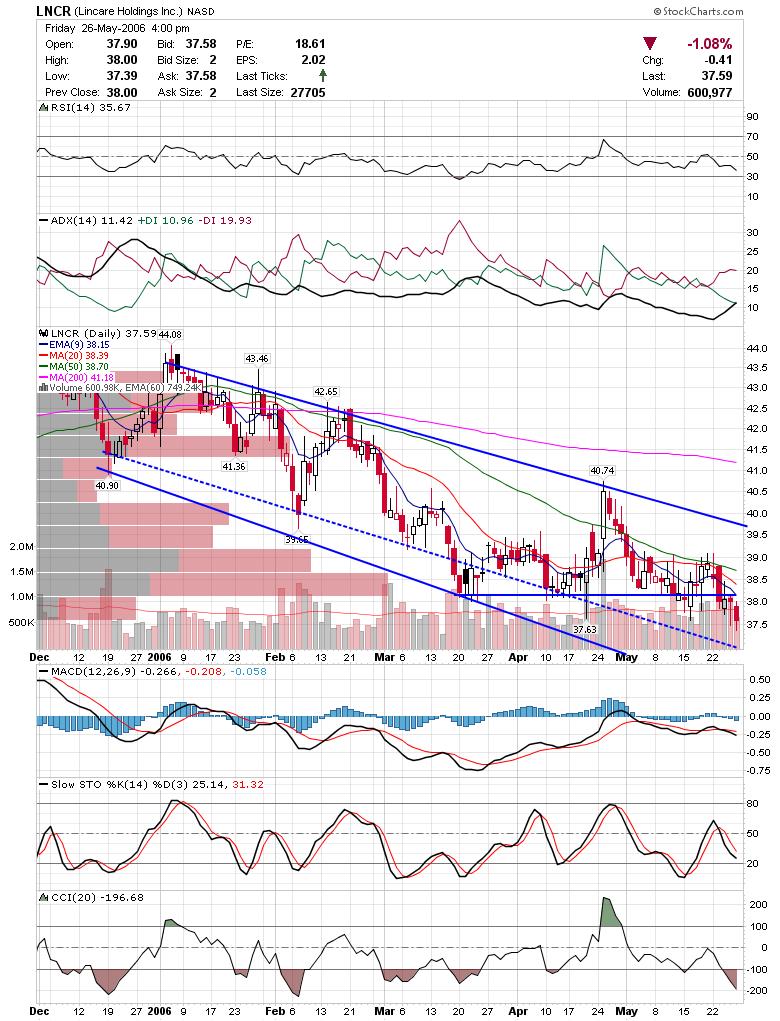
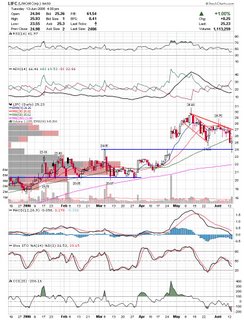
LIFC came back and filled the gap and quickly reversed. Watch to see if this was the bottom for now.
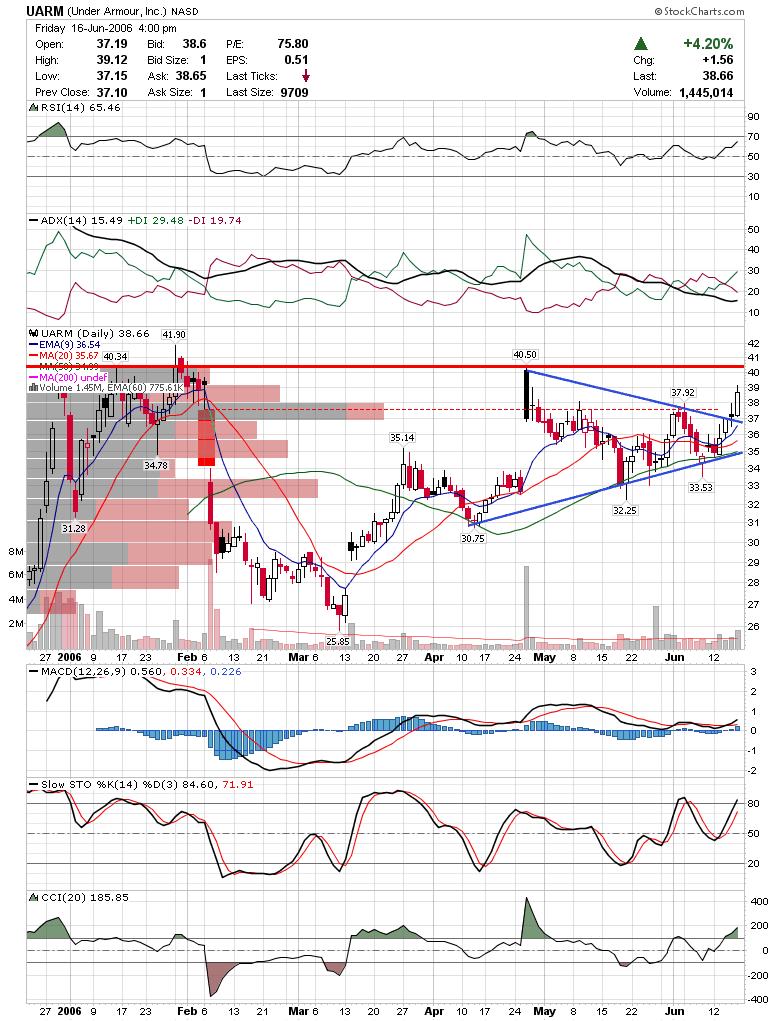
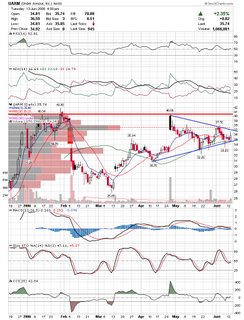
UARM could have an explosive move to either side of this triangle with the odds being higher right now.

Good Luck,

DT


Traders Expo Posted by downtowntrader | 6/11/2006 10:37:00 PM | 4 comments »

I had a good time this last week at Traders Expo getting to listen to the likes of Martin Pring, Oliver Velez, and John Person. I also got a chance to speak with vendors about trading products that I use and have been looking at.

I have been looking at possibilities for mechanical systems lately and I was interested in looking at products that would help me back test and possibly implement trading systems. On my list were Tradestation, Wealth Lab's Pro, ESignal, and speaking to the team at my current platform, Cybertrader.

I have been a little disappointed with Cybertrader for a few reasons. I think their back testing of strategies is pretty pathetic. They don't let you modify many of the entry and exit methods and the indicators available are slim. I asked them about any future enhancements and they were pretty vague about their plans. I hope to get a better response soon, as I have been pretty happy with several aspects of their platform such as execution speed, slippage, and commisions.

I visited Tradestation with great hopes and left a little disappointed. While their backtesting looked good, they don't let you implement pieces of it as an exit strategy and they left much to be desired as a trading platform. The following are drawbacks that led me to quickly take them off my list.

No Server side alerts: Cyber let's you setup trading alerts and keep them on their servers. This is pretty cool because if you have a communications problem or PC issues, your alerts are still active.

No Mobile Platform: I use my Treo 650 to keep tabs on my positions and can enter orders at any time. Tradestation has no mobile support.

Commisions: At least for equities, Tradestation does not come close to Cybertrader for commisions. Tradestation charges 1 penny per share up to 500 shares, and then .005 per share after that. Cyber charges .006 per share. This doesn't seem like much, but for active traders it can be a drastic difference. This works out to a $2 difference on 1000 shares, so if you trade 100K shares a month you are paying up $200 bucks for Tradestation, and I typically trade well over that.

Unfortunately ESignal did not have a booth at the show so I didn't get a chance to look at it. I did get the software though and plan on testing it out. If anyone has experience with ESignal and especially with the strategy testing piece, please feel free to drop me a note on it.

As I mentioned before, I enjoyed some of the presentations at Traders Expo and I was able to find web articles that were pretty much what was presented at a few of the sessions.

This link is to the actual slides Martin Pring used for a session on Short Term Bar Patterns. This was a pretty good session, although fairly basic. I did realize though, how few traders in general truly understand bars/candles and the underlying psychology behind them. I highly recommend reading a Pring or Nison book for all traders.
Pring
This link is an article detailing how market makers hide their actions on level II (fairly obvious but worth looking at)
Pugliese
This is a good article by John Person showing how he uses Pivot points (which I use on my intraday charts)
Person

No charts tonight.

Good Luck,

DT


Sunday Night Charts Posted by downtowntrader | 6/11/2006 09:20:00 PM | 0 comments »

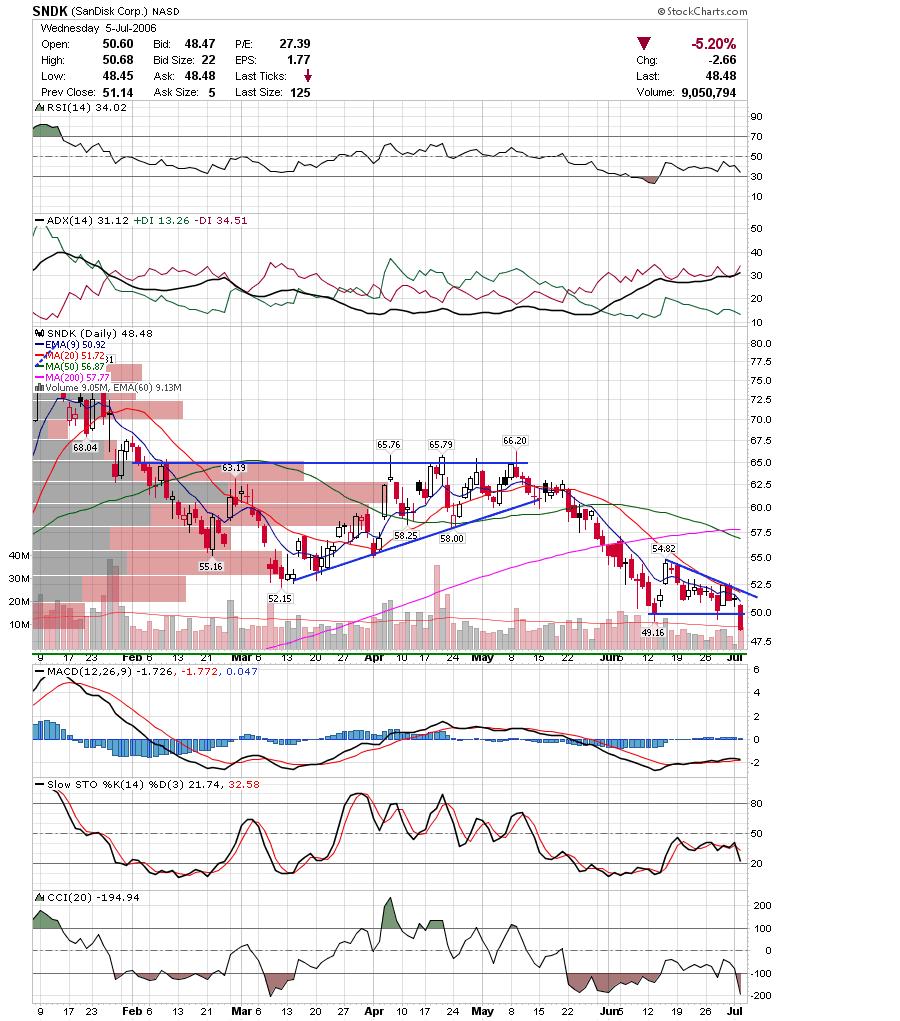
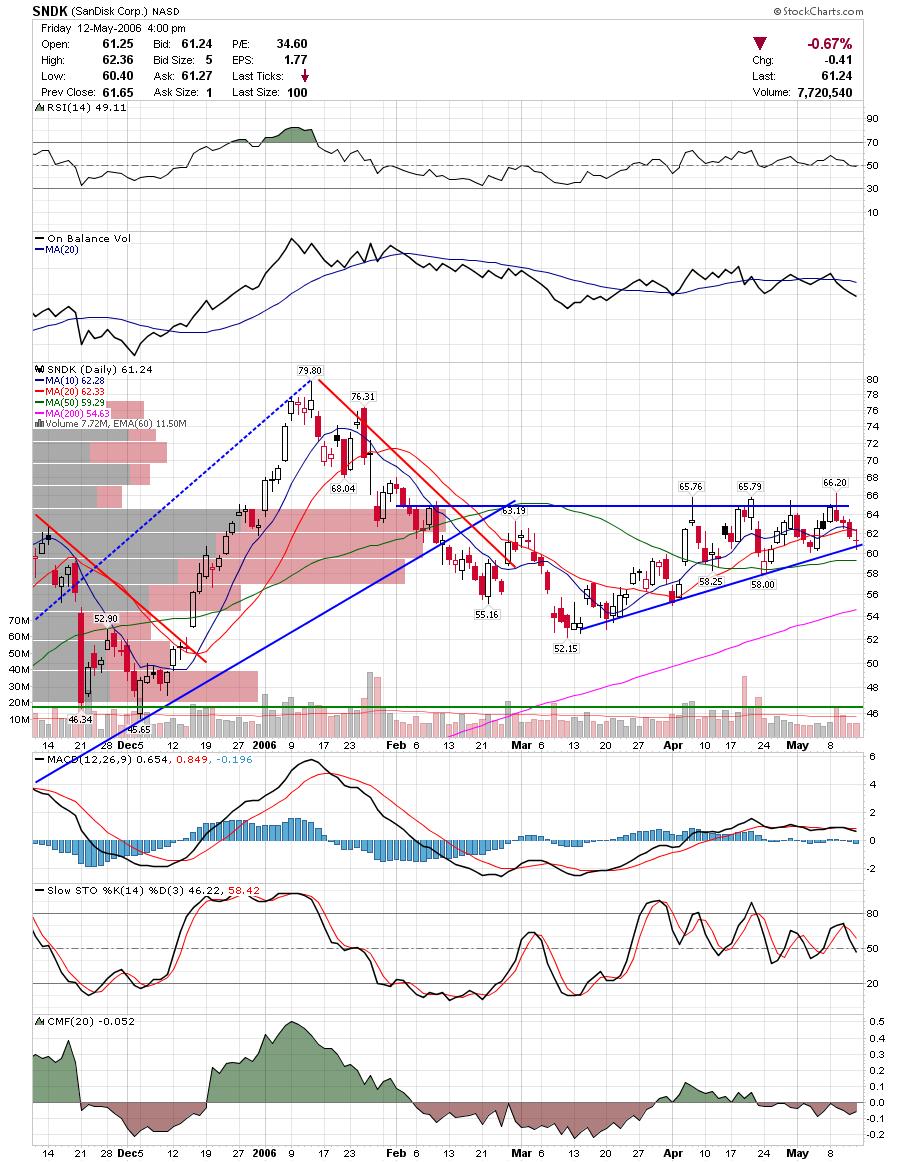
One of the things I do each Sunday night is to review the updated Investors Business Daily 100 list. I keep a chart list on my stockcharts account of the 100 and keep it current to the list on IBD. The list is generated electronically and takes their propietary fundamental ratings and technical ratings into account. They have certain criteria such as where in the yearly range the stock is. One clue that the market has been deteriorating is that there are some pretty weak stocks making the list each week. SNDK for example was off the list and made it back despite falling further from their 200 sma last week. I still think we are oversold and due a bounce, so I am not looking to short right now. I am looking strictly at stocks that are hovering near support and showing good one or two day candle patterns.
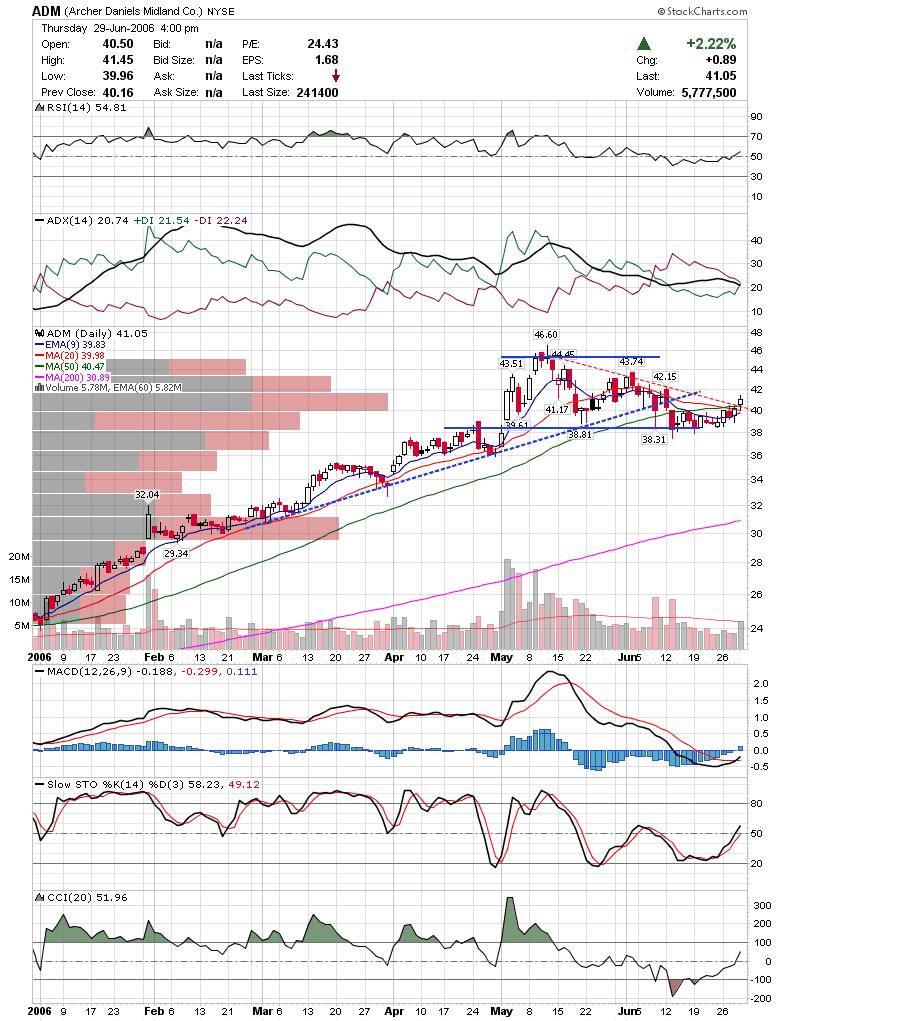
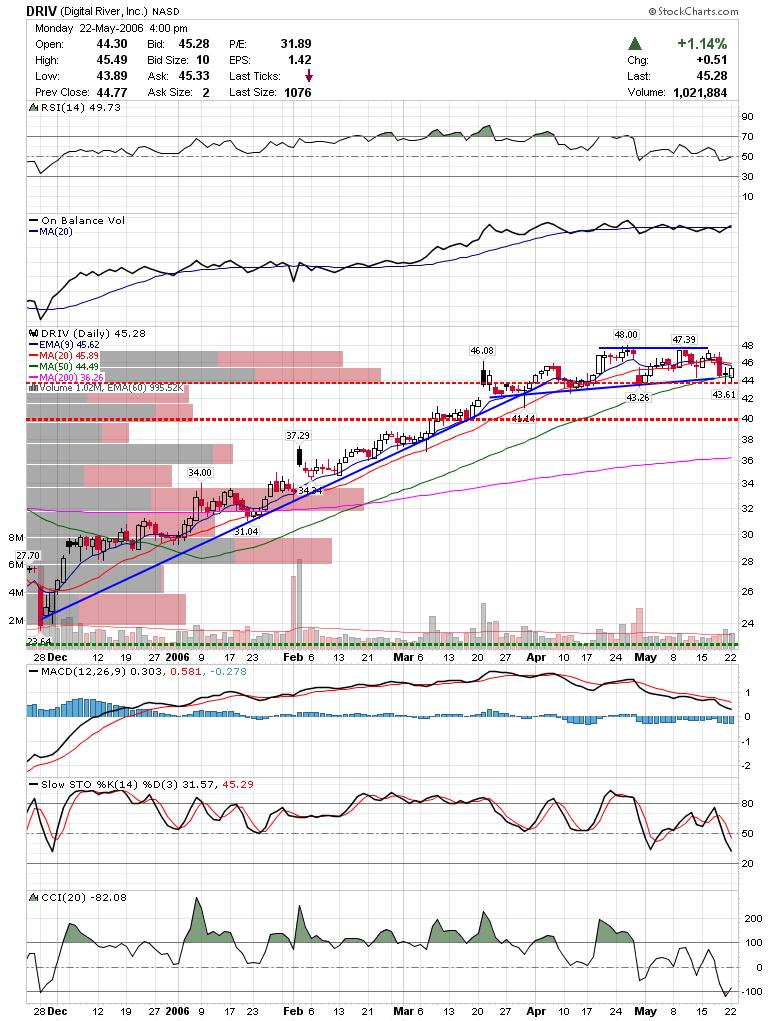
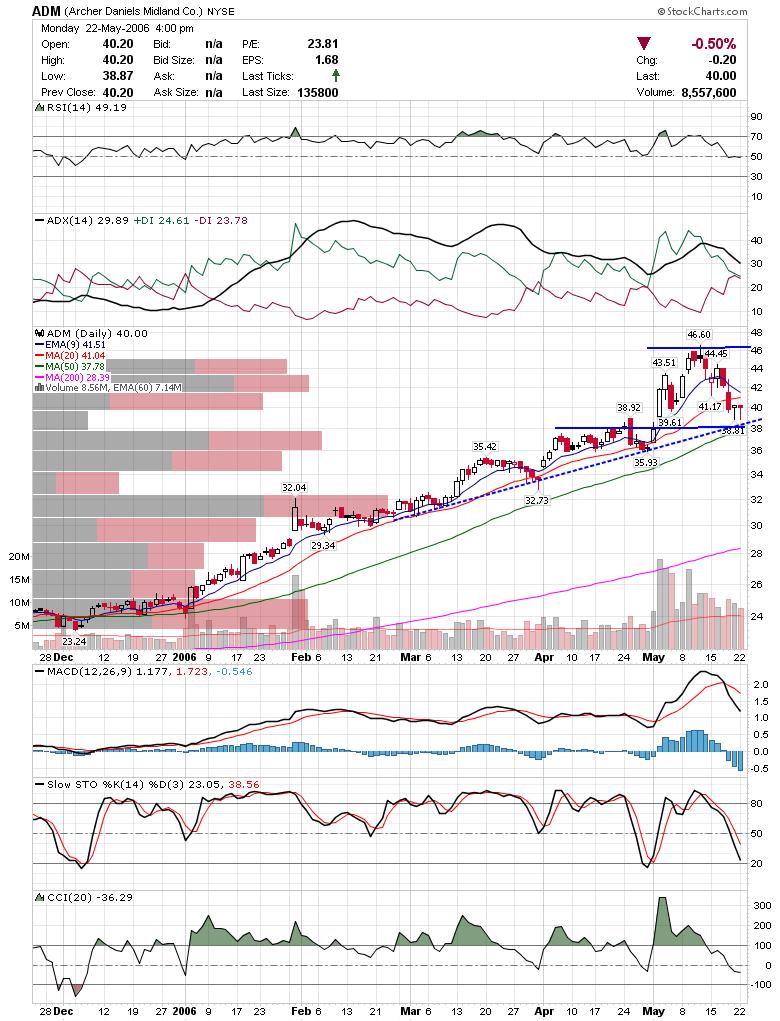
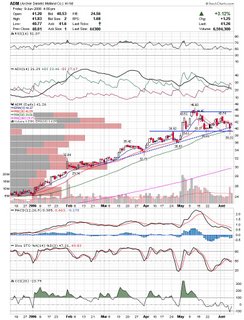
ADM is still holding the trendline and showing some indecision at falling lower.

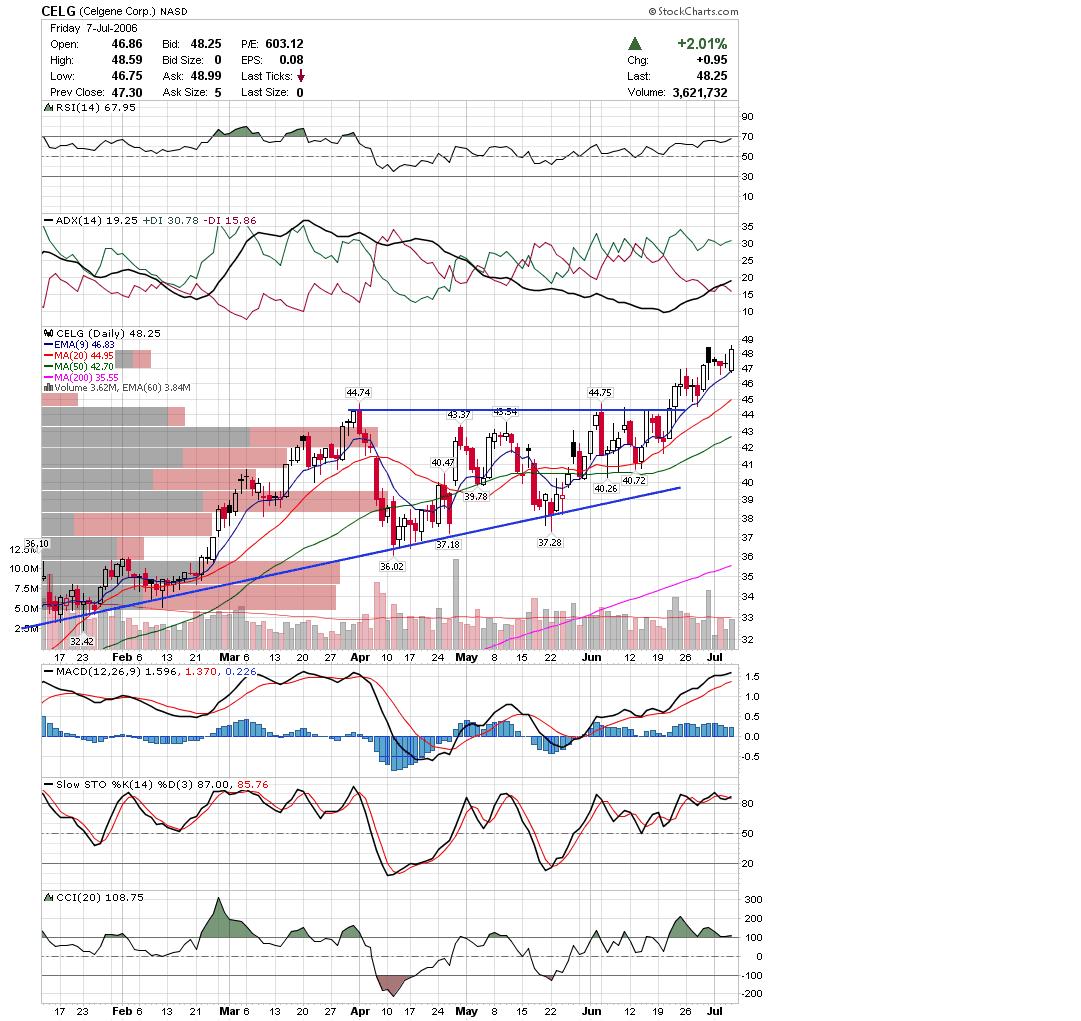
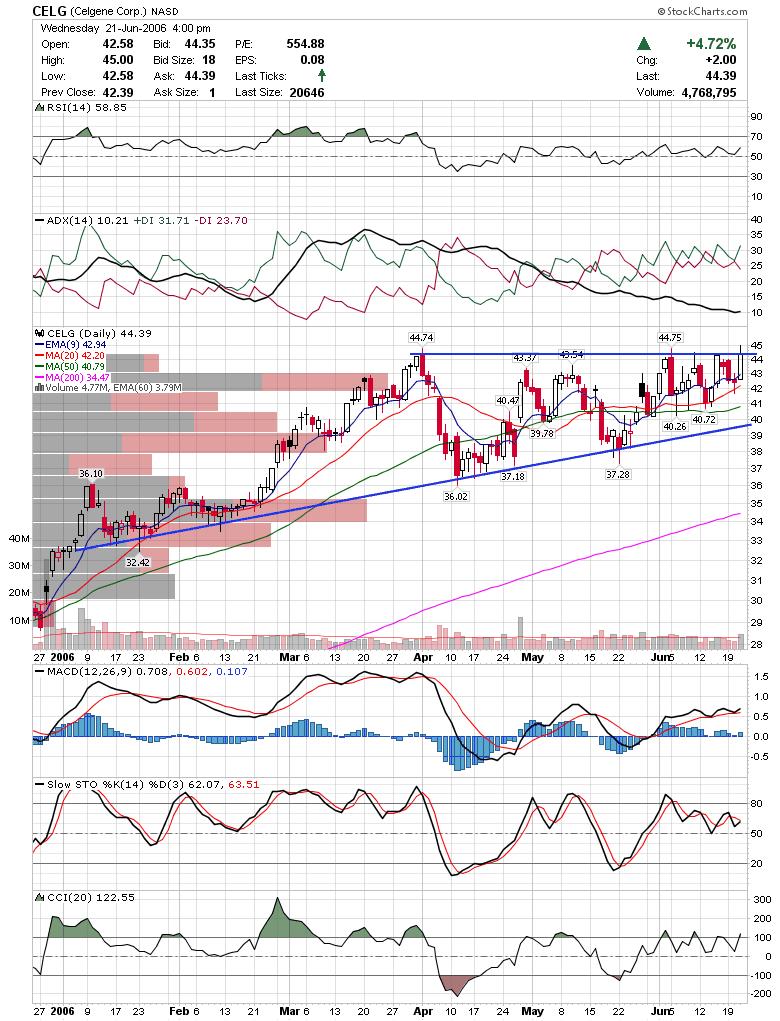
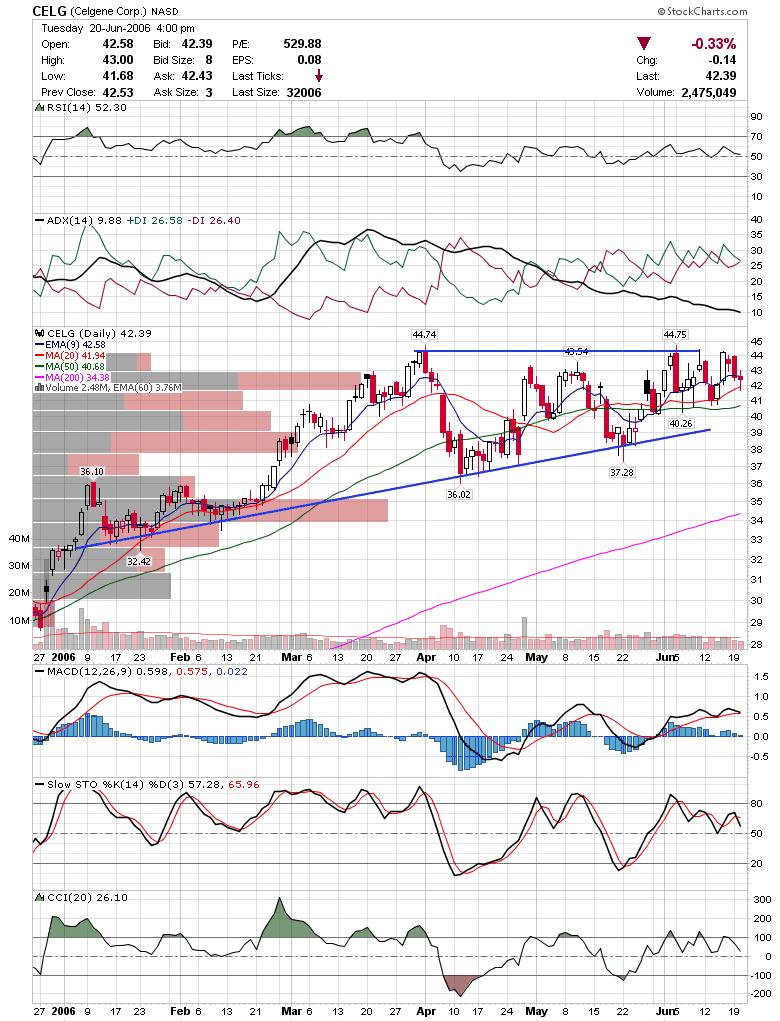
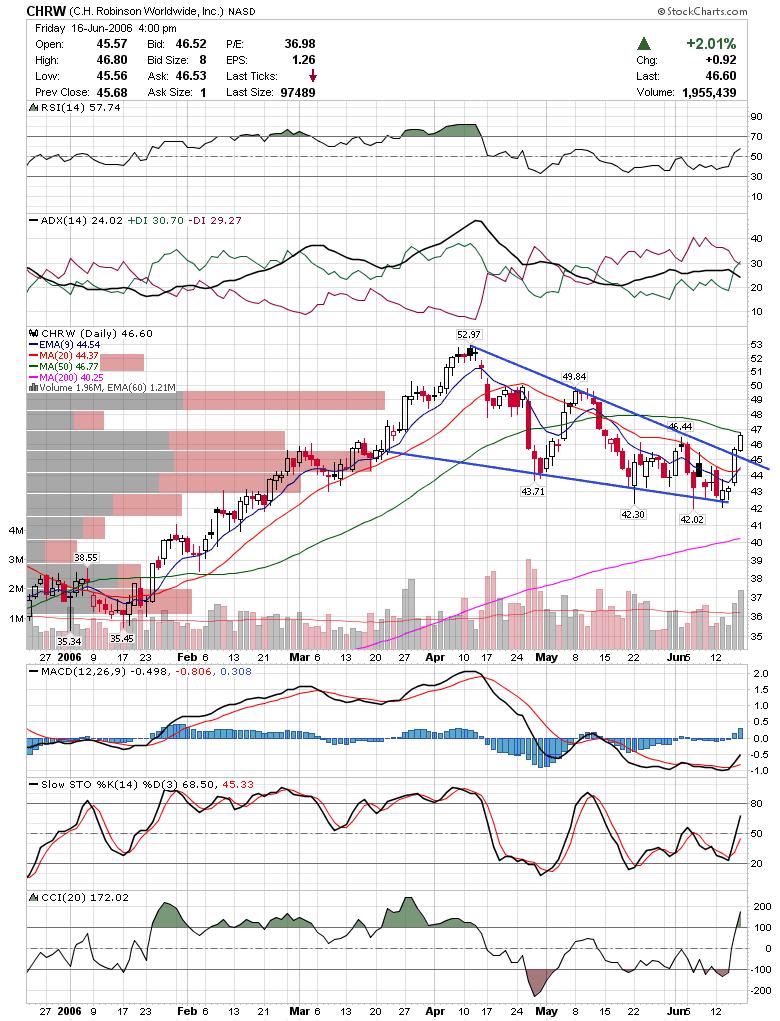
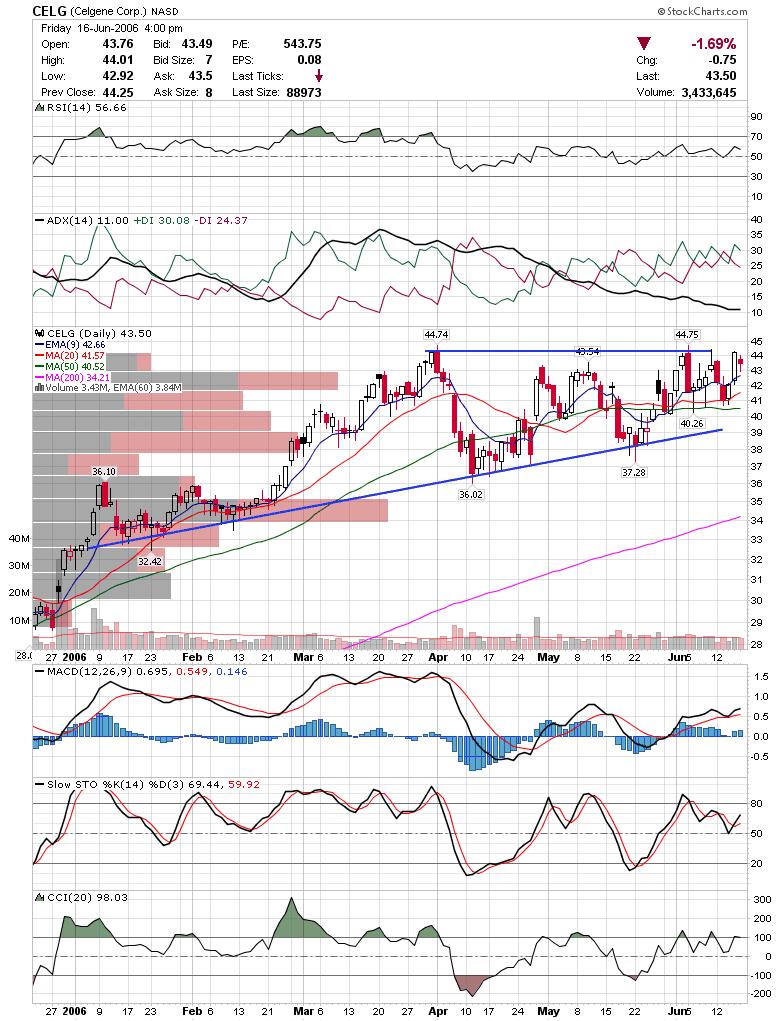
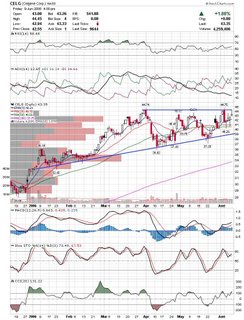
CELG has been consolidating and looks like it wants to test resistance.
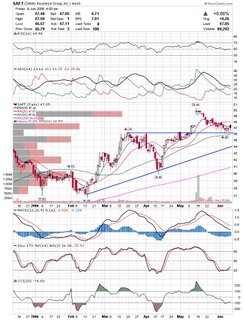
SAFT may be bouncing off a previous breakout point after failing to hold gap support.
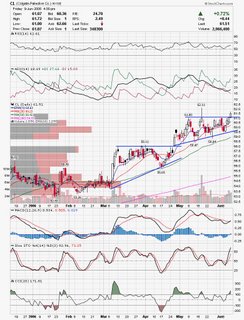
CL is a nice consumer staple stock that can be added to a portfolio for nice steady move higher.
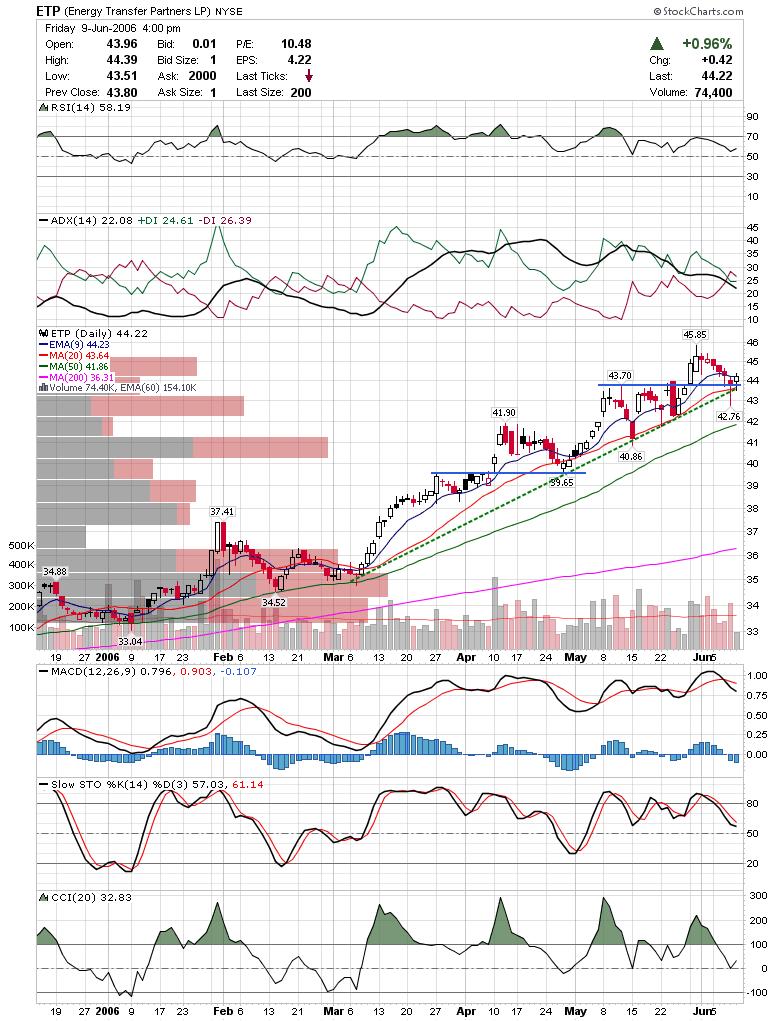
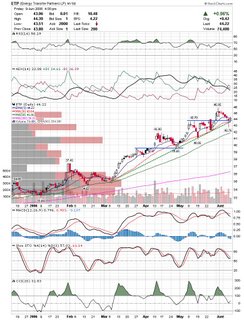
ETP has a nice trend going here and may be getting a bounce off the 20sma.
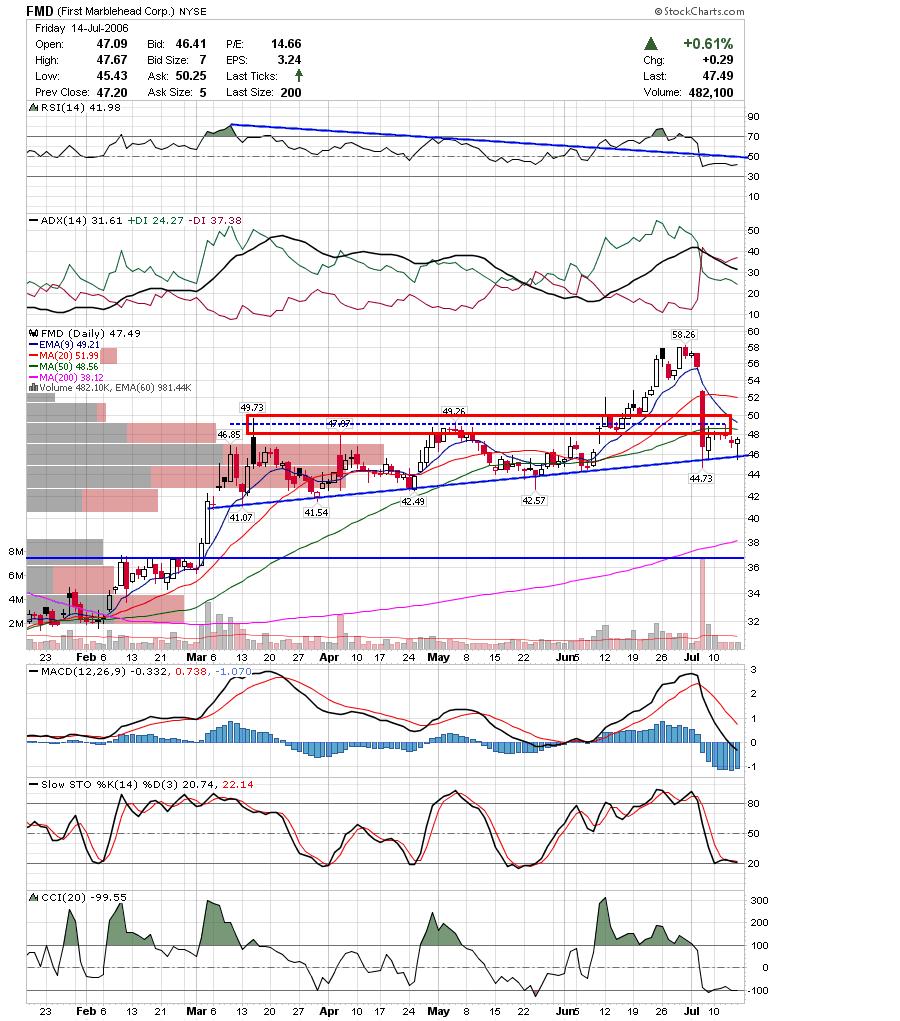
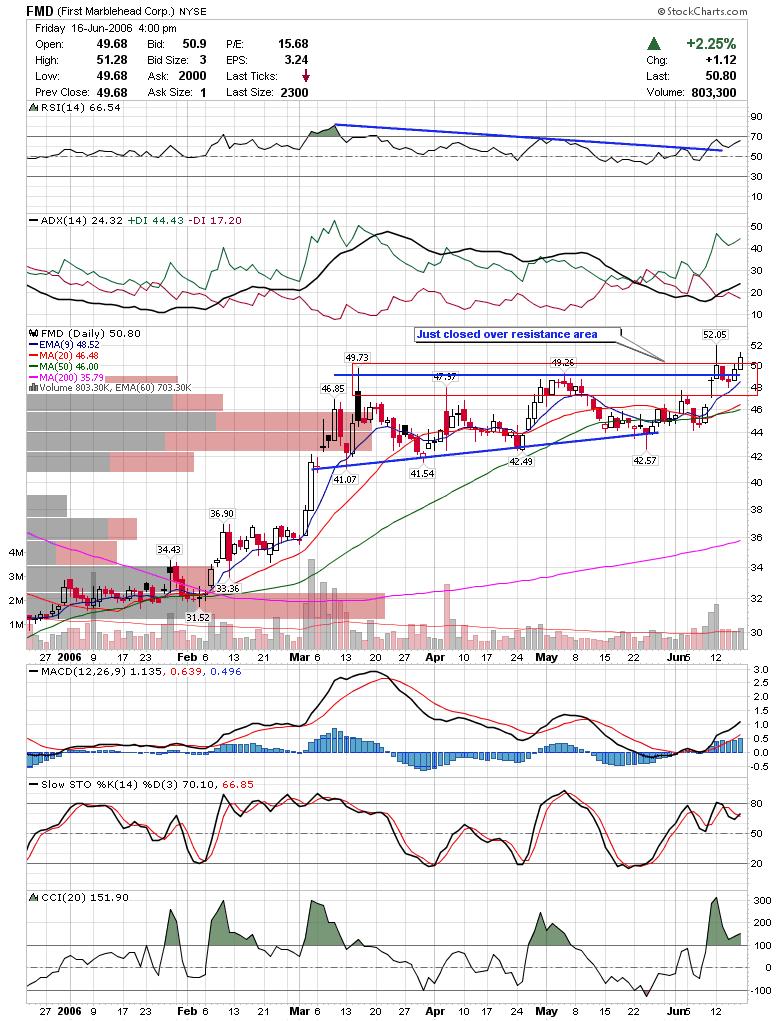
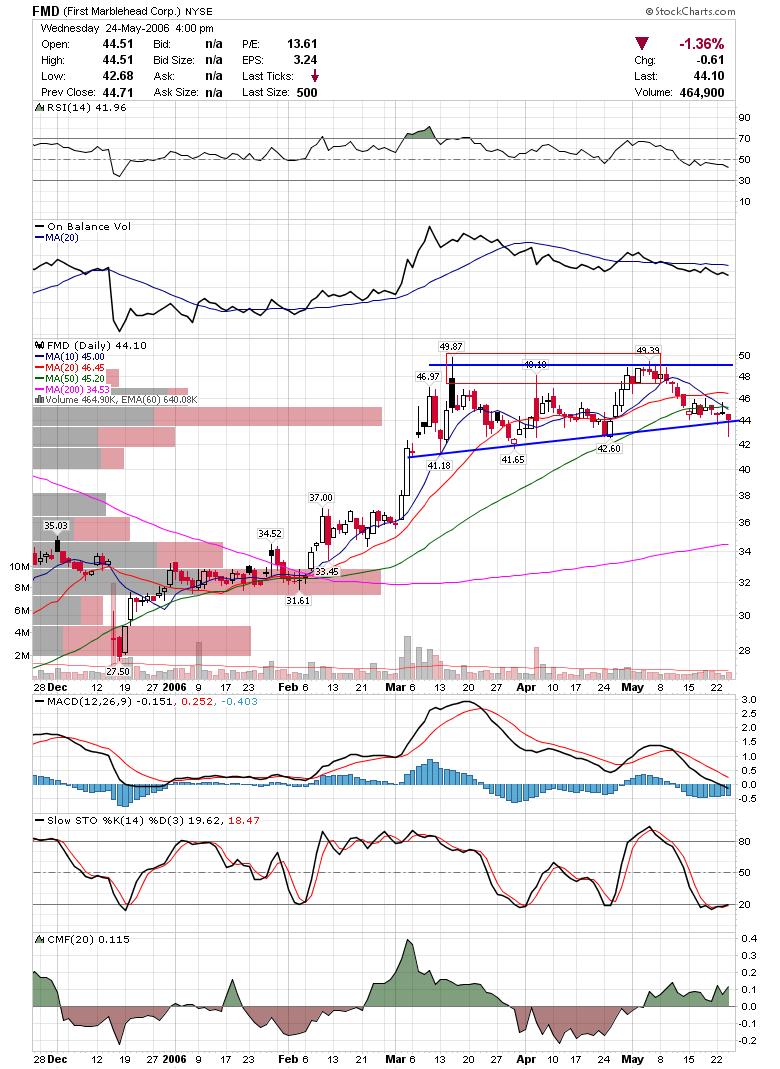
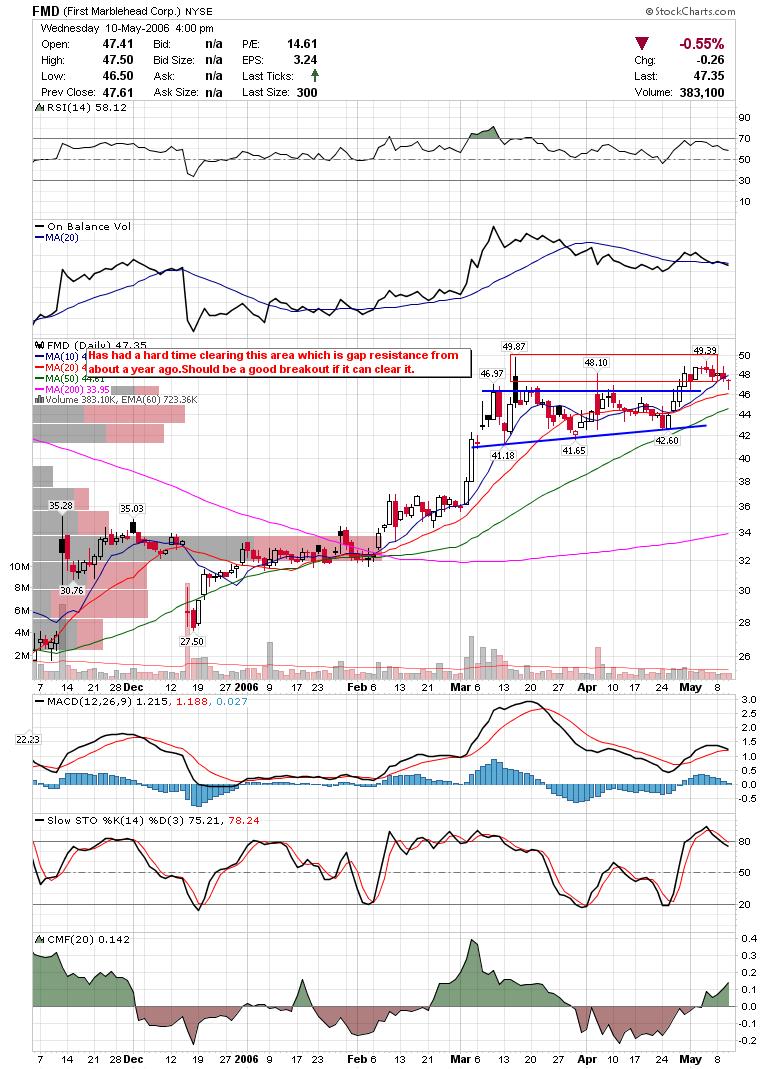
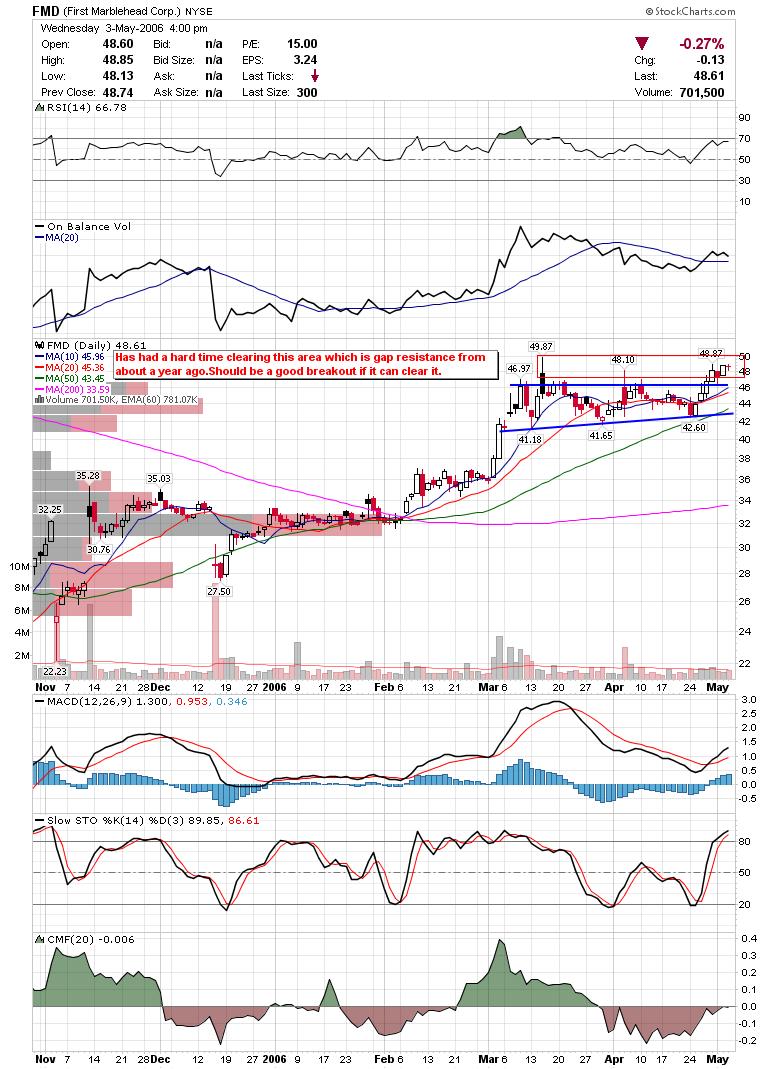
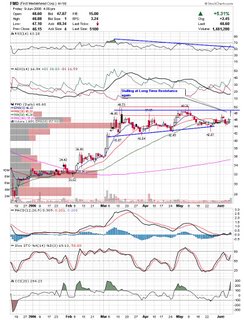
I mentioned a couple weeks ago that FMD looked like it would head to top of triangle and now that it is there it looks like it is struggling near long time resistance. If it gaps lower tomorrow it may be done.
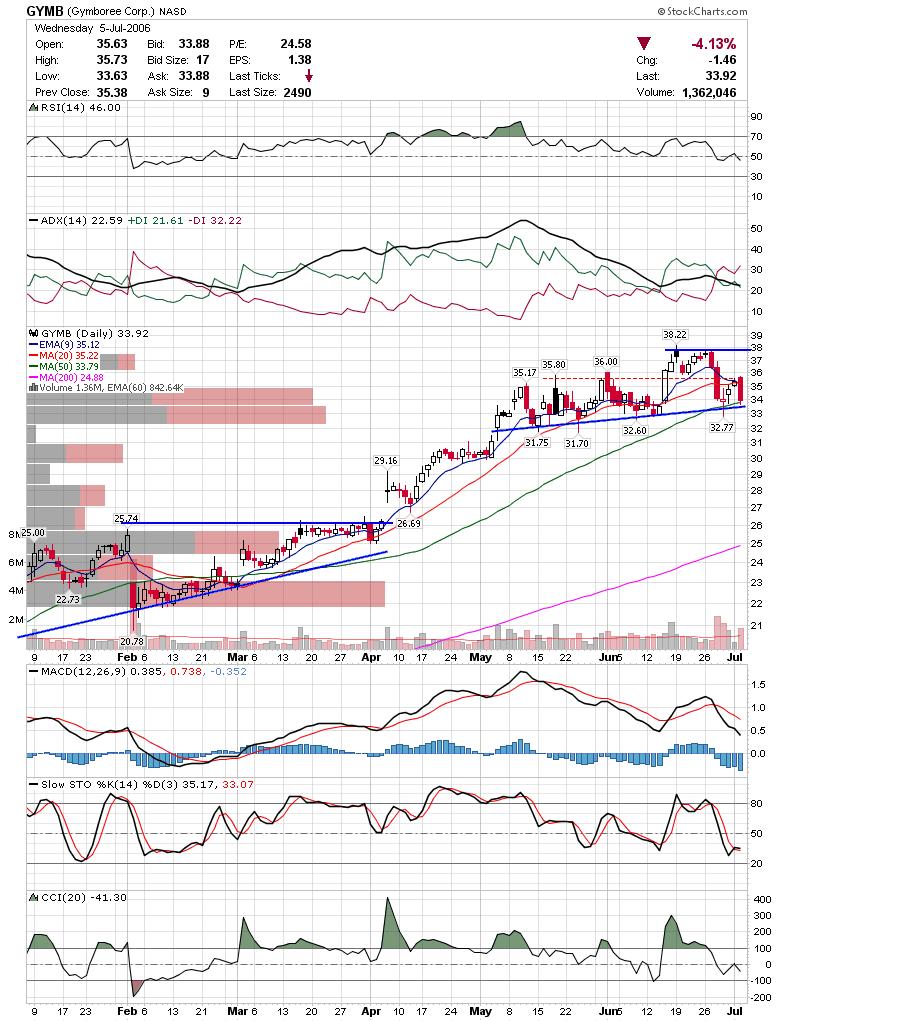
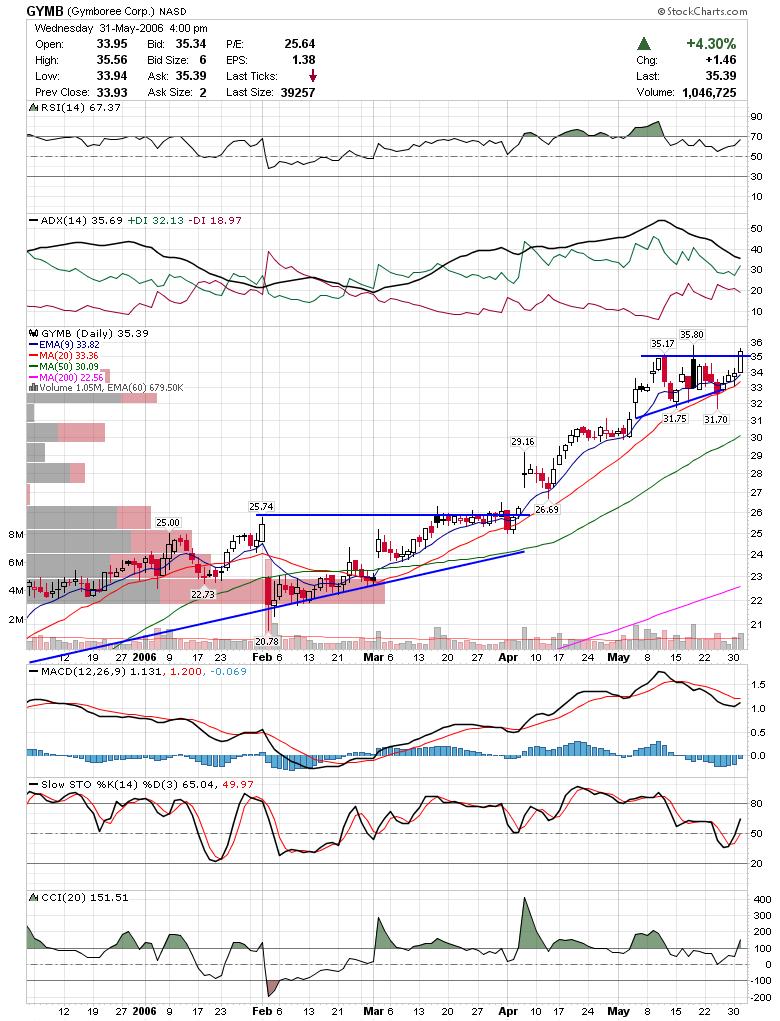
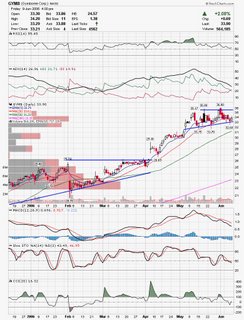
GYMB looks like it may be forming a second base here.
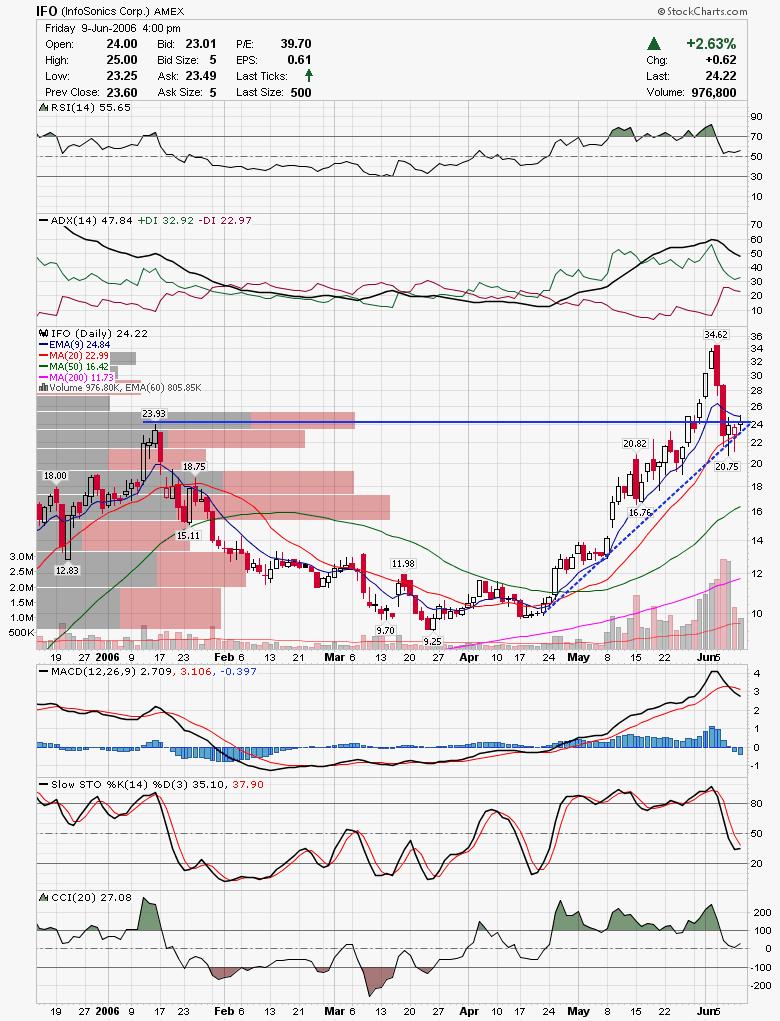
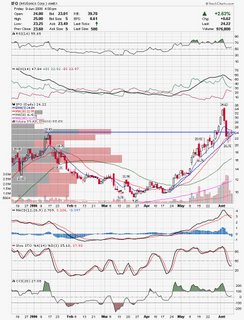
IFO has had a wild ride recently and may be forming a little bear flag here.
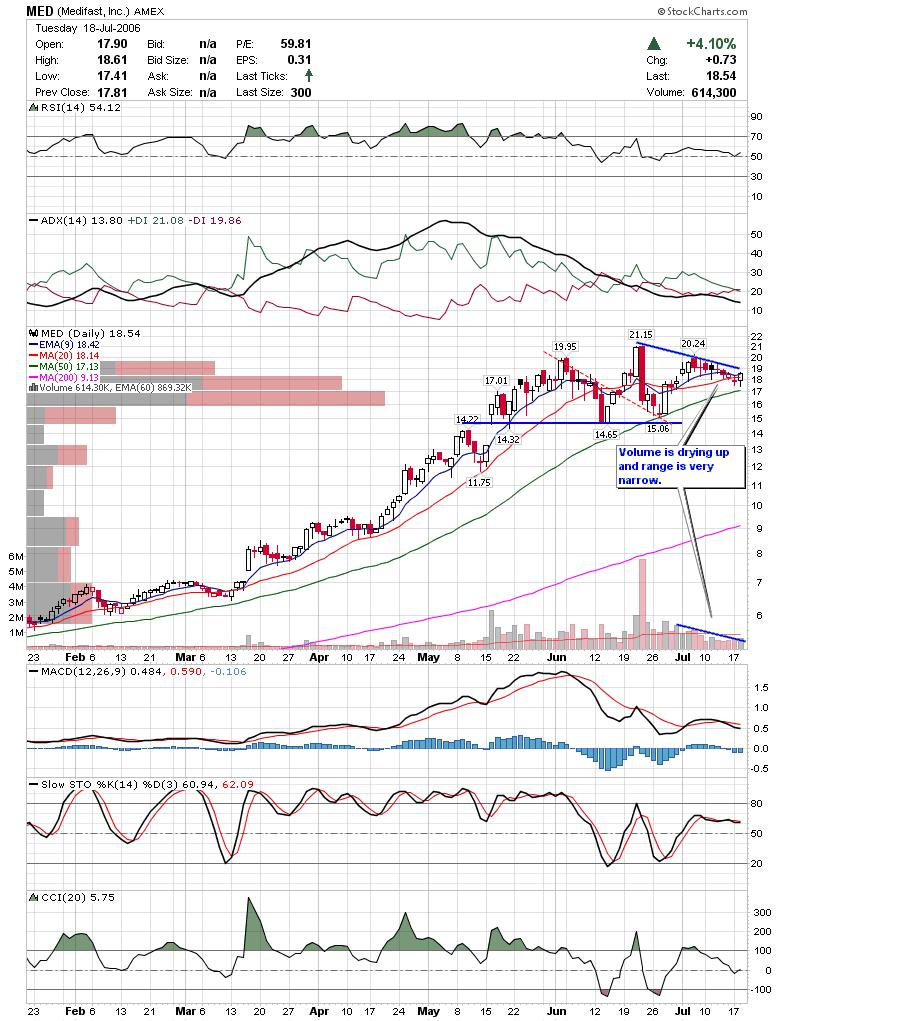
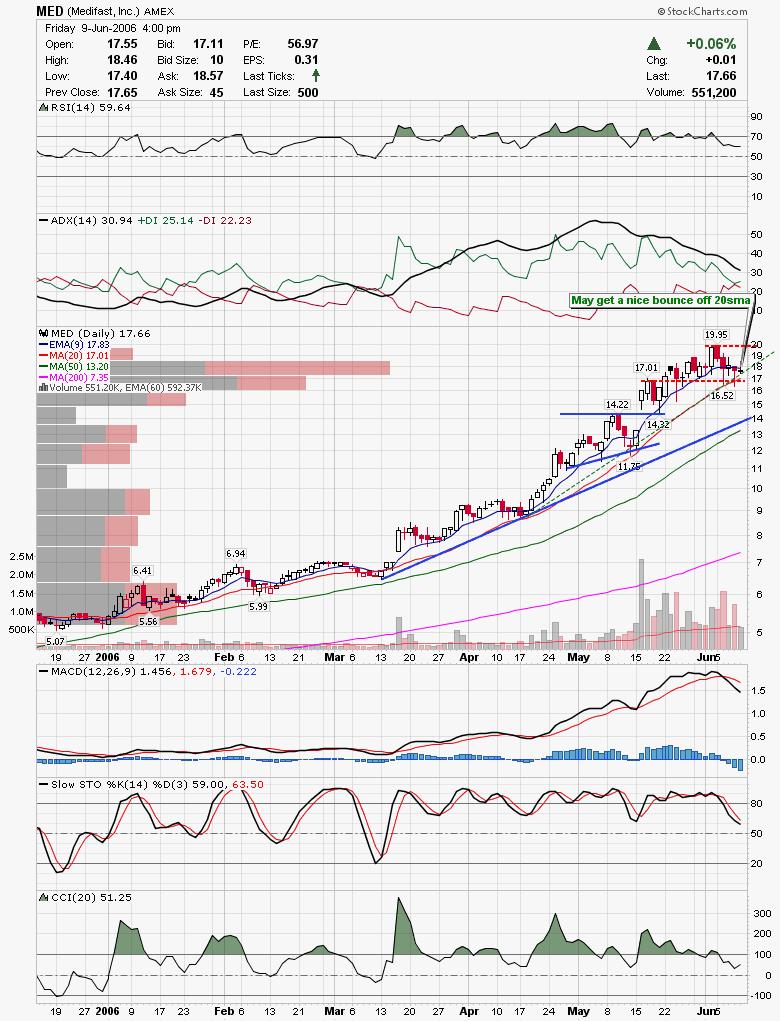
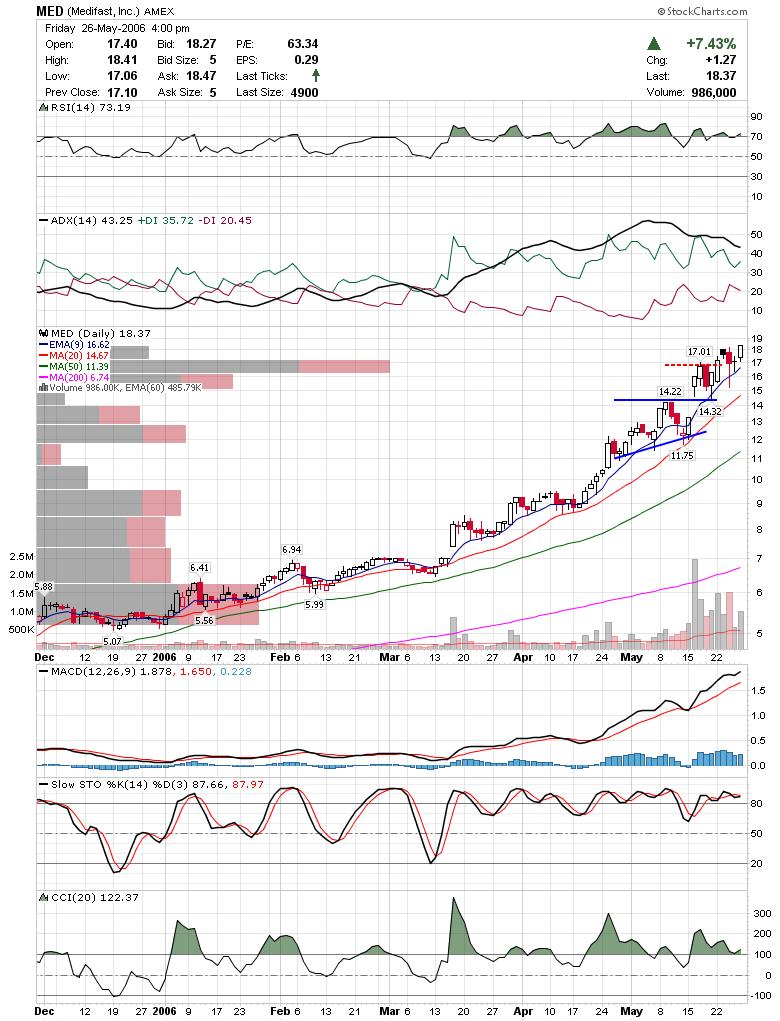
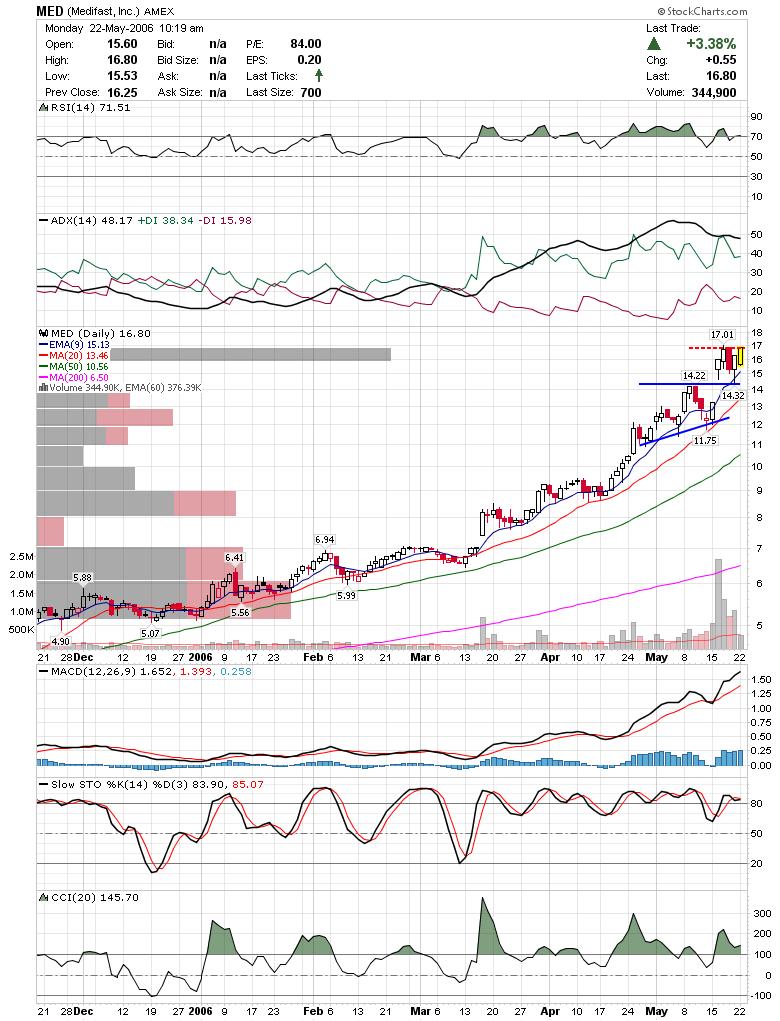
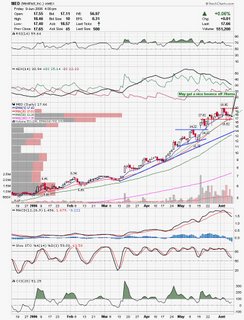
MED may get a nice bounce off the 20sma.
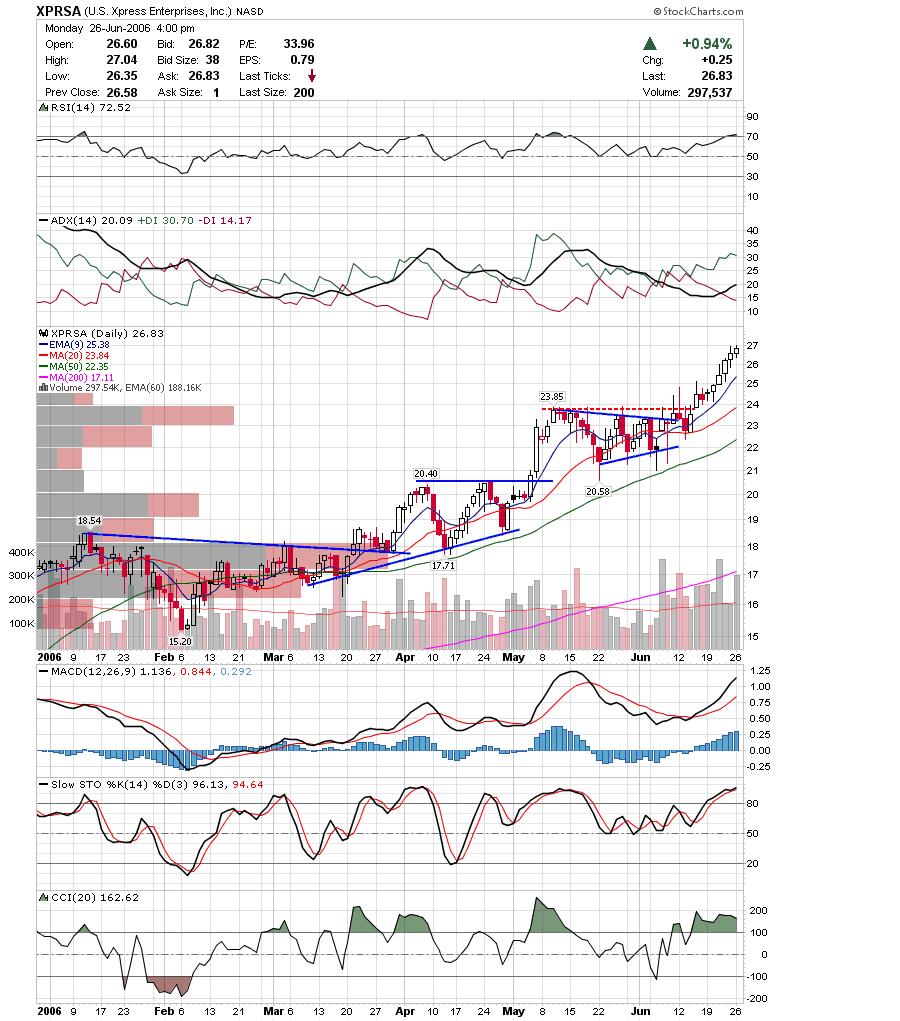
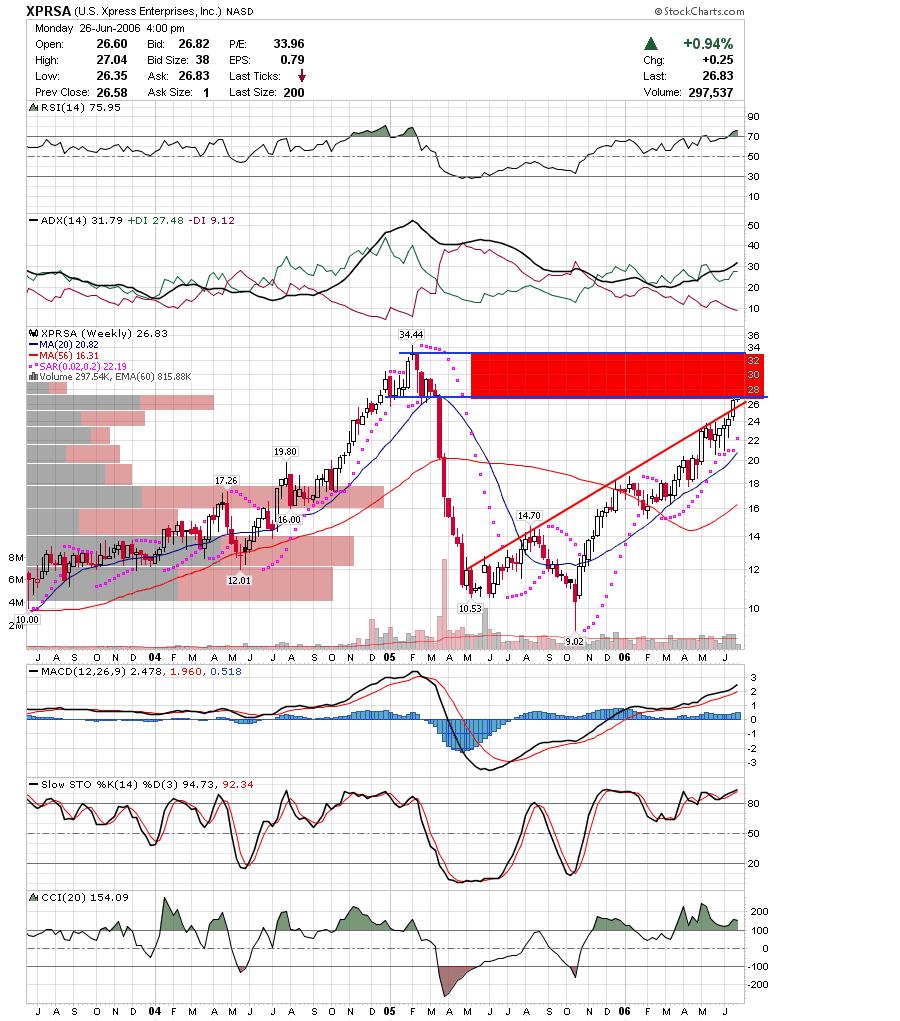
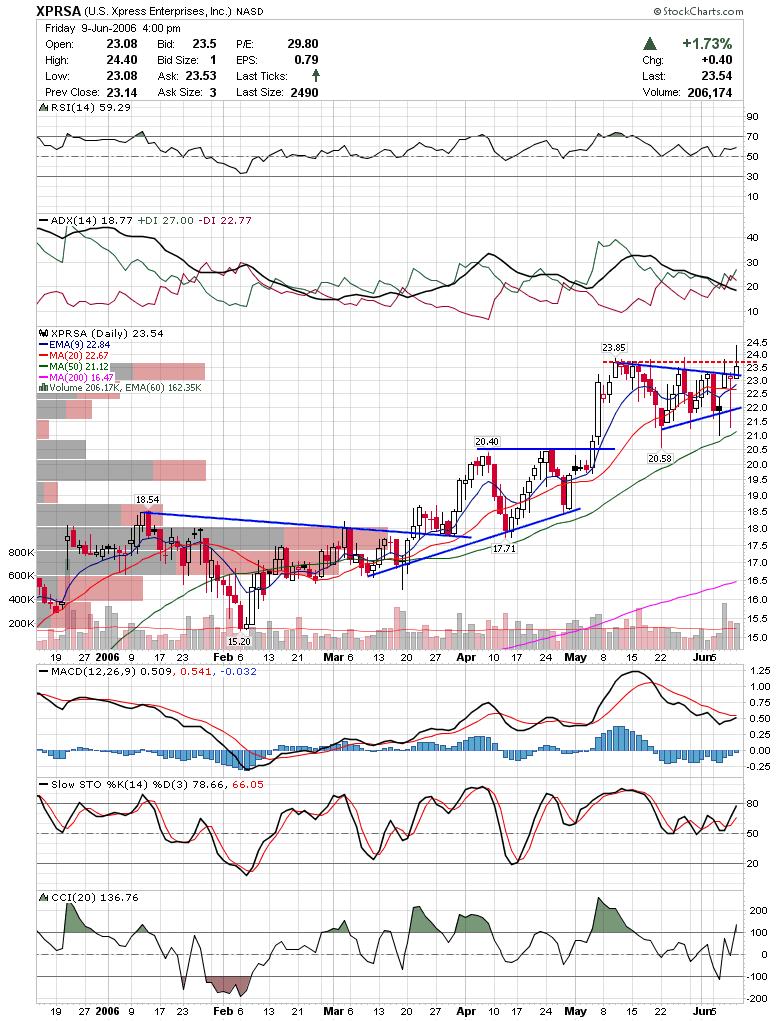
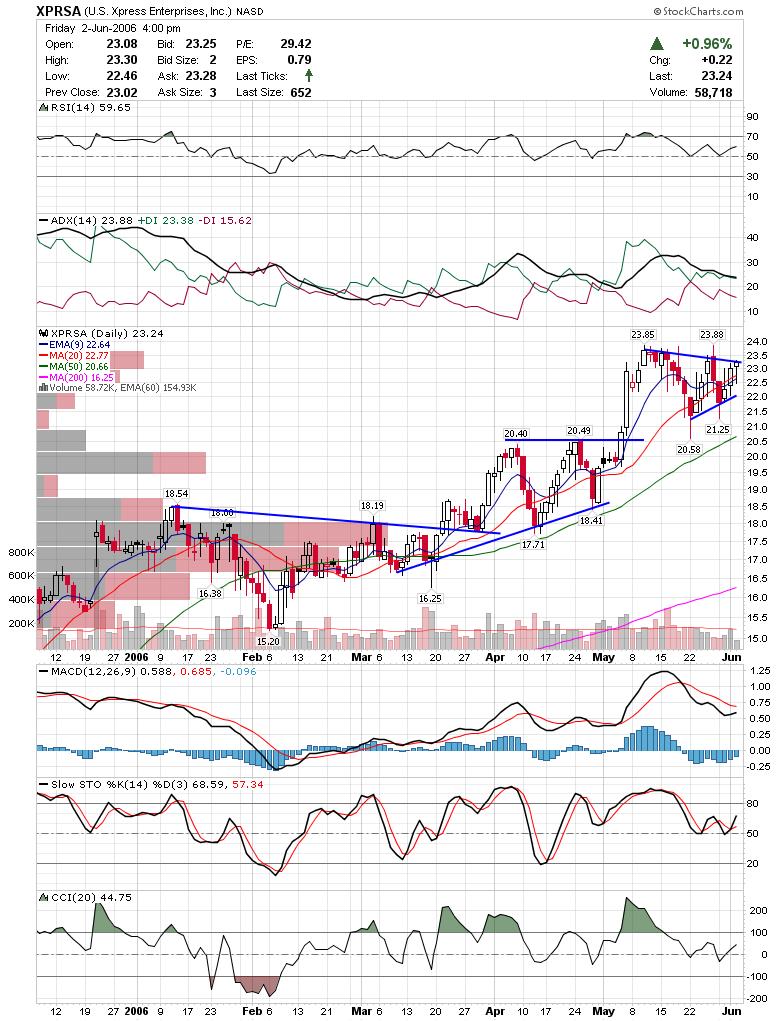
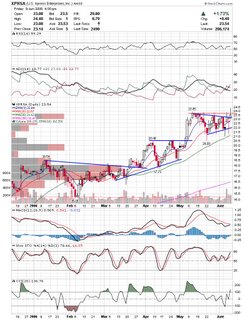
XPRSA may be breaking out of a triangle here.

I think Market participants are pretty confused right now so it's best to be overly cautious now. Good Luck,

DT
金币:
奖励:
热心:
注册时间:
2006-7-3

回复 使用道具 举报

 楼主| 发表于 2009-3-19 18:20 | 显示全部楼层
Capitulation Posted by downtowntrader | 6/08/2006 10:53:00 PM | 1 comments »

Trader Mike mentioned that it may look like an uneventful day to those who weren't watching the markets today, however, I was gone all day at Traders Expo and even I noticed it was a Wild day. I checked my quotes in the premarket and saw it was ugly it was downright brutal while I was sitting through a Forex class which was the same as the class ;). However, when I checked later that day I saw the S&P actually positive and most stocks well off their lows. I overheard lots of traders this morning talking about going short and talking about how the run was over, and this is what capitulation is all about. All the bulls cave in. So was this the bottom? I think we will know pretty soon, but it appears that it may be so.

On another note, I saw some intersting things at the convention today and I will be back Saturday. Most of the material was basic, but it was cool to meet the writers of some of the books I have read and loved. I will try to post a review on some of what I have seen over the weekend.

Good Luck tomorrow,

DT


No Update Tonight Posted by downtowntrader | 6/07/2006 10:42:00 PM | 0 comments »

There won't be an update tonight as I won't be trading tomorrow. I will be attending the Traders Expo in Ft. Lauderdale. If anyone is interested, you can view some of the seminars via a free webcast here.

The markets are once again threatening to break support and completely collapse. Trade carefully on both sides of the market or just stand aside until this works itself out.

Good Luck,

DT


ps.. Scott, I will post an SMSI chart later this week for you. The short story is that SMSI had a bullish breakout and looks healthy.


Starting to feel bullish Posted by downtowntrader | 6/07/2006 07:04:00 AM | 1 comments »

As I was driving home last night listening to CNBC i heard four analysts say they were either bearish or waiting for things to clear up and that started getting me feeling a little excited. Looking at the charts below I feel like there is a decent chance the bottom is in for now. I am short on time and I will try to add more commentary later this morning. Here are the charts for now.

UPDATED 8:45am

Take a look at the nasdaq composite chart below. The odds are pretty decent that we are establishing a double bottom. I am looking at candles to confirm support at a previous breakaway gap and near a long term trendline. Add some divirging indicators and the case for bullishness is getting more solid.

Here is the Russell chart showing possible candle confirmation on the previous morning star reversal. What I would be looking for here is another morning star to develop to confirm this area as solid support. Of course, there is a chance we take out these lows and a more bearish stance would be needed.
Here is a good example of how I use candles to confirm support. If you follow the internal trendline shown in the ADS chart by the dotted line, you will see that each time it touches the candle a soji or spinning top candle occurs, followed by a bullish confirmation. This tells me that as the stock is pulling back to the trendline, we get a battle of bulls and bears end undecided about support, followed by bulls overtaking bears the next day. Here we are again with a hammer/spinning top at a trendline. If we get a bullish candle today, I would expect ADS to challenge it's 52week high.
BIDU had a nice breakout yesterday and may be headed to an all time high.
IIP has been consolidatin the previous breakout and appears to be forming a very healthy base. It looks like it is headed to the top of the triangle next.
FE has been consolidating above long time resistance which should serve as good support for a new breakout.

Although I am feeling a bit more bullish, keep in mind that the bottoming out process can get very choppy, and there is no guarantee that we are even bottoming out here. In short, I am looking for the Nasdaq to lead here, and if it continues to lag, then the chance that everything falls apart is more likely.

Good Luck,

DT


Bam Posted by downtowntrader | 6/05/2006 10:11:00 PM | 0 comments »

Just like that the indices are back near their recent lows. Pay attention to the Nasdaq in particular as they are sitting on a long term trendline. It may get ugly if it breaks down tommorrow.

I am still looking at select longs in the case that this is simply a restest of support, but I am seeing some juicy shorts as well.

This is the first time I have seen this stock and the chart caught my eye. SABA attempted a breakout today but pulled back with the markets in the afternoon. I like the weekly chart as well showing them over long time resistance.LQDT was one of the stronger stocks today bouncing off support. Formed a nice bullish engulfing pattern today.
CKFR is a short that came up on my Trade-Ideas Short breakdown scan that I highlighted a few days ago here.They look like they may test 200sma.

I saw a lot of homebuilders on my short scan today as well. The homebuilders are pretty steeply oversold as a group, but they are showing signs of a possible downward accelaration. Here is KBH breaking a trendline.
MTH is also lookig very weak and is under lots of resistance.
MYOG is one I have been watching as it tested the uppoer trendline. This is a little different from the breakdowns shown above, as I am trying to pick a bounce off a trendline.

Thats it for tonight.

Good Luck,

DT


Be Prepared Posted by downtowntrader | 6/04/2006 10:17:00 PM | 0 comments »

The Nasdaq reversed after testing the 200 day sma and 38.2% Fibonacci retrace on Friday. The Nasdaq is vulnerable here considering it has been the weakest of the indices, however, if it can retake the 200 sma, some bulls may get excited and take it to the next Fib levels. The Nasdaq / SP500 ratio is at a pretty low level and the SP500 looks like it has more room to the downside so there is a chance the Nasdaq can retake leadership if we are gonna have a rebound. The key here is too not try and get too fancy trying to predict where things will go. Keep an eye on support and resistance, and have a plan for multiple scenarios. The best traders are prepared well in advance so that all they have to do is react to what is unfolding and not try to analyze a hundred indicators during trading hours.
Here is a chart of the Dow. Bulls need to be careful at how it works its way up here as it could be resolving into a Head and Shoulders topping pattern.
Here is the Russell and it may be setting up to be shorted. Here is a doji at a possible resistance area.
Gold is looking like it is trying to halt the declines here. However, it looks like it will need to consolidate for a while before any meaningful move begins. We are probably looking at a near term bounce and then some consolidation.
Silver is looking like it is finding a bottom here as well. It appears to me that Silver will regain the leadership from Gold on the next leg up.
While GG has retraced much of the prior breakout, no serious chart damage has occurred and it is retesting support here.
JOYG looks like it may be setting up for a drop here. Watch to see how it handles resistance here.
ADS was highlighted last week here and it is looking like it will test it previous high. Watch for a breakout.
BHI has been showing some strength and they cleared resistance Friday.
CSX looks like it will test the upper end of this trading range.
DXPE is waging a battle here with different news releases tugging on the stock. Watch for a clear break of this trading range.
IBCA is still looking decent here as long as it can hold it's breakout area.
ODFL looks like it is clearing a bull pennant here.
NSSC may be clearing a retracement channel. If it is successful it should head to the previous high.
TTI is possible breaking out of a triangle here and indicators are looking good.
XPRSA is a thinly traded stock that likes to trade in these triangle bases. Watch for a breakout here.

It's strange to see this many decent chart setups in the IBD stocks when the Russell Index is not looking as good. Either we will see a bunch of failed breakouts or the Russell will continue to bounce. Keep your stops tight and be prepared for both outcomes.

Good Luck,

DT
金币:
奖励:
热心:
注册时间:
2006-7-3

回复 使用道具 举报

 楼主| 发表于 2009-3-19 18:21 | 显示全部楼层
Capitulation Posted by downtowntrader | 6/08/2006 10:53:00 PM | 1 comments »

class which was the same as the class ;). However, when I checked later that day I saw the S&P actually positive and most stocks well off their lows. I overheard lots of traders this morning talking about going short and talking about how the run was over, and this is what capitulation is all about. All the bulls cave in. So was this the bottom? I think we will know pretty soon, but it appears that it may be so.

On another note, I saw some intersting things at the convention today and I will be back Saturday. Most of the material was basic, but it was cool to meet the writers of some of the books I have read and loved. I will try to post a review on some of what I have seen over the weekend.

Good Luck tomorrow,

DT


ps.. Scott, I will post an SMSI chart later this week for you. The short story is that SMSI had a bullish breakout and looks healthy.


Starting to feel bullish Posted by downtowntrader | 6/07/2006 07:04:00 AM | 1 comments »

As I was driving home last night listening to CNBC i heard four analysts say they were either bearish or waiting for things to clear up and that started getting me feeling a little excited. Looking at the charts below I feel like there is a decent chance the bottom is in for now. I am short on time and I will try to add more commentary later this morning. Here are the charts for now.

UPDATED 8:45am

Take a look at the nasdaq composite chart below. The odds are pretty decent that we are establishing a double bottom. I am looking at candles to confirm support at a previous breakaway gap and near a long term trendline. Add some divirging indicators and the case for bullishness is getting more solid.

Here is the Russell chart showing possible candle confirmation on the previous morning star reversal. What I would be looking for here is another morning star to develop to confirm this area as solid support. Of course, there is a chance we take out these lows and a more bearish stance would be needed.
Here is a good example of how I use candles to confirm support. If you follow the internal trendline shown in the ADS chart by the dotted line, you will see that each time it touches the candle a soji or spinning top candle occurs, followed by a bullish confirmation. This tells me that as the stock is pulling back to the trendline, we get a battle of bulls and bears end undecided about support, followed by bulls overtaking bears the next day. Here we are again with a hammer/spinning top at a trendline. If we get a bullish candle today, I would expect ADS to challenge it's 52week high.
BIDU had a nice breakout yesterday and may be headed to an all time high.
IIP has been consolidatin the previous breakout and appears to be forming a very healthy base. It looks like it is headed to the top of the triangle next.
FE has been consolidating above long time resistance which should serve as good support for a new breakout.

Although I am feeling a bit more bullish, keep in mind that the bottoming out process can get very choppy, and there is no guarantee that we are even bottoming out here. In short, I am looking for the Nasdaq to lead here, and if it continues to lag, then the chance that everything falls apart is more likely.

Good Luck,

DT


Bam Posted by downtowntrader | 6/05/2006 10:11:00 PM | 0 comments »

Just like that the indices are back near their recent lows. Pay attention to the Nasdaq in particular as they are sitting on a long term trendline. It may get ugly if it breaks down tommorrow.

I am still looking at select longs in the case that this is simply a restest of support, but I am seeing some juicy shorts as well.

This is the first time I have seen this stock and the chart caught my eye. SABA attempted a breakout today but pulled back with the markets in the afternoon. I like the weekly chart as well showing them over long time resistance.LQDT was one of the stronger stocks today bouncing off support. Formed a nice bullish engulfing pattern today.
CKFR is a short that came up on my Trade-Ideas Short breakdown scan that I highlighted a few days look like they may test 200sma.

I saw a lot of homebuilders on my short scan today as well. The homebuilders are pretty steeply oversold as a group, but they are showing signs of a possible downward accelaration. Here is KBH breaking a trendline.
MTH is also lookig very weak and is under lots of resistance.
MYOG is one I have been watching as it tested the uppoer trendline. This is a little different from the breakdowns shown above, as I am trying to pick a bounce off a trendline.

Thats it for tonight.

Good Luck,

DT


Be Prepared Posted by downtowntrader | 6/04/2006 10:17:00 PM | 0 comments »

The Nasdaq reversed after testing the 200 day sma and 38.2% Fibonacci retrace on Friday. The Nasdaq is vulnerable here considering it has been the weakest of the indices, however, if it can retake the 200 sma, some bulls may get excited and take it to the next Fib levels. The Nasdaq / SP500 ratio is at a pretty low level and the SP500 looks like it has more room to the downside so there is a chance the Nasdaq can retake leadership if we are gonna have a rebound. The key here is too not try and get too fancy trying to predict where things will go. Keep an eye on support and resistance, and have a plan for multiple scenarios. The best traders are prepared well in advance so that all they have to do is react to what is unfolding and not try to analyze a hundred indicators during trading hours.
Here is a chart of the Dow. Bulls need to be careful at how it works its way up here as it could be resolving into a Head and Shoulders topping pattern.
Here is the Russell and it may be setting up to be shorted. Here is a doji at a possible resistance area.
Gold is looking like it is trying to halt the declines here. However, it looks like it will need to consolidate for a while before any meaningful move begins. We are probably looking at a near term bounce and then some consolidation.
Silver is looking like it is finding a bottom here as well. It appears to me that Silver will regain the leadership from Gold on the next leg up.
While GG has retraced much of the prior breakout, no serious chart damage has occurred and it is retesting support here.
JOYG looks like it may be setting up for a drop here. Watch to see how it handles resistance here.
ADS was highlighted last week here and it is looking like it will test it previous high. Watch for a breakout.
BHI has been showing some strength and they cleared resistance Friday.
CSX looks like it will test the upper end of this trading range.
DXPE is waging a battle here with different news releases tugging on the stock. Watch for a clear break of this trading range.
IBCA is still looking decent here as long as it can hold it's breakout area.
ODFL looks like it is clearing a bull pennant here.
NSSC may be clearing a retracement channel. If it is successful it should head to the previous high.
TTI is possible breaking out of a triangle here and indicators are looking good.
XPRSA is a thinly traded stock that likes to trade in these triangle bases. Watch for a breakout here.

It's strange to see this many decent chart setups in the IBD stocks when the Russell Index is not looking as good. Either we will see a bunch of failed breakouts or the Russell will continue to bounce. Keep your stops tight and be prepared for both outcomes.

Good Luck,

DT
金币:
奖励:
热心:
注册时间:
2006-7-3

回复 使用道具 举报

 楼主| 发表于 2009-3-19 18:22 | 显示全部楼层
Solid Day Posted by downtowntrader | 6/01/2006 11:02:00 PM | 1 comments »

Although volume was lower it was nice to see the Nasdaq leading today. That is a clue that bears watching as the Nasdaq is the most oversold index and testing the lower end of a long term channel. We'll see what transpires tomorrow after the jobs report, and whether volume picks up.

BOOM was mentioned on Madmoney today and may be highlighted on tomorrow's show depending on whether viewers select them as the "orphan" stock. Looks strange when I type it, but you can read the details here.
I saw some strength in Internet related stocks today and the following three stocks have potential for outsized gains.

TZOO has started to turn back up and if they can gain some momentum the huge short position could be squeezed.
BIDU will have a nice move if it can clear obvious resistance.
PCLN held up as the market pulled back and look like they are starting to pick up steam.

Keep in mind that the markets are still pretty skittish so it's not time to be fully margined long, however, it is looking like there will be a little more upside here.

Good Luck,

DT


Charts of some IBD 100 stocks Posted by downtowntrader | 5/31/2006 11:20:00 PM | 0 comments »

Small Caps are starting to firm up a little and if we are forming a near term bottom then IBD stocks may be a good place to be. With that in mind here are a few charts of IBD100 stocks that are near decent risk reward buy points.

ANDE actually looks more like a short if it can't break the internal trendline here, but if it can clear it then it should test the recent high.

CLB may be hammering out a bottom here.
DXPE is looking ready to move higher. Wait for the move out of the pennant.
EXPD continues to hold gap support.
LIFC cleared the pennant and is backing up to retest support.
DRIV may be done here. I am stopping short of calling it toast because it held the red trendline which should serve as support. However, the price action is pretty bearish.
GYMB is breaking out of a base here, but may not of consolidated enough for the breakout to hold.
SAFT has worked it's way back to it's breakout area and may find support here.
TNB pulled back to a major trendline and looks like it found support there.
Also I had problems with my VCBI chart, but check it out here.


Good Luck,

DT


Rally Dead? Posted by downtowntrader | 5/30/2006 09:53:00 PM | 0 comments »

Today was a pretty negative day with no signs of any hope for Bulls. There was no news to spark the sell off no matter how the media spins it. So the indices are quickly back in a precarious situation appearing like they will test recent lows. This is why it is dangerous to try and pick bottoms as there are all type of shakeouts and weakness as trapped longs and eager shorts wage their battles. Looking at the indices there are still signs of a possible bottom and I wouldn't be surprised with a gap down and capitulation as early as tomorrow. I also won't rule out a complete breakdown however, especially with all the bearish engulfing candles today.

Here is an updated $COMPQ chart showing it at a major trendline. The Nasdaq is about as weak as it has been in over a year. Will it try and reclaim leadership, or is this the beginning of serious problems.
Here is the $SPX daily chart. It still has plenty of room to hit the bottom of the channel, but I wasn't expecting a touch of the channel till it cleared 1245ish. We'll see how it resolves.
I've mentioned how I have a custom scan setup in trade ideas for stocks breaking down. Here is a Candleglance of a few that turned up today.

10 Possible Shorts

I set up this scan to look for stocks making a new 8 day low, but paying special attention to where in the yearly range the stock was. This scan looks for stocks that have already topped vs trying to pick out the tops themselves.

I am posting a link below with the precise setting I have been using. It will only work for suscribers, so if you have suscribed recently, feel free to test it out. I would appreciate some feedback from those who try it out.

To test it out, Right click the link below and select copy link location. Then right click on an open Trade-Ideas window and select collaborate. Then paste the link into the collaborate field.

Link

Click OK, and you're done.

While I think shorting here may be dangerous, those thinking about using this scan can start monitoring since we are seeing a lot of weakness even on up days.

Good Luck,

DT
金币:
奖励:
热心:
注册时间:
2006-7-3

回复 使用道具 举报

 楼主| 发表于 2009-3-19 18:22 | 显示全部楼层
Charts Posted by downtowntrader | 5/29/2006 09:29:00 PM | 0 comments »

It is still too early to tell how much of a bounce we will get in the indices, but it definitely looks like "bounce" is the most we will get. If this was the first leg of a correction, then the next leg should provide some nice shorts. There are still some long plays worth considering for short term traders though since the indices are just climbing out of oversold levels. The ideal situation would have the indices attempting a rally over the next week or so, and then rolling over. However, I think most people are expecting this type of scenario and the markets have a way of punishing the herd.

Here are a few interesting charts.

BLK looks like it will continue to correct. The question is does it hit the upper trendline or does it fail here at the twenty day moving average.


CLB may be getting support at the fifty SMA and trendline.

MED has been showing strength and made a new 52 week high Friday.
GDI looks like it will make a run at the upper trendline near 82.
HITT pulled back to double support at the previous breakout area and the ascending trendline. They had a nice move Friday confirming support.
IBCA made a push to the top of an ascending triangle and pulled back a little. They still look like they cleared the line though. While there is still some resistance to contend with, most indicators are confirming this move.
BUD is one of the short plays that came up on a trade ideas scan I was messing around with. While BUD actually looks like it will be a pretty good performer in the intermediate term, it looks like it is headed lower in the short term. Here is a chart of BUD breaking flag support and possible support areas below.
Here is the weekly chart showing some pretty stiff resistance at 47. Notice the long wicks on the previous three weekly candles.
STLD has more resistance above then support below. I am watching to see if it breaks lower here or if it will attempt to make a push to the upper dotted red trendline.
MNST is one I am watching to see if it makes it up to previous support in the coming days. The idea is to wait for it to breakdown near resistance.
LNCR made a new 52 week low Friday and looks like it may really break down here. This also looks good on a weekly chart showing the last few years.

Good Luck,


DT


Nice bounce today Posted by downtowntrader | 5/25/2006 10:45:00 PM | 1 comments »

The major indices got bounces today as expected. Tomorrow will be interesting as lot's of people will be taking the day off ahead of the extended weekend. While a reversal has been in the cards, there has been a lot of chart damage done to all the indices and many stocks. The weekly charts of most of the indices are on sell signals from multiple indicators.

Here is the weekly SP500 chart. It is holding up at the 50% fibonacci retrace which is positive, but parabolic sars is on a sell signal. It is looking like it will retrace up before turning back down.
Russell 2000 index printed a morning star reversal pattern today. Lots of damage here, but it looks like it will move a little higher.
Here is an updated chart of EMCI clearing the downtrend channel.
PCLN is looking pretty good breaking out of a bull flag pattern.
LIFC looks like it found support at the breakaway gap. Watch to see if it can clear the pennant pattern.
OII is another bull flag pattern in the works. Looks like it just cleared it today.
PLXS has been pulling back steadily into support. Finally got some buying today and may be ready to retrace some of the pullback.
PAY is clearing resistance here and may head to top of channel.
NTRI may be getting gap support here as well. They still have some resistance to work through but the risk reward is decent here.

Thats it for tonight. Keep in mind that the indices are trying to hammer out a near term bottom and could give back any gains fairly quickly.

Good Luck,

DT


Newer Posts Older Posts Home
金币:
奖励:
热心:
注册时间:
2006-7-3

回复 使用道具 举报

 楼主| 发表于 2009-3-19 18:23 | 显示全部楼层
More hammers and tails Posted by downtowntrader | 5/24/2006 09:39:00 PM | 2 comments »

I had to leave early again today to attend a graduation, so I didn't see the markets finish. I do know that when I left things looked pretty bleak and when I got back tonight things were off their lows. It's hard to say what will happen, but I found it interesting that we had a high volume day today where normally volume would be muted. The fact that we closed stronger may be a hint that a near term bottom is in place, with the key word being near. Here are a few interesting charts I found.

TRN has some long tails here into support.

TGE looks like it may hold the trendline after breaking initial support.
OMC has shown some relative strength refusing to go down as the markets have tanked. Although todays move was not huge, it did make a new 52 week high on strong volume.
I meant to post LUK last night but somehow I missed uploading the chart. Either way, they look decent especially if they can clear yesterday's high.
PANL fell out of the near term channel but looks like it may bounce here at a previous breakout point.
SAFT closed it's gap and finished near the high of day. If I was short I would be nervous about it failing to breakdown.
RBC looks similar to some of the charts I have been seeing lately pulling back to it's previous breakout area.

FTC is another one pulling back to a breakout, although technically the breakout area was before the gap up.


I've been watching FMD tread along this triangle for a few weeks now. This looks like a decent area for early birds not wanting to wait for the triangle break.


Thats it for tonight.
Good Luck,

DT


Bird Flu back in news Posted by downtowntrader | 5/23/2006 10:11:00 PM | 0 comments »

The markets pulled back sharply in the last hour as news of a possible human to human bird flu strain took front stage. While sometimes news is used as the scapegoat for price action, I think this time the markets were rattled by this development. Bird Flu stocks such as NVAX and BCRX were trading higher as well. I was a little surprised to see gold pull back as it is usually a safe haven in troubling times but the dollar strengthened as the news came out. As the dollar strengthens, commodities weaken. Here is a link saying as such.

Here are a few charts that held up well today after the pullback.

ADS was highlighted here last night and the held most of their gains today.
JLL took out the descending trendline on big volume. Watch for a follow through.
XTXI cleared a choppy flag type consolidation and managed to close above all the noise.

Watch to see how tomorrow closes. It is much more important then how it opens. The markets have a funny way of absorbing overeaction to news and working it's way back to where it was originally. Think about the famous Bartiromo / Bernake comments. The market sold off and ended up right back where it started a day later. I will be watching to see if the markets follow through on the selloff or if they rebound again.

Good Luck,

DT


AH action Posted by downtowntrader | 5/23/2006 04:52:00 PM | 2 comments »

Not sure whats going on yet, but futures are falling after hours. Also, birdflu stuff is up pretty sharply. I will post more when I know something.


DT


Missing Charts Posted by downtowntrader | 5/23/2006 09:21:00 AM | 0 comments »

Missing charts from last nights post.


Gold Bounce
金币:
奖励:
热心:
注册时间:
2006-7-3

回复 使用道具 举报

 楼主| 发表于 2009-3-19 18:24 | 显示全部楼层
A few charts Posted by downtowntrader | 5/22/2006 11:09:00 AM | 3 comments »

Here are a few interesting charts

Watch ANDE in this area as it is in danger of falling apart.MED is one of the few stocks looking to go higher lately.
HOC broke minor support and is testing major support. Watch to see how it breaks here.
HUBG looks like it may be in trouble.
I'll post a more thorough update tonight.

DT


Update in the morning Posted by downtowntrader | 5/21/2006 10:52:00 PM | 0 comments »

I won't be home till later tonight, so I will post an update tomorrow morning. Keep an eye on gold and silver as I think we may get a little bounce this week. Good luck,

DT


BOOM Bottom? Posted by downtowntrader | 5/19/2006 02:31:00 PM | 0 comments »

BOOM may be bottoming out here on climactic volume. While the volume spike is not huge, the day is not over yet. BOOM touched a penny below the top of the December breakaway gap and the gap may serve as support. I couldn't help but pick up a few shares there.


Options Expiration Posted by downtowntrader | 5/18/2006 06:44:00 PM | 0 comments »

I will be taking tomorrow off as it is options expiration day. A couple of things though to keep in mind. AMD and DELL finally combined forces and AMD was trading sharply higher in the AH session. Also, DELL was trading higher on earnings and the AMD news. MRVL also reported earnings that were well recieved. It should be interesting to see how options expiration affects these stocks in particular. Looks like Semi's may finally get a bounce. Only one chart tonight.

FLSH looks like it is getting ready to break a pennant formation and test upper resistance. Also, some semis such as SMDI and TRID looked decent.


Good Luck,

DT


More Selling today Posted by downtowntrader | 5/17/2006 10:01:00 PM | 0 comments »

The selling continued today and every move up was rebuffed. The Nasdaq looked like it would bounce after a strong move down mid morning, but eventually it ended near the lows for the day. I have been expecting a bounce but it seems that everywhere I read people are expecting the same. While it seems likely that the near term bottom may be in, the market has a way of fooling the majority.

Here is an updated Nasdaq chart. I am showing the weekly chart to show the longer term lower trendline.

Here is the weekly SP500 chart. The $tick dropped to under -1000 today at one point and you could sense extreme fear with the down move. It looks like the SP500 may be headed to the lower trendline over the next couple of months.

Here is a chart of Oil. Looks like it may get a bounce here as it is finding converging support.

Here is an updated chart of DRIV. If Nasdaq bounces tomorrow then DRIV should break to a new 52 week high.

SLW has corrected pretty sharply along with silver. Here is a weekly chart showing a trendline in place since the IPO. Each visit to this trendline has been rewarded handsomely.

CTXS has been observing support and had an inside day signaling further consolidation.

Good Luck trading tomorrow and observe your stops.

DT


Another sideline day Posted by downtowntrader | 5/16/2006 10:12:00 PM | 0 comments »

Today was another day best served by sitting out. Markets are oversold, but I'm not seeing too many charts that I like.

Here is a chart showing the SP500 breaking a minor trendline. We still have plenty of room to the downside here if weakness builds up.

GOL remains well positioned here mainting above the previous breakout.
FWLT looks like it may take back the trendline as support.
ASFI pulled back to test the gap as support and looks like it is holding it.


I was having a hard time finding decent looking charts for my trading style tonight, so I figure that if I have to look to hard something is not right. I will watch the few charts that I have turned up the past few days and take trade ideas setups for now. Trade ideas has given me a few decent shorts lately including aapl today.
Good Luck,

DT
金币:
奖励:
热心:
注册时间:
2006-7-3

回复 使用道具 举报

 楼主| 发表于 2009-3-19 18:25 | 显示全部楼层
Start of a bounce? Posted by downtowntrader | 5/15/2006 09:43:00 PM | 2 comments »

Looks like we started to get a technical bounce after more weakness today. In reviewing charts tonight, I am seeing a ton of damaged charts. By damaged, I mean stocks that have made lower pivot points after double tops, failed breakouts, etc. It looks like a lot of people will be selling this rally, and with all the lower lows, there may be some good shorts coming up.

Here are updated weekly charts offering a better perspective on some of the indices.

Here is the Russell which actually has held above the previous channel.

The SP500 rode the upper trendline for several weeks, but CCI, Slow Stochastics, and MACD are all on short term sell signals.
DRIV has held above the red lines I have as previous resistance. If it clears this triangle, it could be a great move.
ICE has also held above the triangle breakout without too much chart damage.
TWGP looks like it may challenge recent highs.
OMC didn't pull back with the indices the past couple days and made a new 52 week high today.

Thats all for tonight.

Good Luck,

DT


Tricky Markets Posted by downtowntrader | 5/14/2006 11:15:00 PM | 0 comments »

This is a tricky spot to trade as the markets are clearly showing weakness, but are very oversold in the near term. I noticed that while most were taking a beating, semi's were doing well until some late day weakness. Small have been getting pummeled.

Here is a chart of the Sox which has clearly broken support. However, this doesn't mean it won't have a tradeable bounce here soon.
MRVL broke under support however, buyers stepped in strong volume possibly setting a bottom.
TRID is another one that may of found support.
SNDK has been following the lower trendline and may be resolving into a triangle.
GOL may be setting up for another high.
NEU may of found support at the rising trendline.

I probably won't be looking to initiate any swing trade shorts due to how quickly the markets became oversold.

Good Luck,

DT


Head and Shoulders Complete Posted by downtowntrader | 5/11/2006 10:17:00 PM | 0 comments »

Looks like the Nasdaq completed the head and shoulders top with a clean break of the neckline on heavy volume. Here is an updated chart showing the Nasdaq breaking all the support lines. Looks like it will test the lower trendline, but I would expect that we get a deadcat bounce maybe as soon as tomorrow. I did end up taking both shorts posted earlier today.

No other charts tonight due to Poker Night :)

Good Luck,

DT
金币:
奖励:
热心:
注册时间:
2006-7-3

回复 使用道具 举报

 楼主| 发表于 2009-3-19 18:25 | 显示全部楼层
Possible Shorts Posted by downtowntrader | 5/11/2006 02:27:00 PM | 0 comments »

Here are a couple shorts that look pretty decent to me. BBBY is fighting to hold the 50sma, but it made a low today beneath the recent consolidation low and would yield a nice gain if it fails.

INFA fell out of a triangle yesterday and looks like it will drop some more.

Please do your own DD.


DT


Sox may be breaking down Posted by downtowntrader | 5/10/2006 10:58:00 PM | 2 comments »

The Fed remained tight lipped and that may be a problem near term. The markets have been rallying on the assumption that Fed was near pausing rate increases and any thoughts otherwise have led pullbacks. The Dow is extended right now, although the chart is very bullish. All the indicators are confirming this latest breakout, but there may be a pullback here as they are overbought now.
Another issue is the continuing problems with the Nasdaq. I had to scenarios I envisioned with the first being that the semiconductors would lead a rally. The other was that the Nasdaq would resolve into a head and shoulders top. I highlighted the H&S in a blue box. Kee in mind the pattern is not confirmed until the neckline is broken.
Here is the Sox chart. I have two trendlines here that may offer support. Things don't look good however indicator wise.
Here are a few charts worth looking at.

FMD is still holding between support and resistance. They had a doji at support today and a higher high on the daily may signal a buy.
GFIG is pulling back to the breakout area. Watch for confirmation as support.
NSC looks to be breaking out of a triangle base here.
SIRF looks like a text book short here, but good luck finding shares. They do trade options so puts may be your best bet.
COH broke below the previous pivot low today and may be headed to 28-29.
Right now the best thing to do is to stay cautious and don't press your positions. I will be waiting tomorrow to see how things shake out before deciding if I need to shift to a more bearish stance.
Good Luck,

DT


FOMC tomorrow Posted by downtowntrader | 5/09/2006 11:42:00 PM | 1 comments »

Not much I can say as the markets will probably be hanging on every word out of Bernake's mouth tomorrow. I won't be trading as the morning session will probably be very narrow and the afternoon quite choppy. I ran out of time tonight to post charts due to several reasons. However, there is not much I would be recommending anyways, until after tomorrow. One thing I did notice as I was looking over some charts is that there are a lot of bowls, saucers, and cup with handles on the oil/gas services stocks. Here are some of the better looking ones:
grp
hal
kmg
ard
ois
helx

Also, some of the infrastructure / mining plays are looking good. Cramer keeps pumping these guys and I do think mutual funds are liking these sectors. Some decent ones are:
CCJ
CAT
FWLT

I think it can only be viewed as bullish that most of the indices are at highs despite divergences or weak internals. However, keep in mind that we could have a nasty reversal if Bernake throws us a curve ball.
Good Luck,

DT


Consolidation day Posted by downtowntrader | 5/08/2006 11:46:00 PM | 0 comments »

We had a consolidation today and will probably have more of the same with the Fed meeting coming on Wednesday. Here are a few charts to watch.

I added MAN to the squawk portfolio . Although it is pretty extended, the bull flag breakout can lead to some powerful moves.


FWLT looks like it will get a regular Cramer pump and appears to have broken the pullback base.
ICE looks like it is breaking a nice triangle base here.
I'm still watching MFLX for a breakout. They are still holding above previous resistance.
MLR had a nice breakout today.
PCU is breaking out of a tight little triangle. While I think copper is extended, you can't fight the trend.
I'm watching TRAD to see if it can clear the descending trendline.
TZOO looks like it is consolidating between these two trendlines. If you pull up a long term chart you can see that these two areas have had importance before.

Thats it for tonight.
Good Luck,

DT
金币:
奖励:
热心:
注册时间:
2006-7-3

回复 使用道具 举报

 楼主| 发表于 2009-3-19 18:26 | 显示全部楼层
Bulls pressing the action Posted by downtowntrader | 5/07/2006 09:55:00 PM | 0 comments »

It looks like the bulls are pressing the action. The SP500 cleared the resistance I wrote about on Thursday night although volume was just average for a market breaking resistance. I will be watching the Nasdaq for confirmation of a rally. Here are a few charts that look decent.

ABAX has had a few steep down sessions lately but has had pretty good support near 23-24. Watch to see how they react to the ascending trendline.
ARP cleared resistance but left a long wick on the breakout day. Watch to see if it follows through.
CCJ may be ready to break to new highs. They cleared horizontal trendline resistance and then tested the line as support.

GBX looks like it will come back to test the trendline as support.
IBCA is trading a tight range here. Keep an eye for a breakout.
SLW looks like it is resolving into a triangle here.
AUY chart looks like it wants to move higher.
NSM may finally clear resistance here. The key is the sox and nasdaq.

Good Luck,

DT


Will the Nasdaq synch up? Posted by downtowntrader | 5/04/2006 11:17:00 PM | 0 comments »

The Nasdaq has been out of synch with the other major markets and that can't last forever. There are a couple things to watch here.

Here is the Nasdaq bouncing off a support line for the second time after breaking it as resistance. If the Nasdaq can get past resistance they will lead another rally. The Nasdaq has managed to trade sideways to the middle of it's trading channel.However, If there is gonna be another rally, then the SP500 needs to clear this triangle which is easier said then done. Look at all the wicks and reversals in this area. Keep in mind that the SP500 is at the top of a trading channel here and for it to breakout takes considerable momentum.

The key to this market is still the Nasdaq. The Dow is over the long term channel. Same goes for the Russell. The SP500 is at the top and only the Nasdaq has ample room before testing the top. I don't think the other markets can pull the Nasdaq up because they have divergences all over the place and deteriorating technicals. However the Nasdaq has been lagging and semiconductors have corrected to the point where there could be enough strength to lead the markets again. My view has been that a drop in overbought commodities could fuel a rotation to technology and the pullback in crude could be part of that. However, this is a tricky market and the rug could be pulled out from under any rally at this point. There is a chance that a bull trap is being set and that the Nasdaq will carve out a head and shoulders top. It really is too early to pick a side so the best strategy is to trade carefully and keep some dry powder until a more clear picture develops. Good Luck,

DT


Some charts Posted by downtowntrader | 5/03/2006 09:22:00 PM | 2 comments »

I was out all day and won't be trading tomorrow so I can't really review where we stand. However, I went through the IBD100 tonight and I am highlighting a few interesting charts.

We'll start off with a couple shorts.

BER broke down and has formed a little bear pennant up to resistance.

CIB fell out of an ascending triangle. Could drop to previous pivot low or worse.
FMD has an interesting chart as it broke out of a base but has been having a hard time with previous gap resistance. If it can close the gap, it might make a move to the 70's.
I highlighted MFLX as a chart to watch to see how it handled the trendline and it looks like it is bouncing off of it.
NEU is looking very strong here.

I ran out of time but a couple other charts to keep in mind are INFA and ITRI.

Good Luck,

DT
金币:
奖励:
热心:
注册时间:
2006-7-3

回复 使用道具 举报

您需要登录后才可以回帖 登录 | 立即注册

本版积分规则

本站声明:MACD仅提供交流平台,请交流人员遵守法律法规。
值班电话:18209240771   微信:35550268

举报|意见反馈|手机版|MACD俱乐部

GMT+8, 2025-7-20 23:19 , Processed in 0.053835 second(s), 9 queries , MemCached On.

Powered by Discuz! X3.4

© 2001-2017 Comsenz Inc.

快速回复 返回顶部 返回列表