- 金币:
-
- 奖励:
-
- 热心:
-
- 注册时间:
- 2006-7-3
|
|

楼主 |
发表于 2009-3-19 18:28
|
显示全部楼层
Still some decent charts out there Posted by downtowntrader | 5/01/2006 10:00:00 PM | 0 comments »
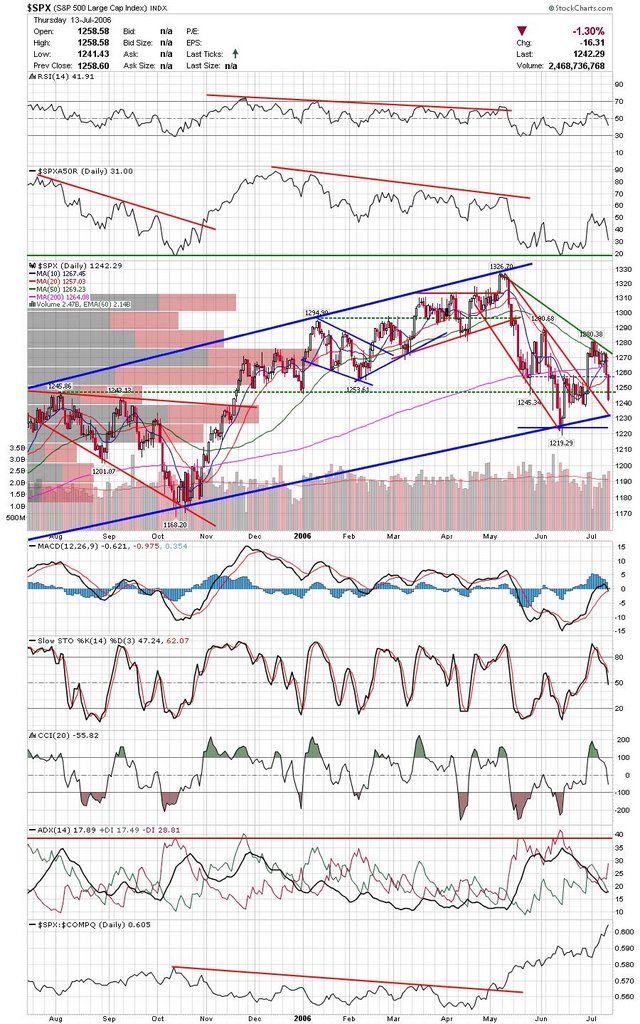
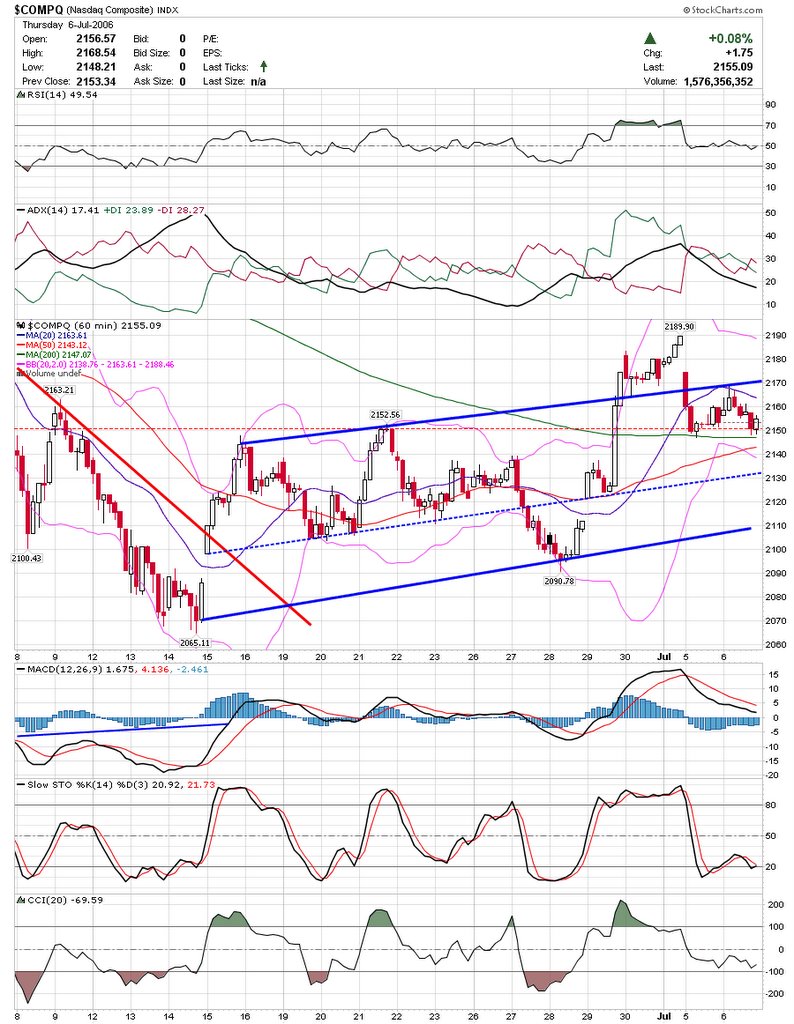
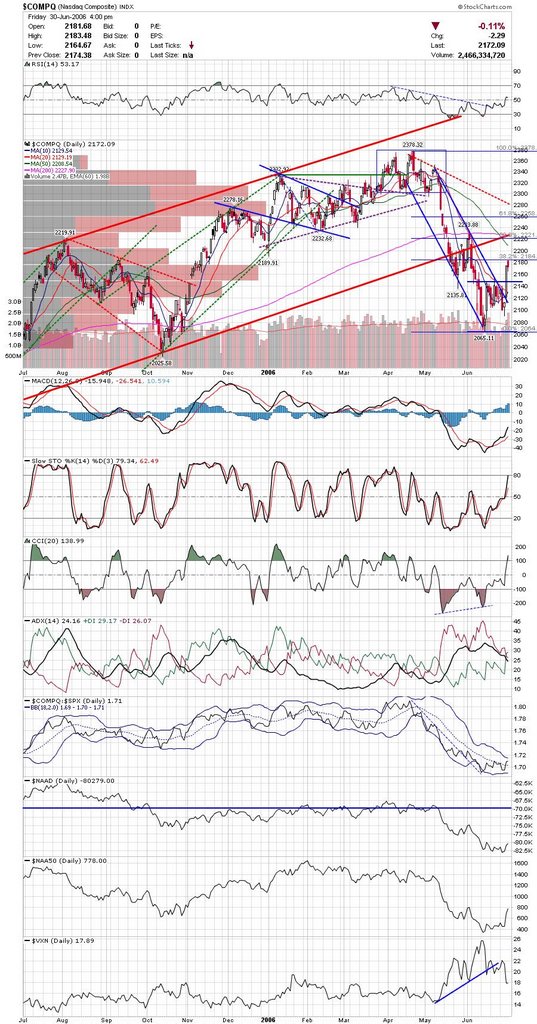
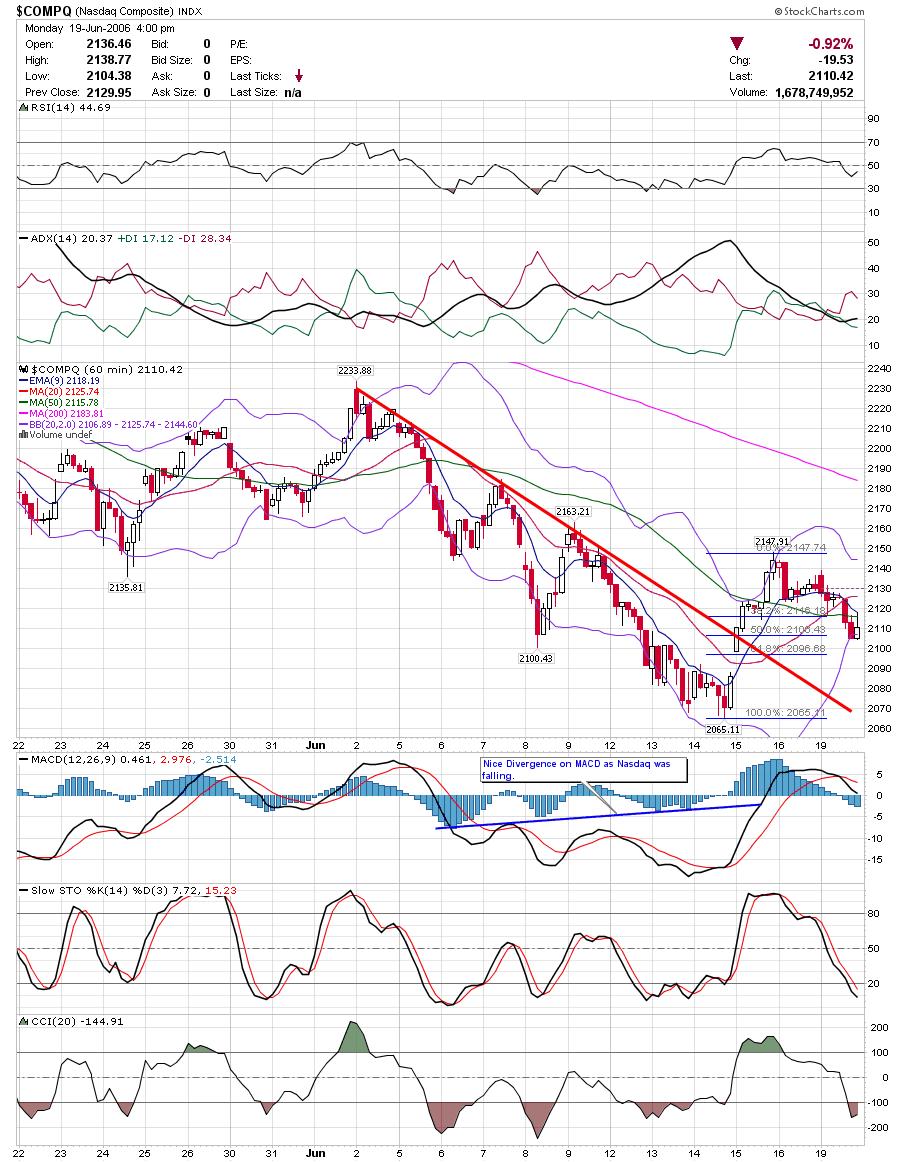
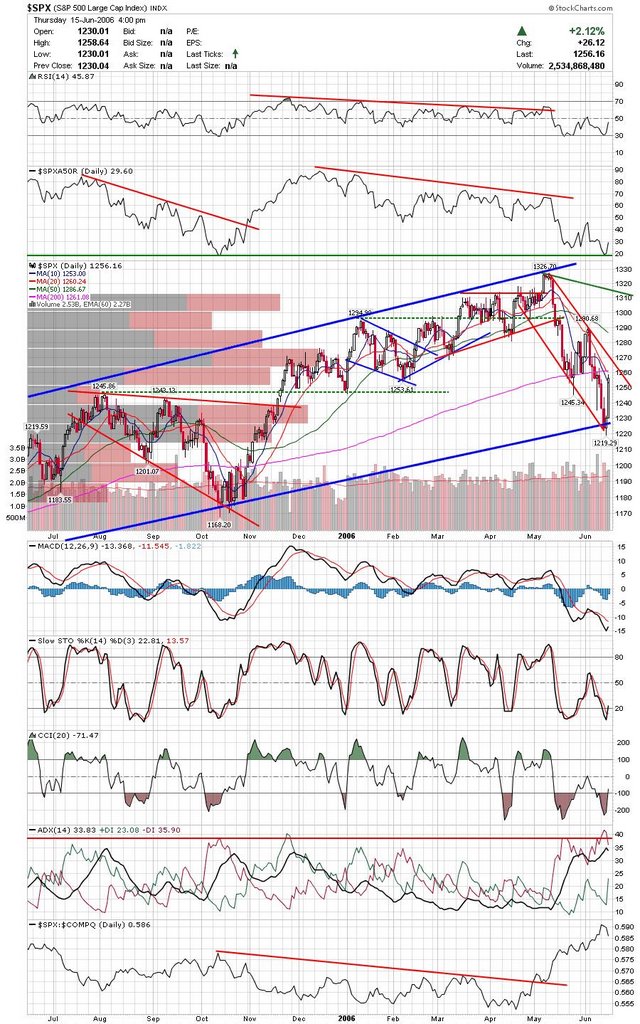
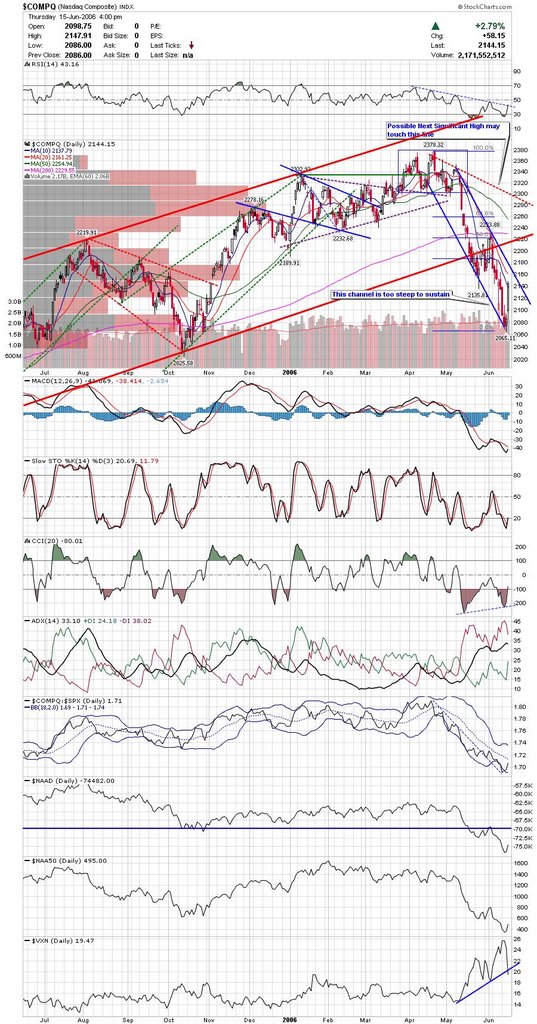
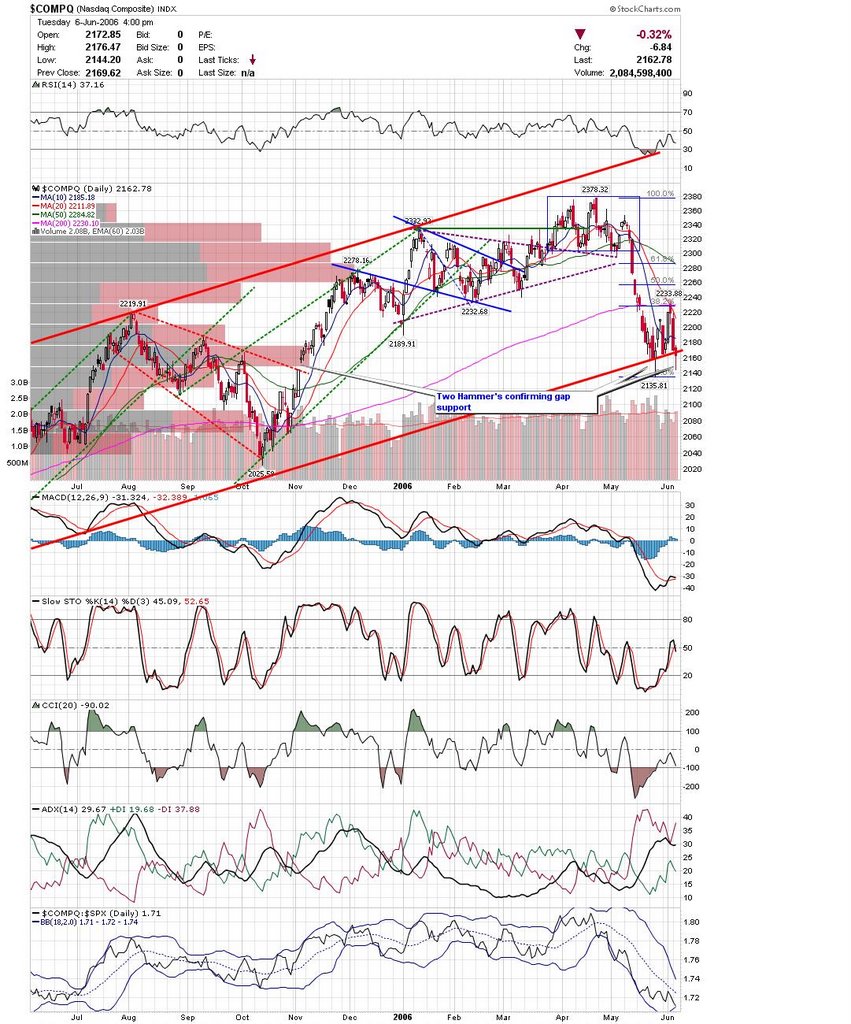
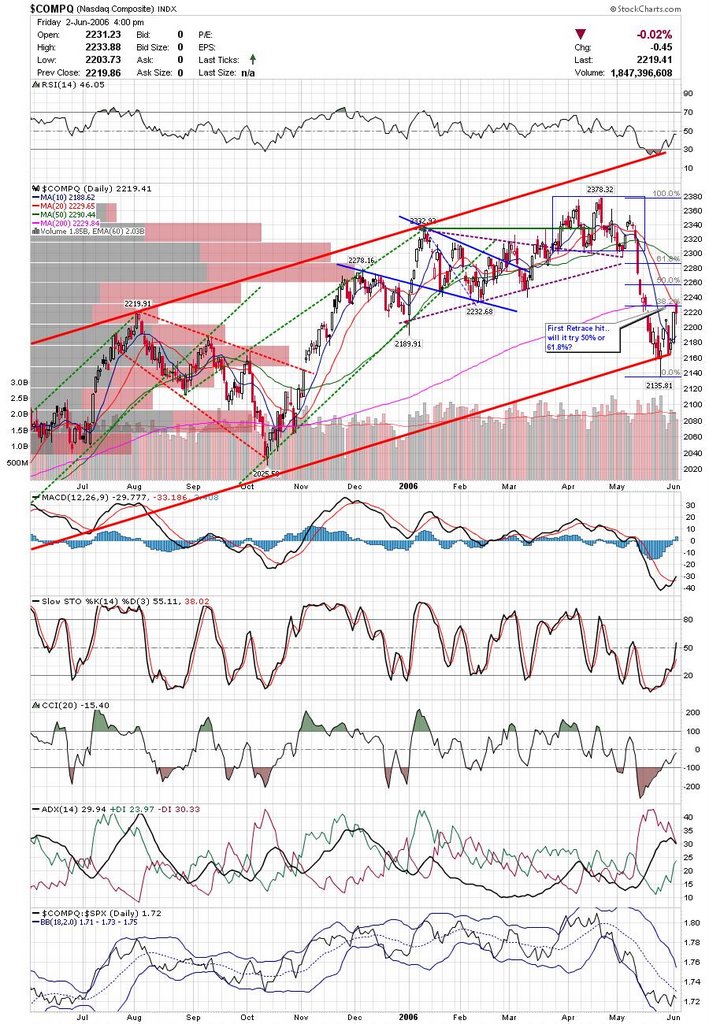
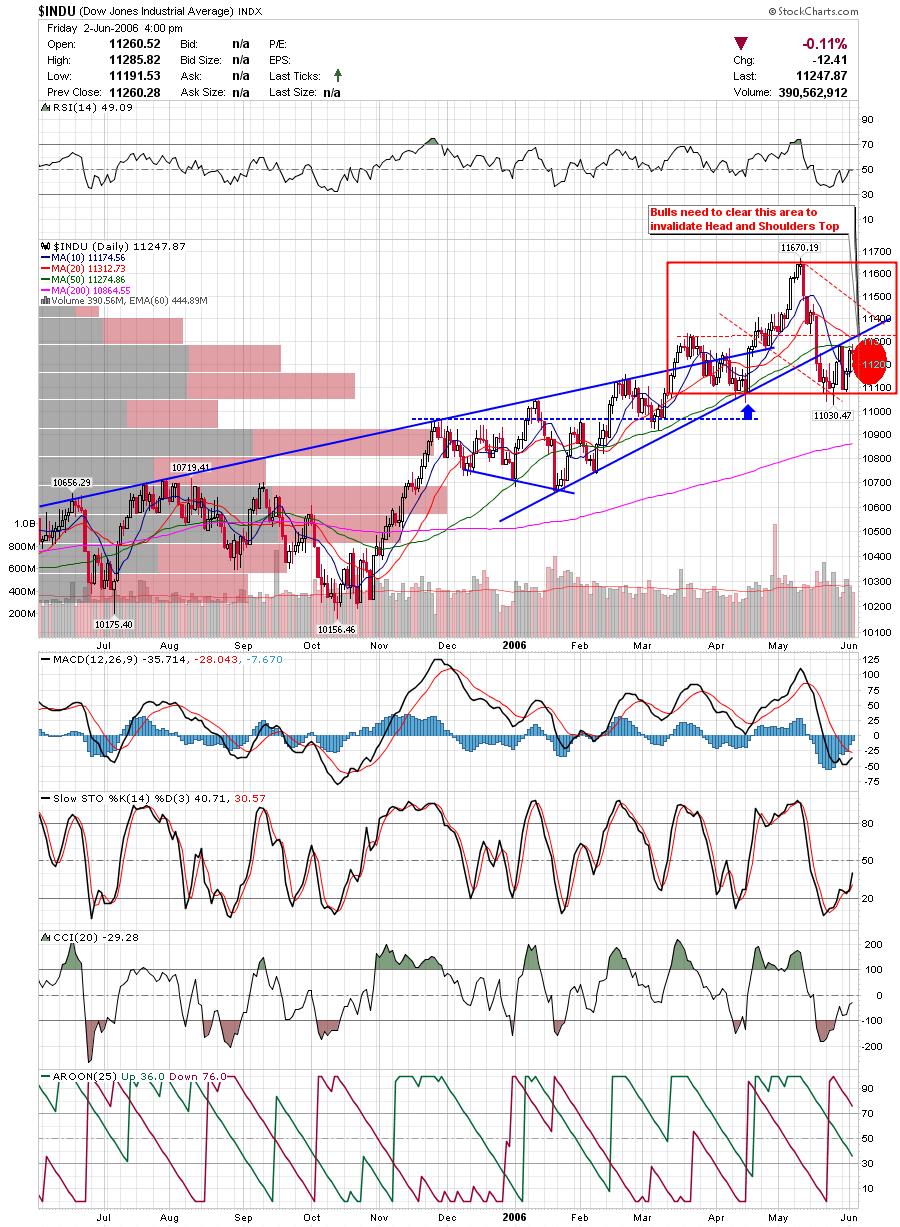
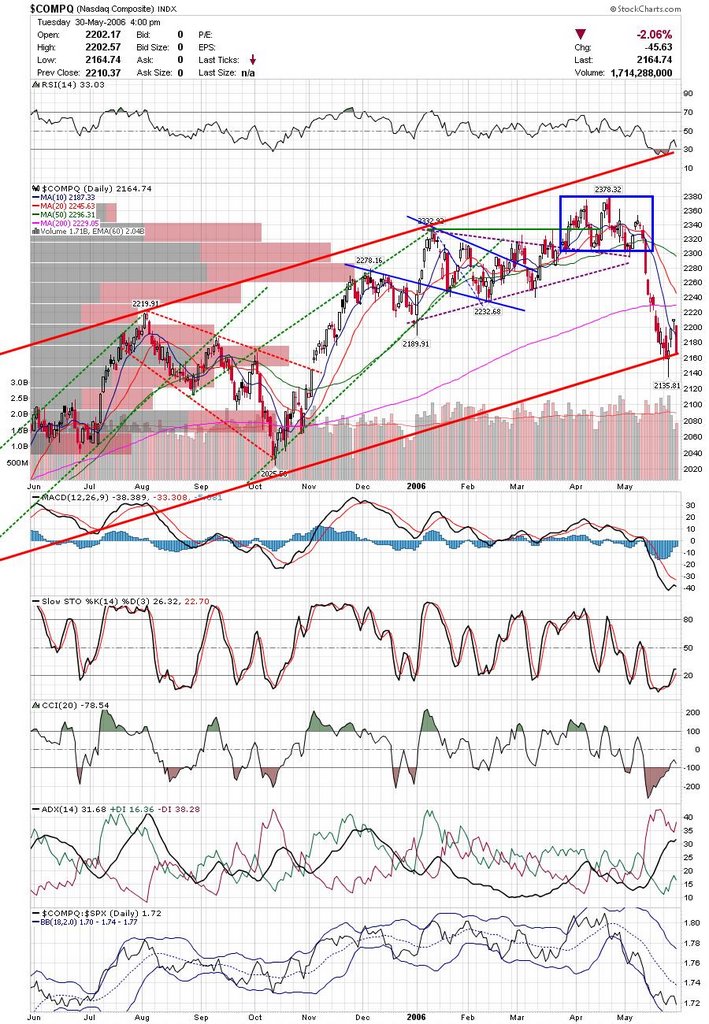
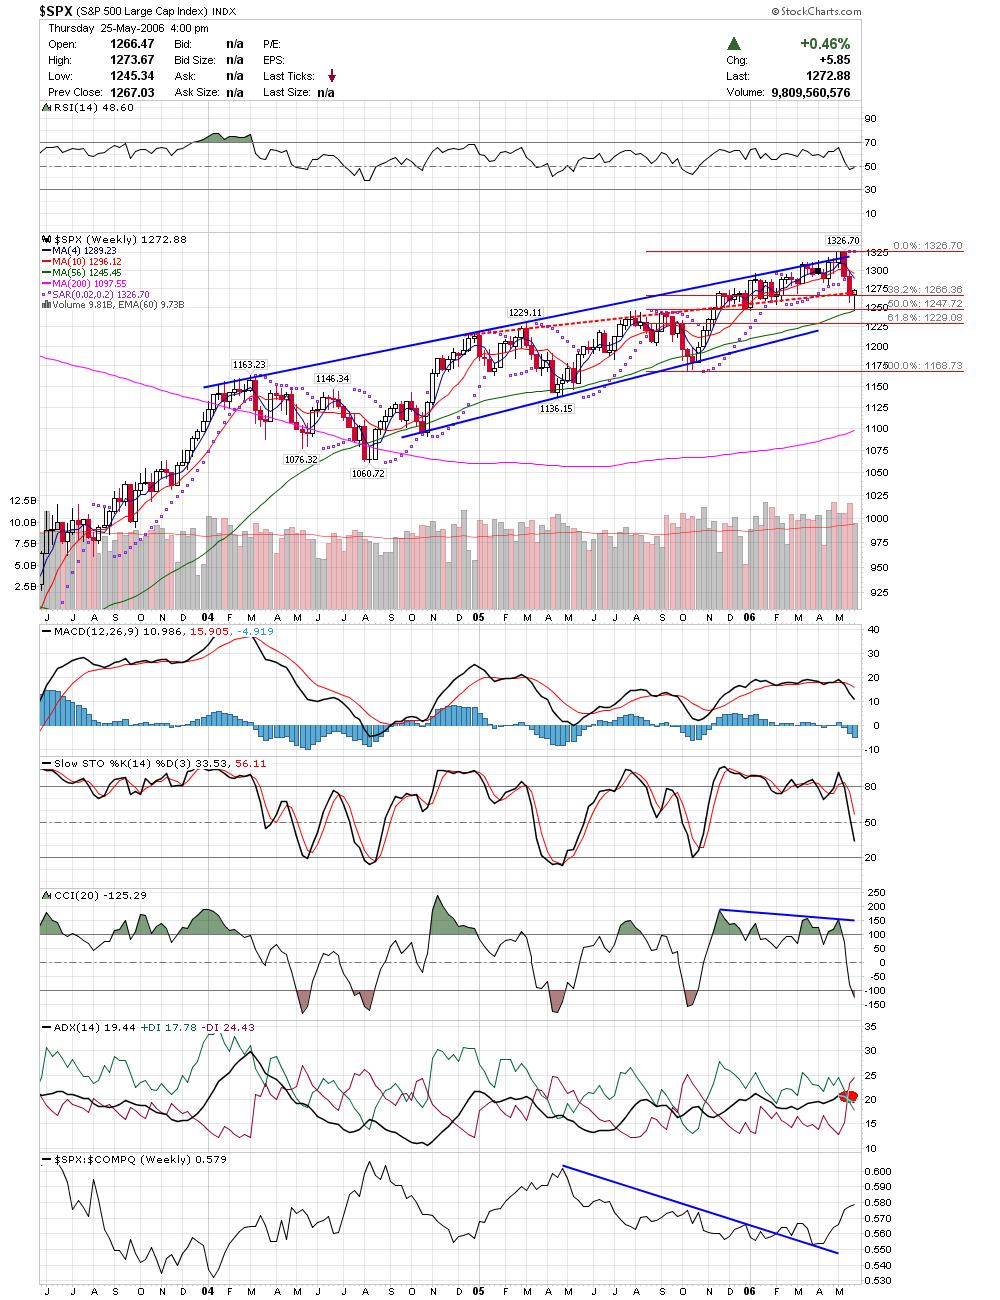
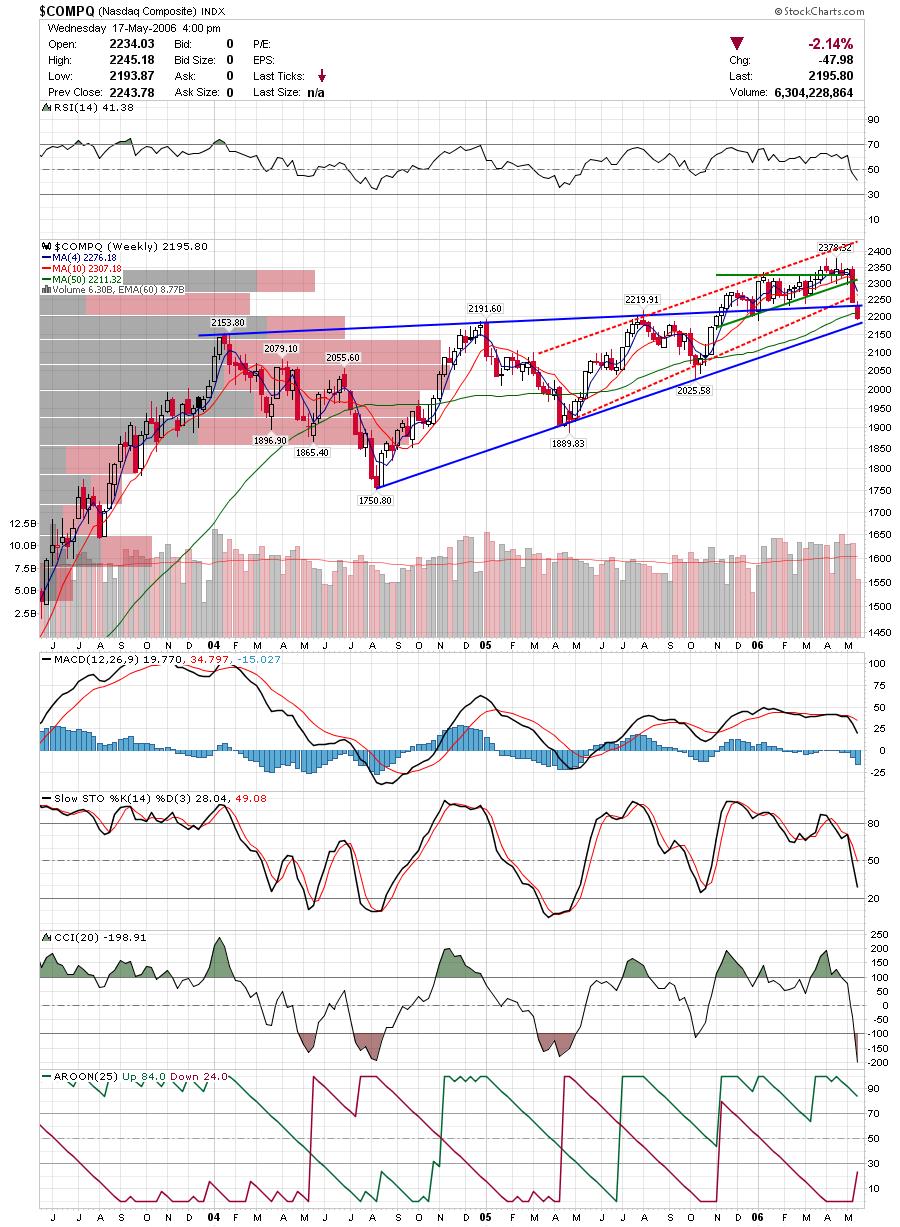
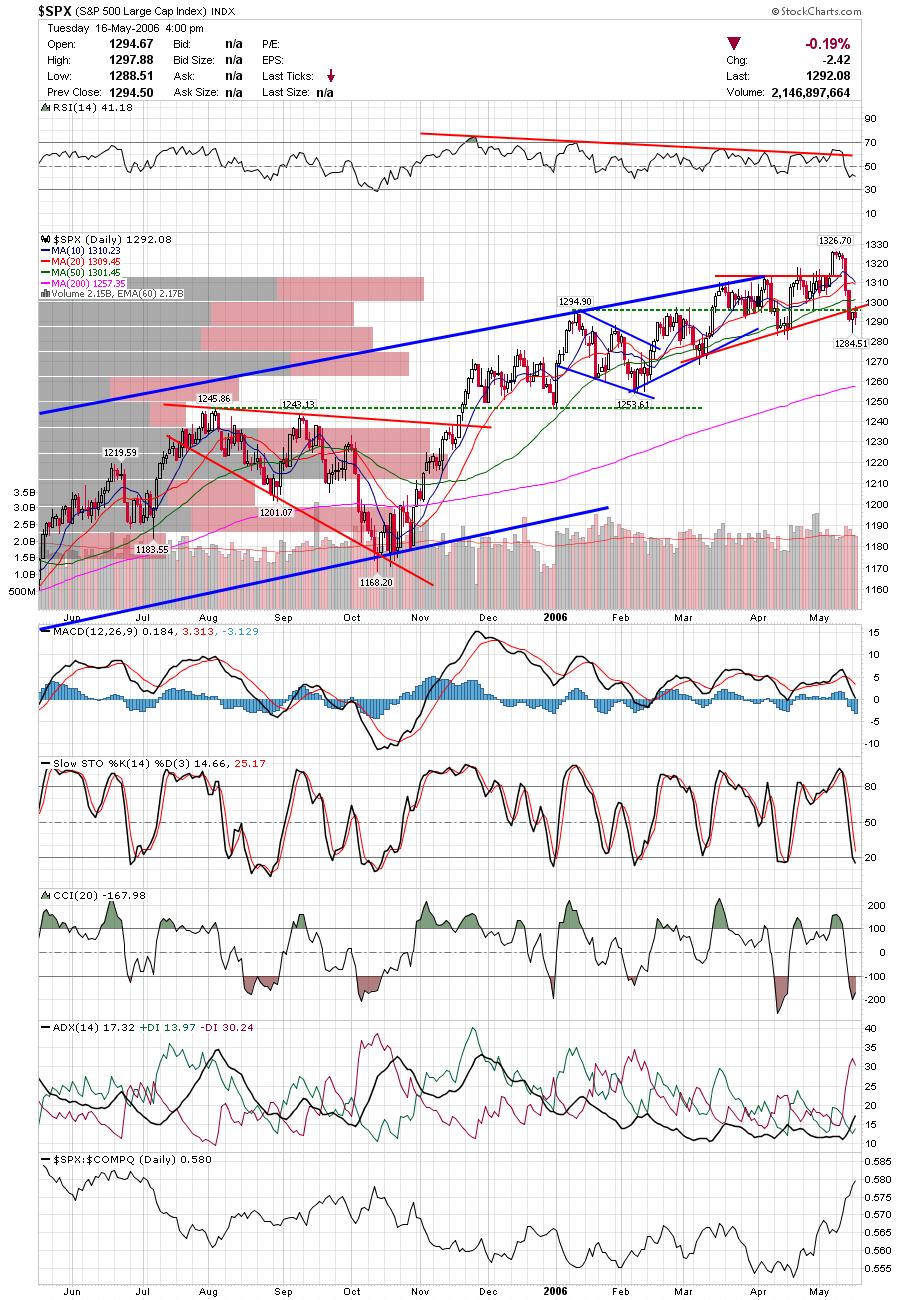
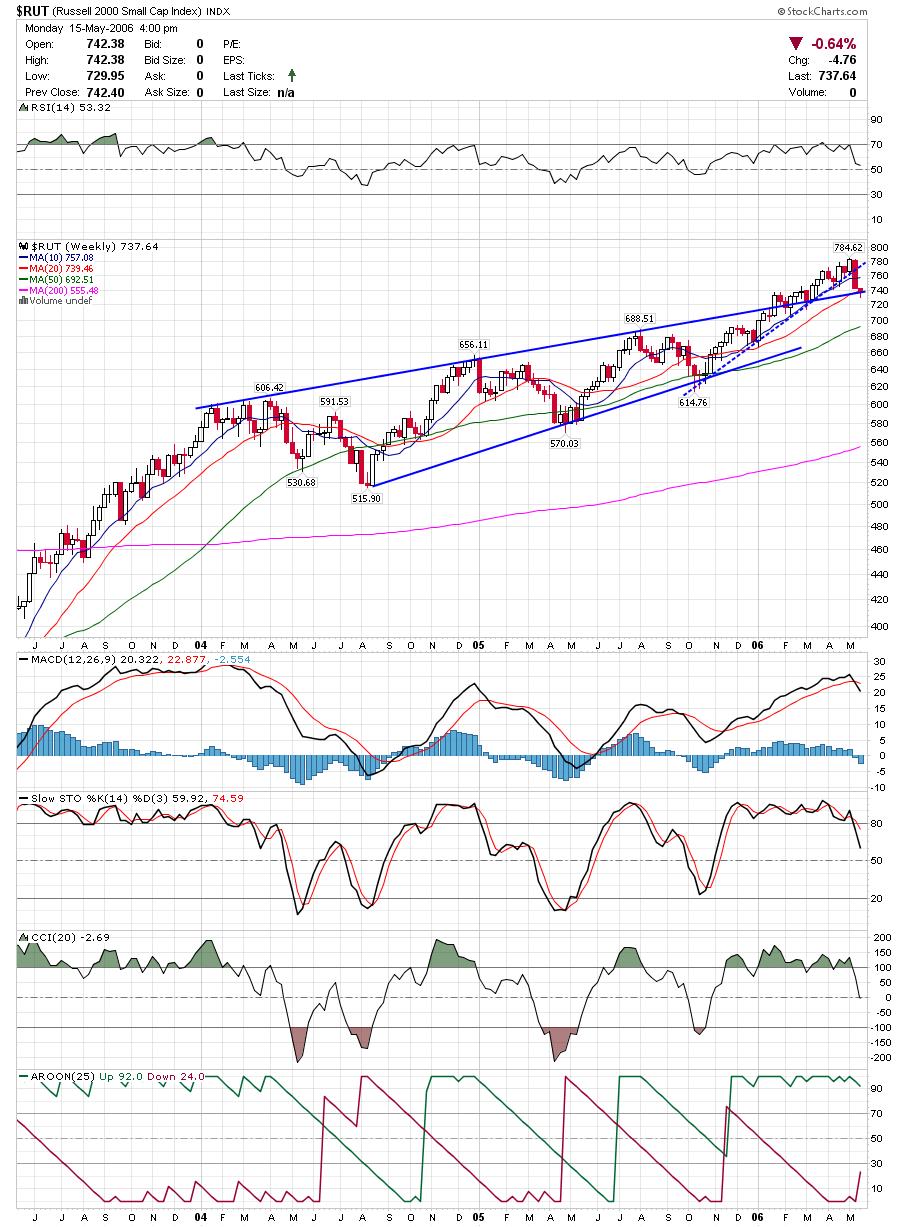
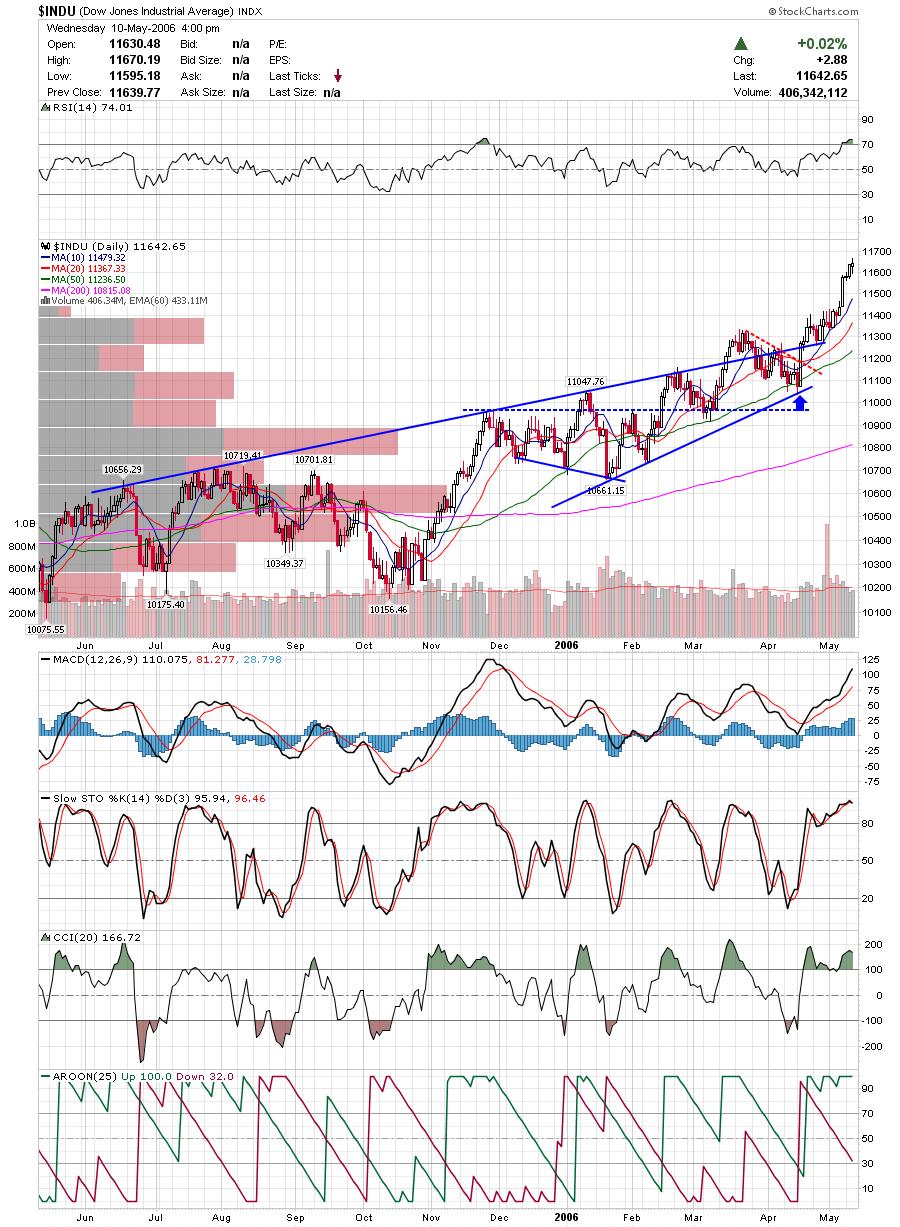
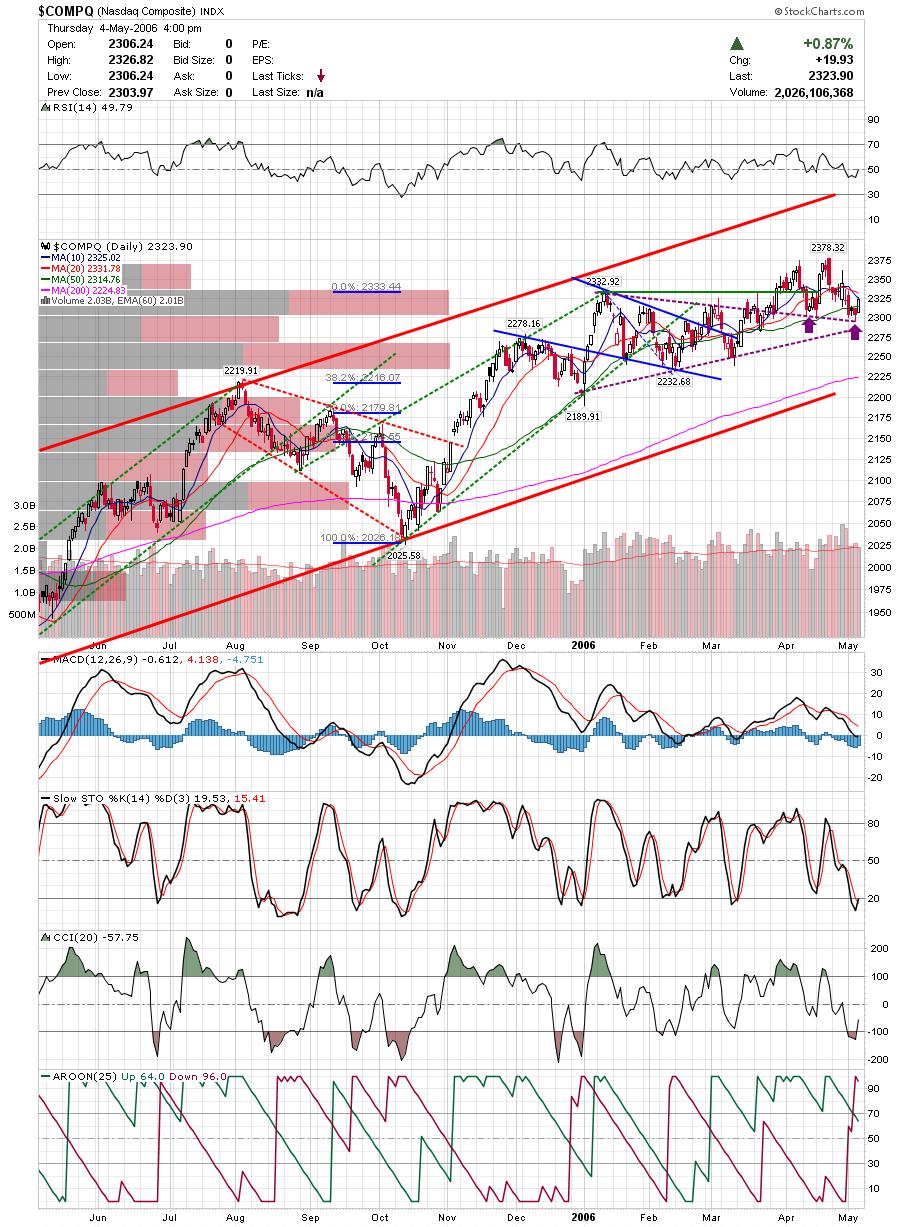
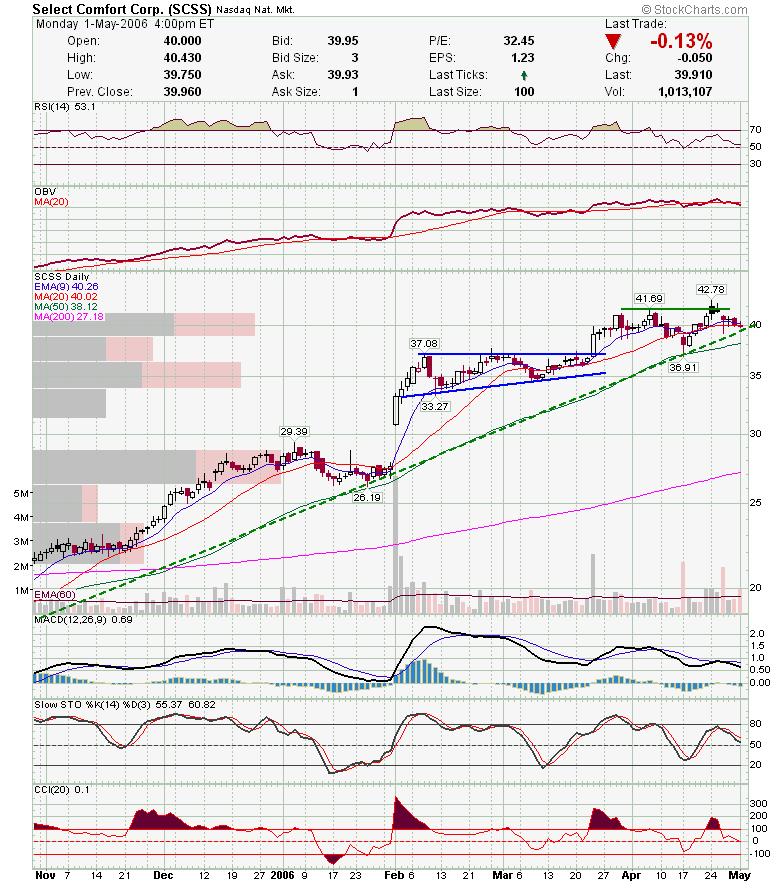
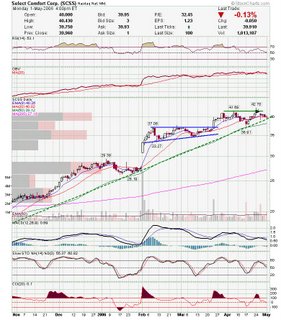
I had to look pretty hard, but I did find a few charts that still look decent on the long side. Todays late day reversal may be the nail in the coffin for this bull rally, but there is a chance we still get a bounce here, particularly on the nasdaq. If we are topping out as many believe, then I can envision the nasdaq forming a Head and Shoulders or Triple top. Here is an updated Nasdaq chart. You can see a possible double top or left shoulder and head. As the nasdaq pulls back to the trendline it could get a bounce.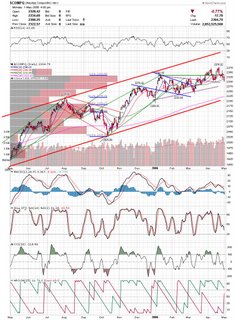 SCSS whethered mediocre earnings and is drifting to a trendline. SCSS whethered mediocre earnings and is drifting to a trendline.
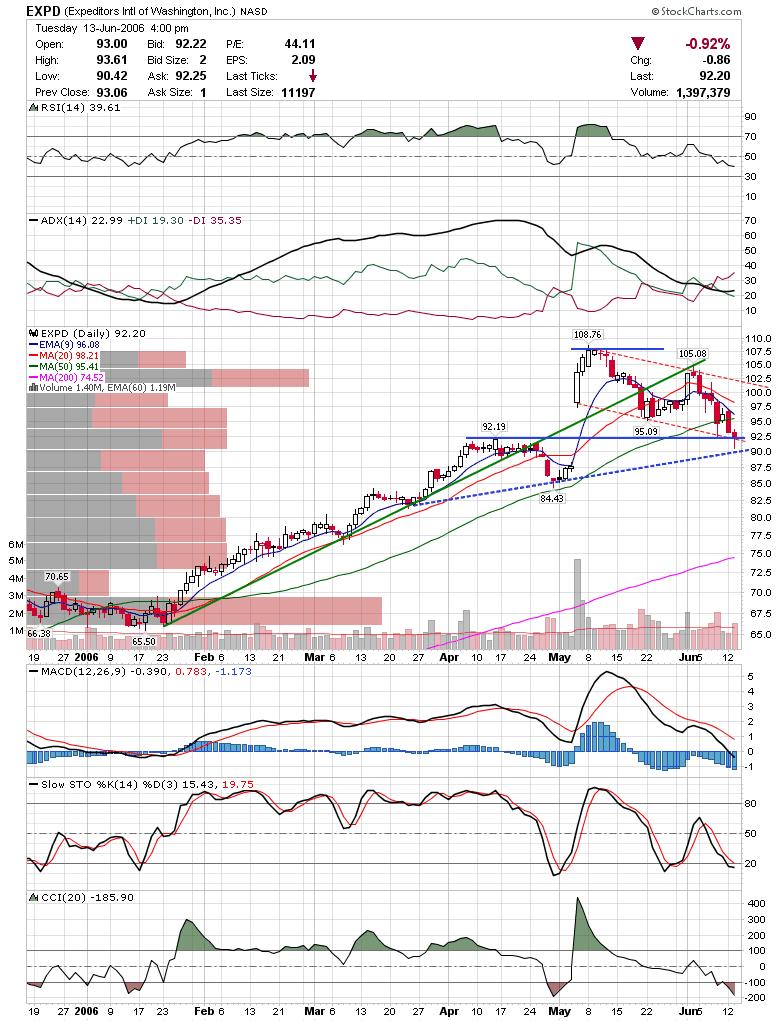
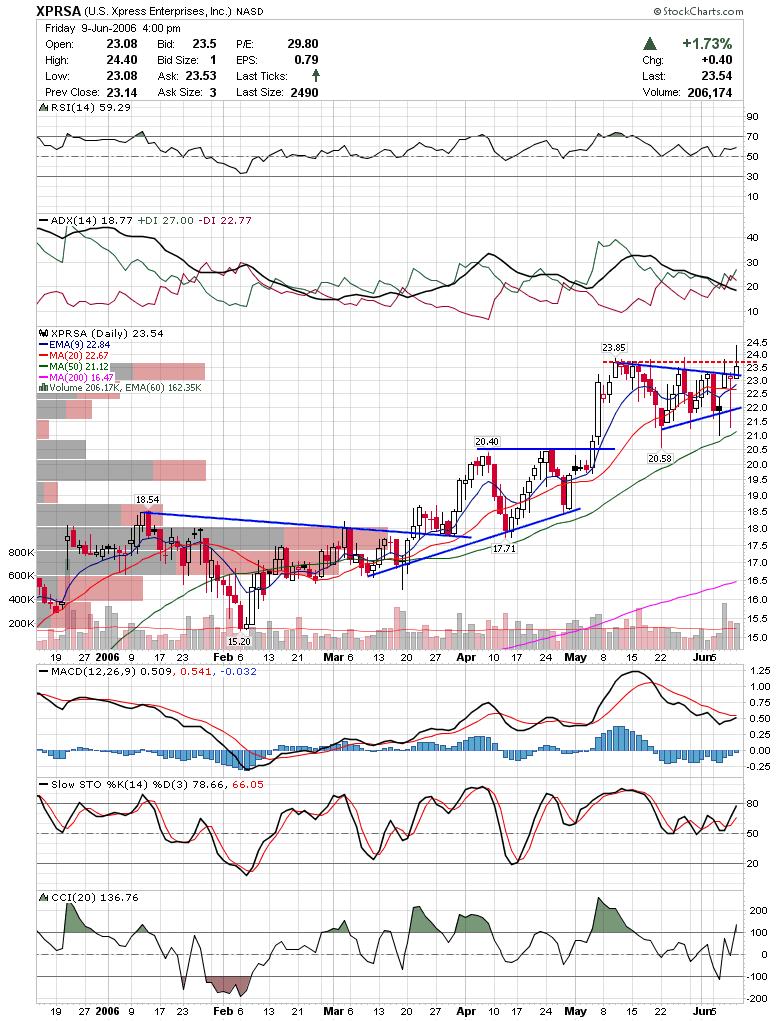
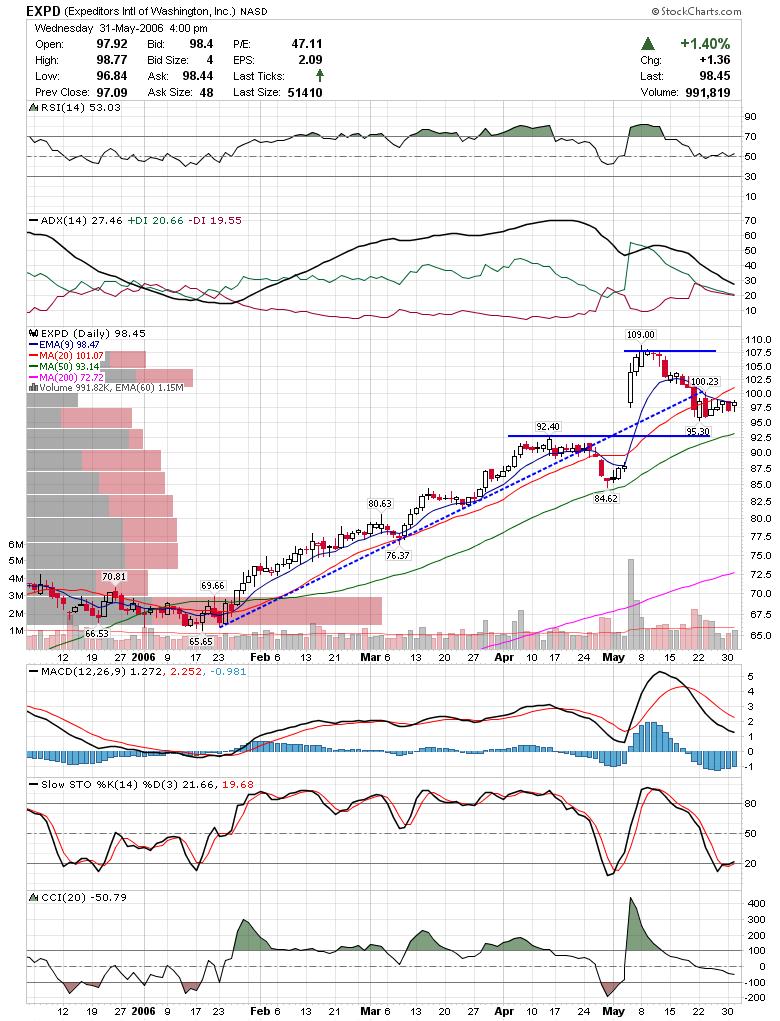
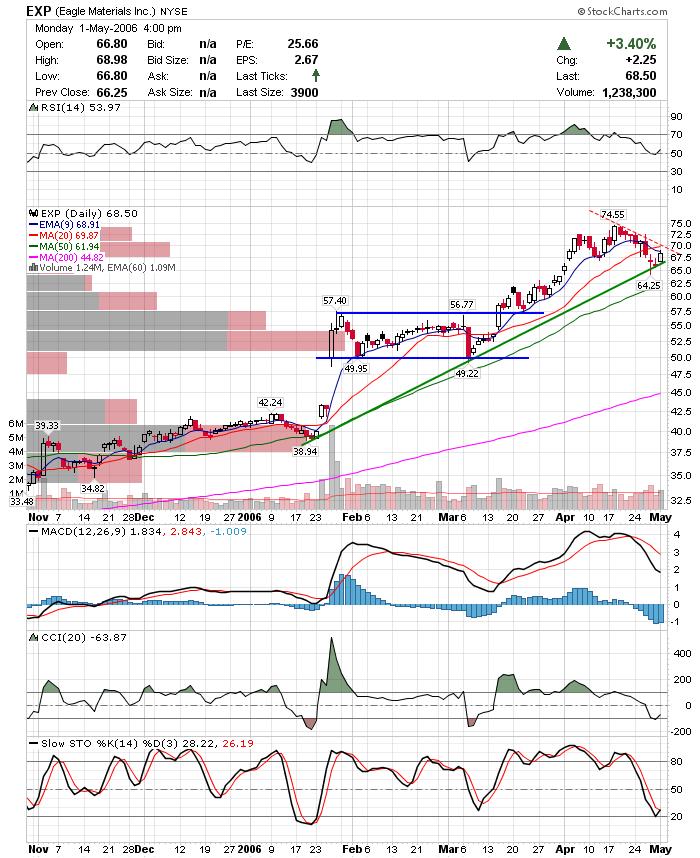
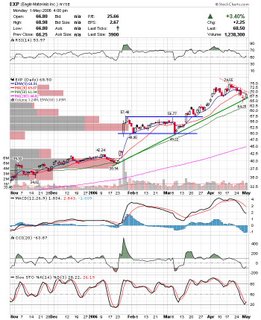
 EXP looks to have finished the recent pullback and has support on the trendline. EXP looks to have finished the recent pullback and has support on the trendline.
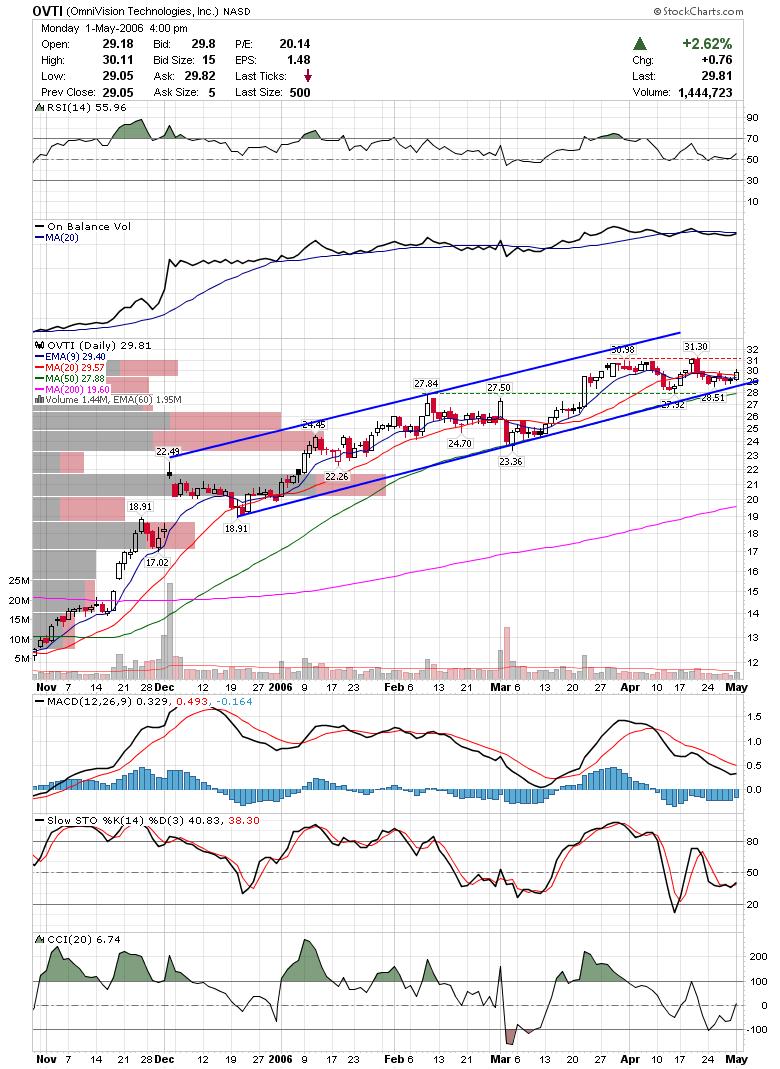
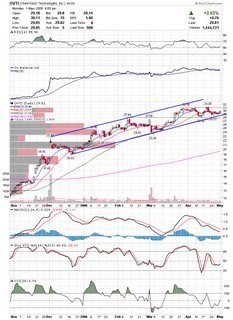
 OVTI is one of the more promising charts I turned up. Nice consolidation here and indicators are perking up. OVTI is one of the more promising charts I turned up. Nice consolidation here and indicators are perking up.
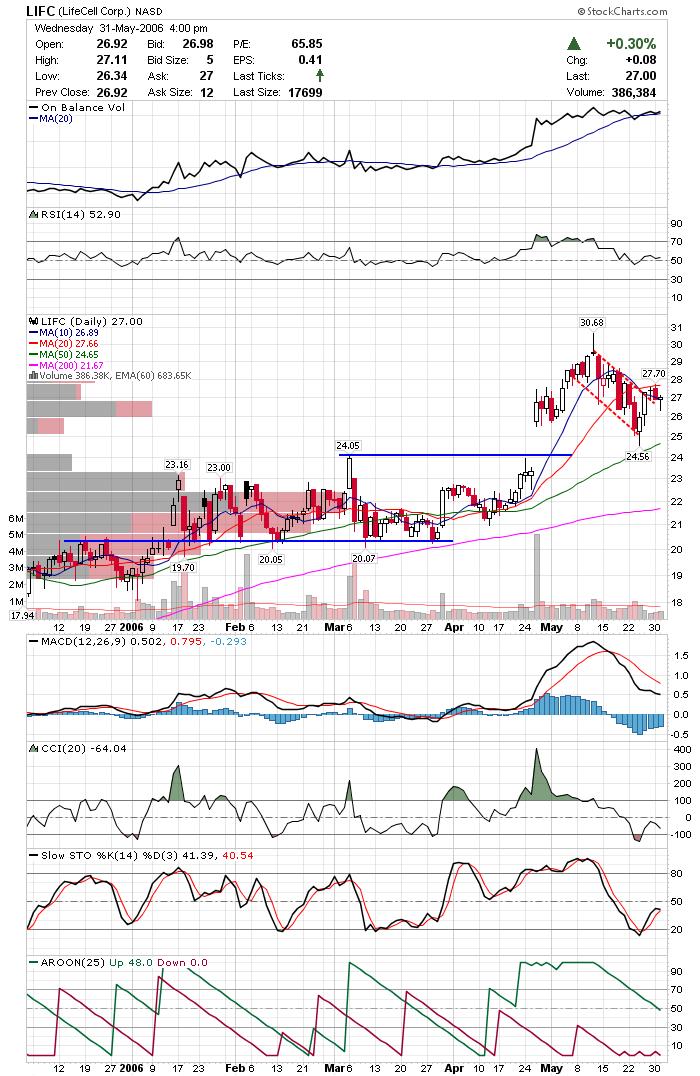
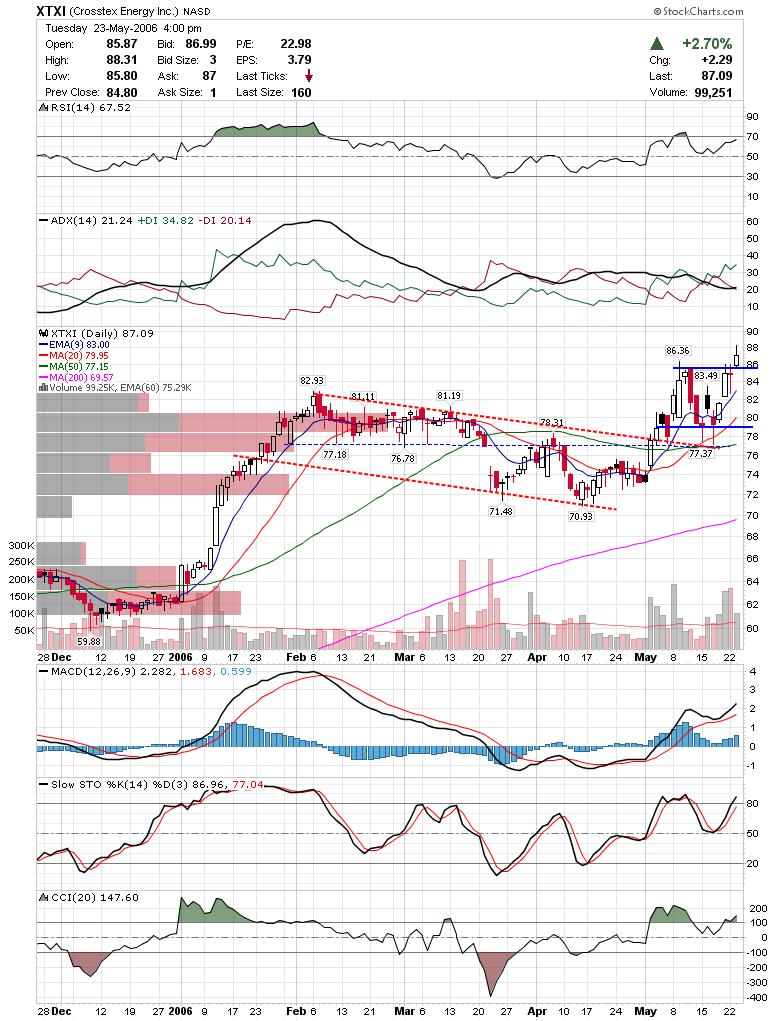
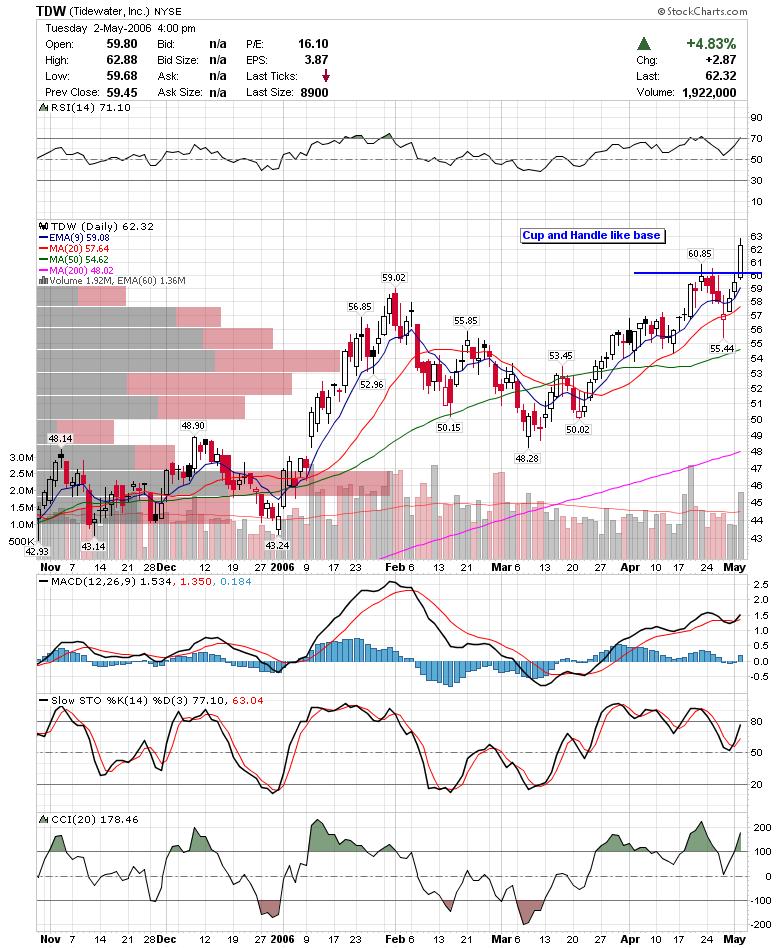
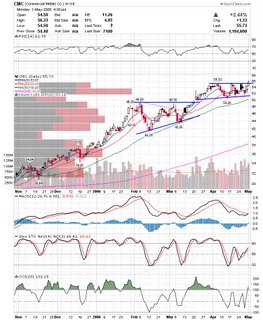
 CMC managed to hold on to gains today and finished with a close over the previous 52 week high. CMC managed to hold on to gains today and finished with a close over the previous 52 week high.
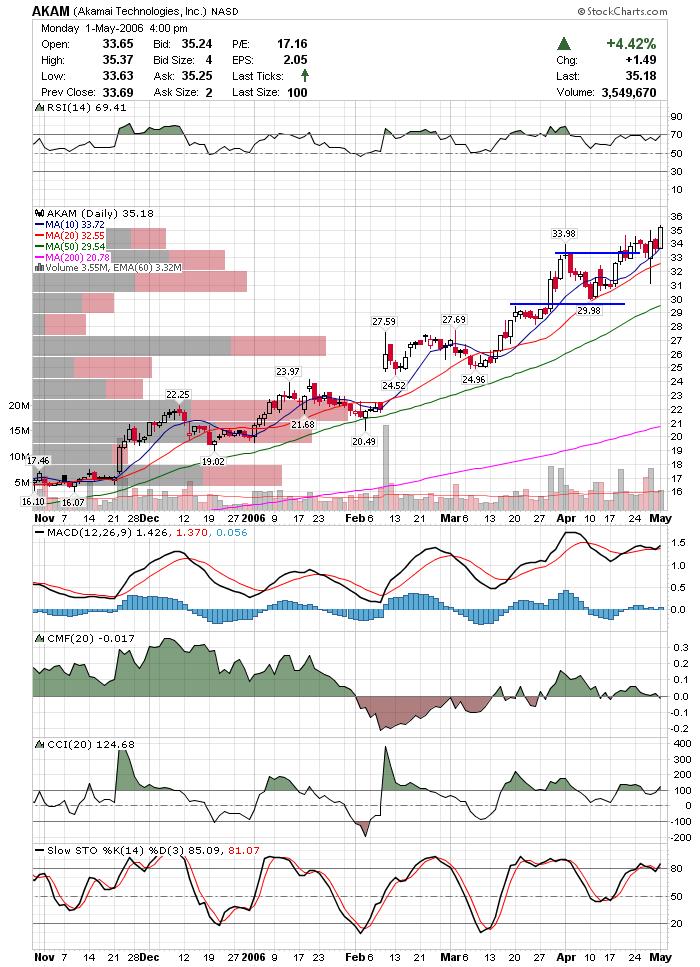
 AKAM also hit a new 52 week high and held up very well when the nasdaq was tanking. AKAM also hit a new 52 week high and held up very well when the nasdaq was tanking.
 Here are a few charts to watch in case the markets are red tomorrow. Here are a few charts to watch in case the markets are red tomorrow.
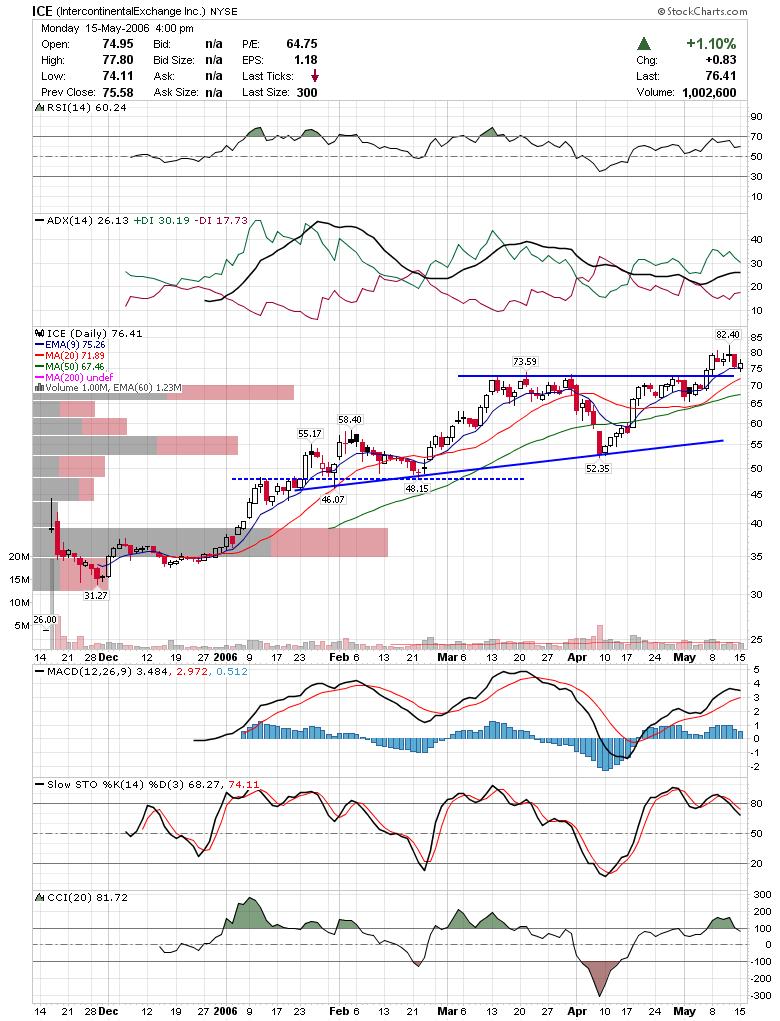
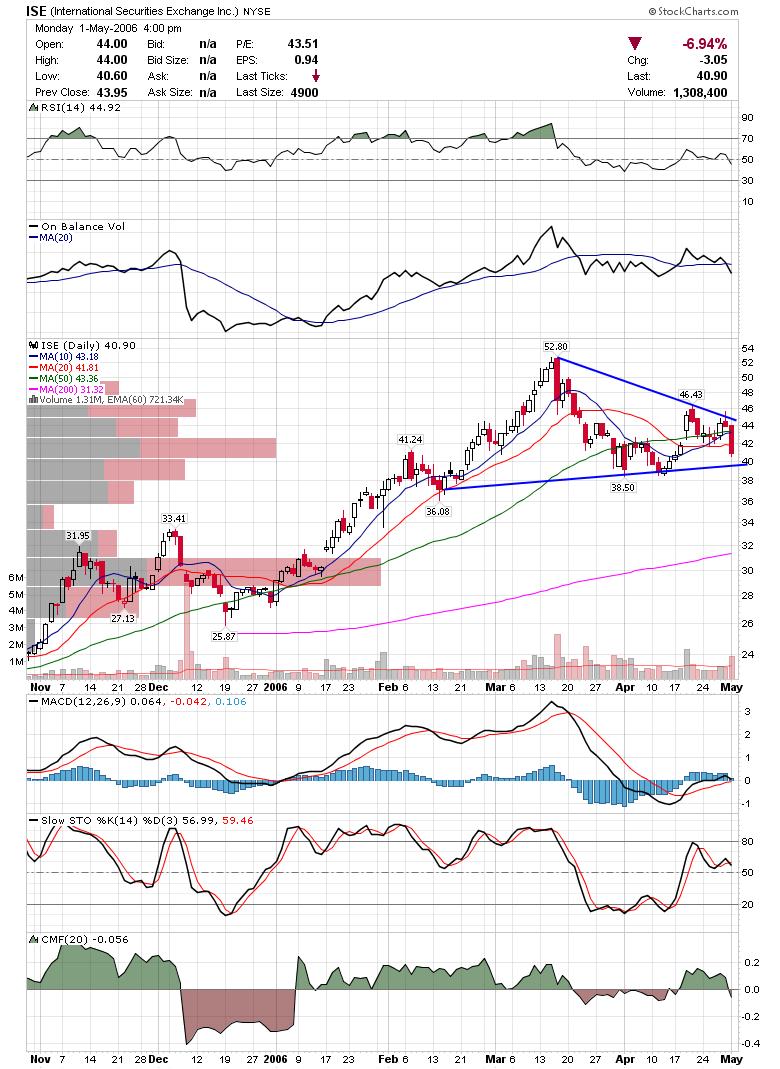
ISE has fellow exchane stock ICE reporting tomorrow. If ICE disappoints, then ISE could break out of the triangle to the downside.
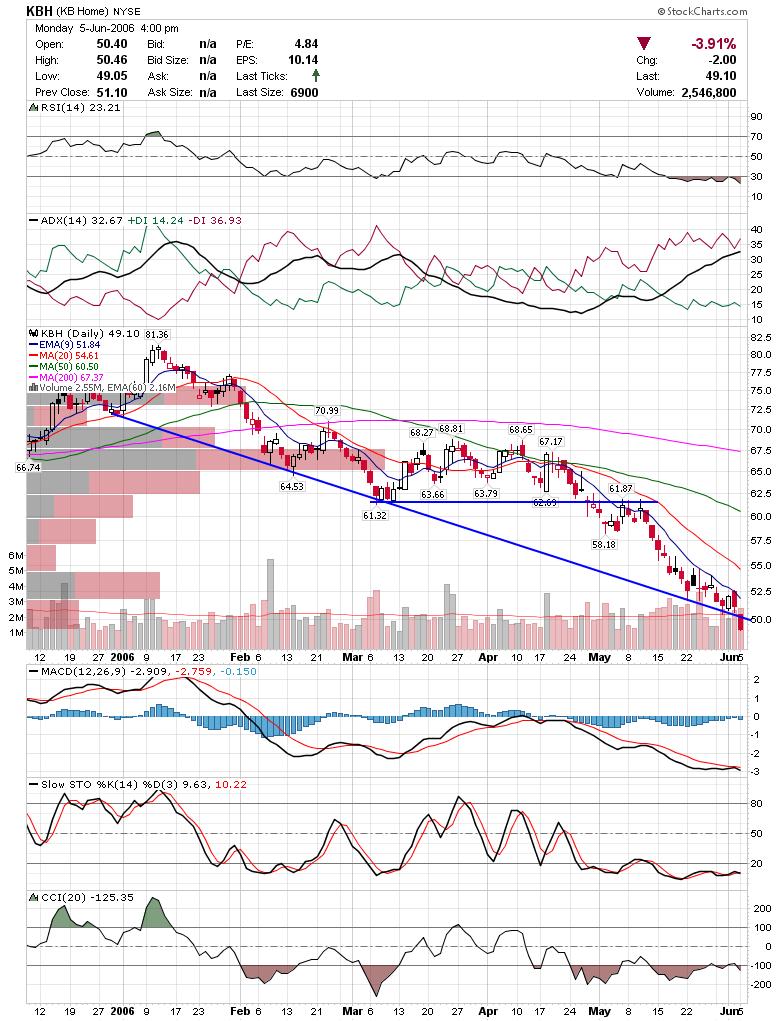
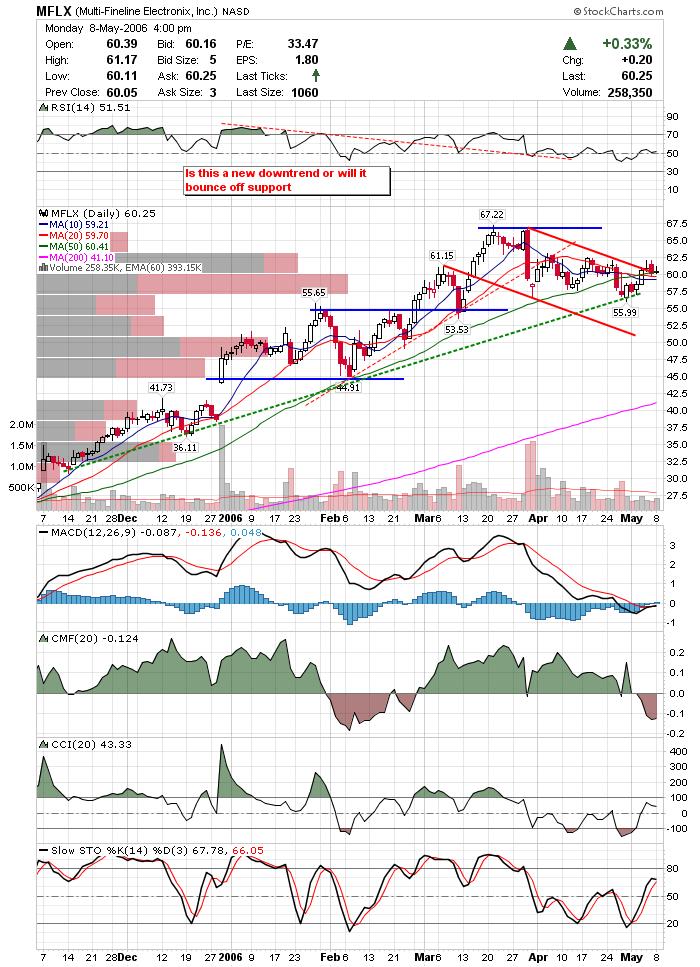
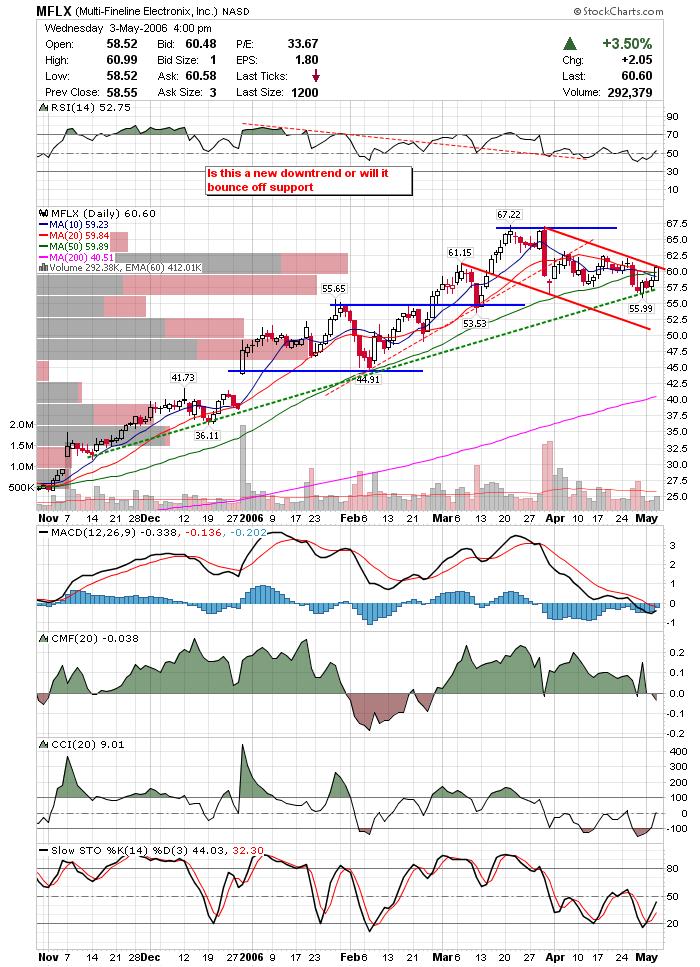
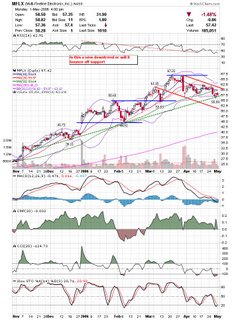
 Has MFLX started a downtrend or is this still part of a normal pullback. Keep an eye on the trendlines. Has MFLX started a downtrend or is this still part of a normal pullback. Keep an eye on the trendlines.
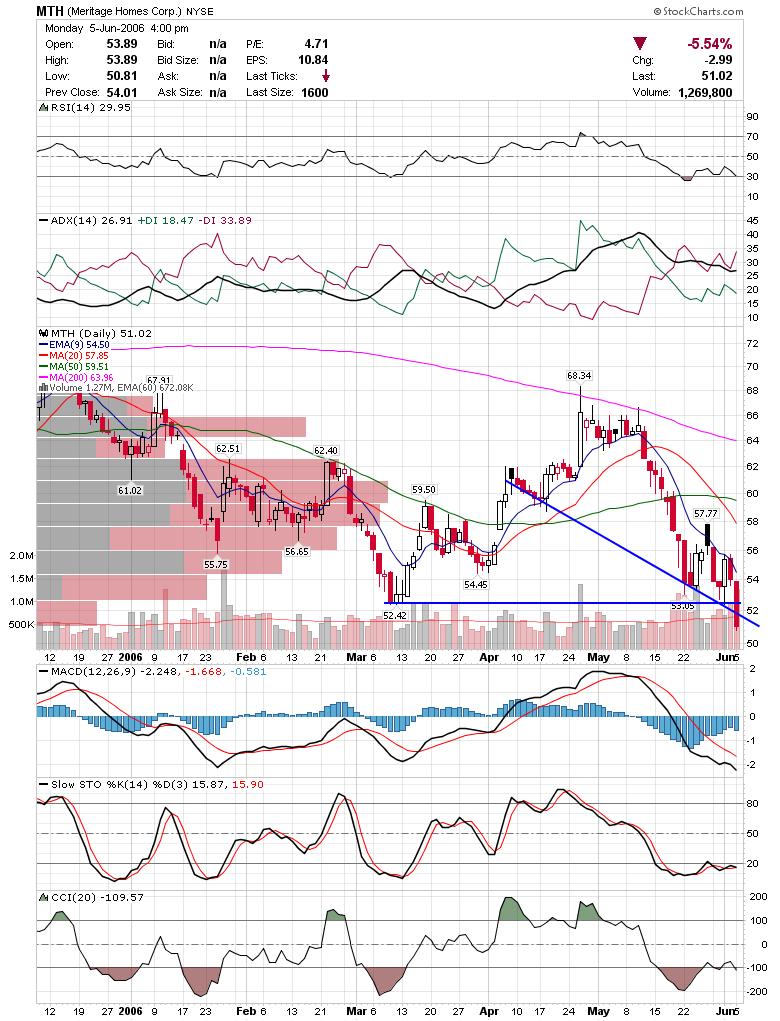
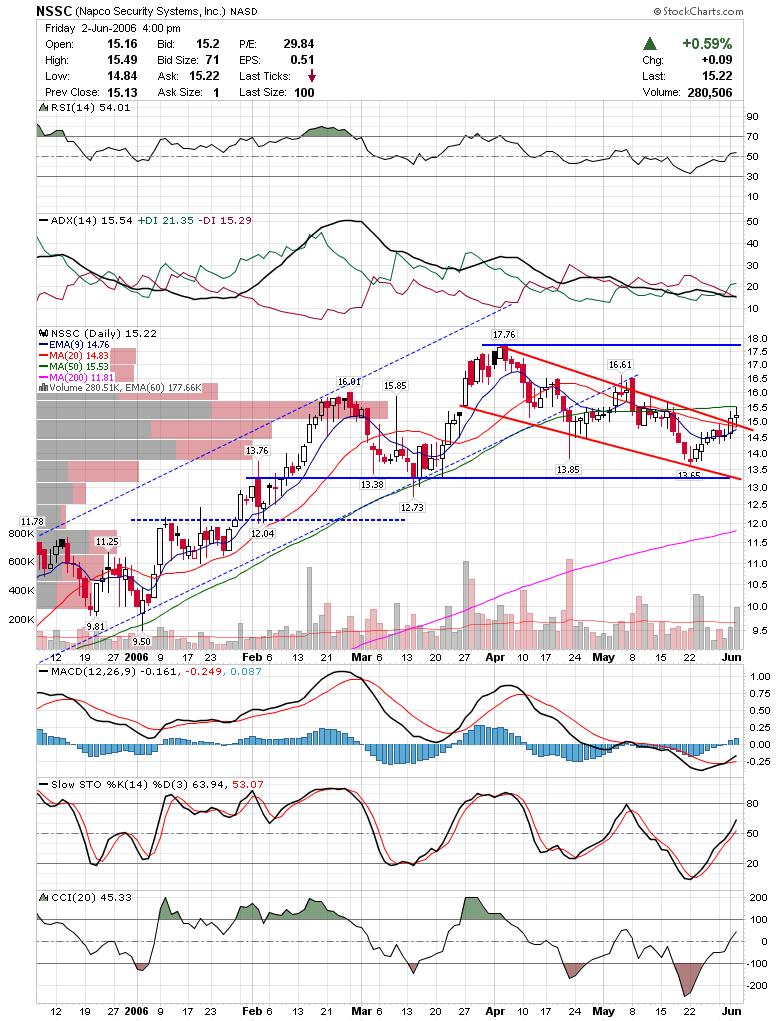
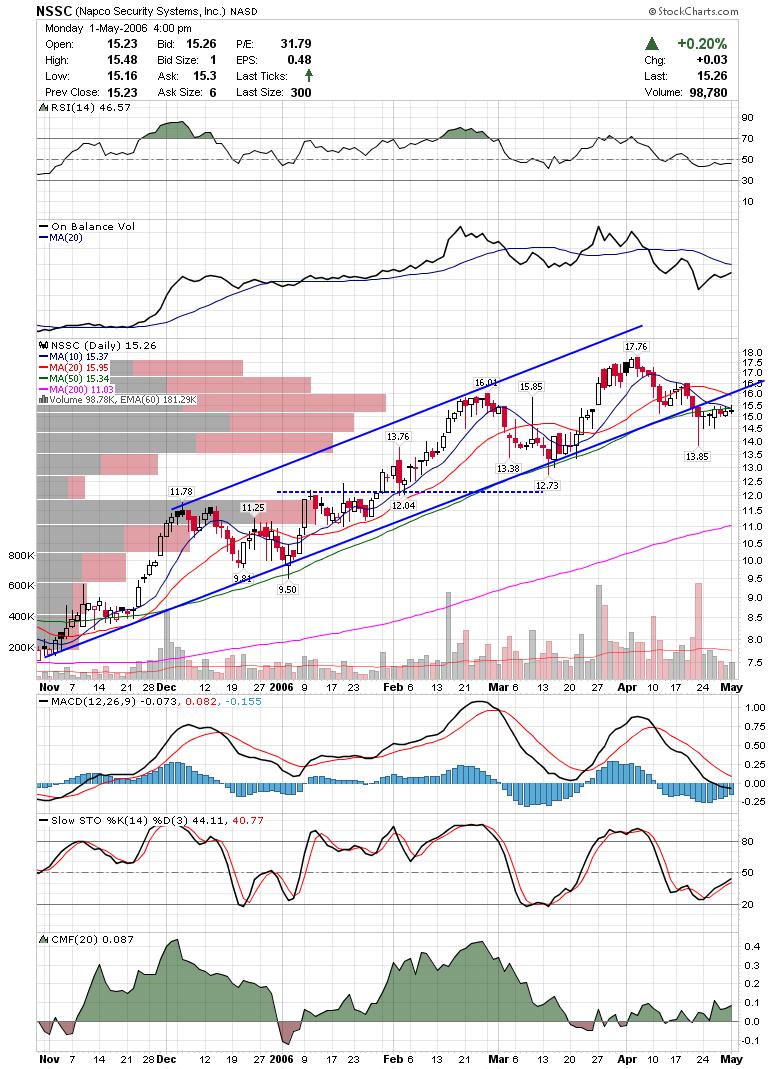
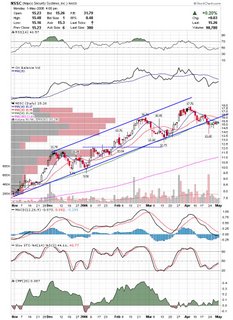
 NSSC looks like it broke out of the existing channel and is testing previous support as resistance. Could break down any day now. NSSC looks like it broke out of the existing channel and is testing previous support as resistance. Could break down any day now.
Thats it for tonight. Good Luck,
DT
Moving Time Posted by downtowntrader | 5/01/2006 09:35:00 AM | 0 comments »
I want to apologize for not posting any updates the past few days. I was moving over the weekend and the DSL was not ready. I hope to be at least settled in to the point where I can resume keeping up with the market over the next couple days. I do plan on posting some charts tonight. Good Luck,
DT
NO POSTS TONIGHT Posted by downtowntrader | 4/30/2006 10:18:00 PM | 0 comments »
Downtowntrader will not be posting tonight!
No Update Again Posted by downtowntrader | 4/27/2006 08:25:00 PM | 0 comments »
I won't be trading again tomorrow as I am still trying to resolve some other business. I don't want to post anything without being totally committed to it so I will wait till this weekend. Good Luck,
DT
No Charts tonight Posted by downtowntrader | 4/26/2006 09:19:00 PM | 0 comments »
I apologize but there won't be any update tonight. I won't be trading tomorrow as I have some business to take care. Good Luck,
DT
Trade Alerts Review Posted by downtowntrader | 4/25/2006 10:14:00 PM | 4 comments »
I have been using Trade Ideas for about a month now and all I can say is WOW. This is a great product and easily pays for itself if you know how to take advantage of it. First and foremost, I don't want to mislead anyone and tell them they will become supertraders overnight because the reality is that although this product may give you many potential trades, the bottom line is that you need proper trade management to take advantage of it. Think of this as a tool to add to your trading arsenal. More on that later.
I had tested the Pristine scanner before this one and I found it useful, but lacking in many areas and they have most of the alerts setup for their proprietary terminology. What is great about Trade Ideas is how customizable it is. You can have several different types of alerts depending on what you are trying to do and load just what you want at any given time. I am mostly a breakout and breakdown trader, so I focus on stocks making new highs and lows scans. If you are a value investor you may look for stocks near 50 or 200 smas. The options are virtually limitless.
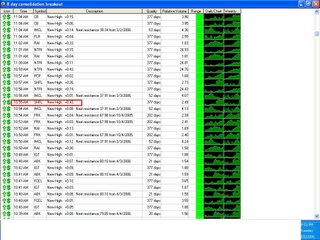
This is an example of what an alert window looks like. The alerts appear on top as they occur and scroll down as they are replaced. The columns are customizable, however I just left them as is. You can also load multiple windows at a time with different scans. I normally have a breakout, breakdown, and generic high/low window up. A side benefit to using a real time scanner is that you get a good feel for the trading sentiment by watching which scans are getting more alerts. While this window is showing a decent amount of alerts there are times when I don't see anything show up for almost an hour while my breakdown window is showing plenty of potential shorts.
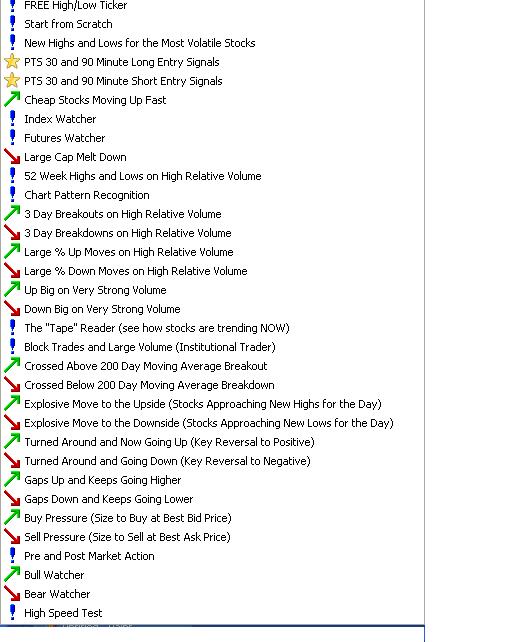
 Here are the samples that are bundled with Trade Ideas. I haven't really tested most of these because what I started using has been working so well. The 3 day breakout on high volume is a great place to start for breakout traders. Some feel the high low ticker shows too many trades, however, I like to keep an eye on it to get a general idea of the sentiment at any given time. Here are the samples that are bundled with Trade Ideas. I haven't really tested most of these because what I started using has been working so well. The 3 day breakout on high volume is a great place to start for breakout traders. Some feel the high low ticker shows too many trades, however, I like to keep an eye on it to get a general idea of the sentiment at any given time.
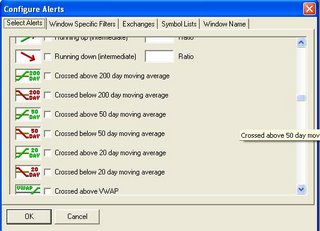
 Here is an example of some available alerts. The list is huge including candle based alerts, triangles, head and shoulders, and many others. This is where you would start to customize an Alert window. If you take any of the sample alerts above, and then go into the configure window, you could add or subtract certain criteria to the alert and then save it as a custom alert. For instance, you could change the 3 day breakout to 10 days, etc. Here is an example of some available alerts. The list is huge including candle based alerts, triangles, head and shoulders, and many others. This is where you would start to customize an Alert window. If you take any of the sample alerts above, and then go into the configure window, you could add or subtract certain criteria to the alert and then save it as a custom alert. For instance, you could change the 3 day breakout to 10 days, etc.
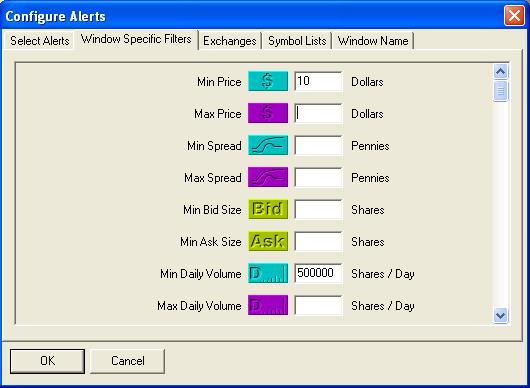
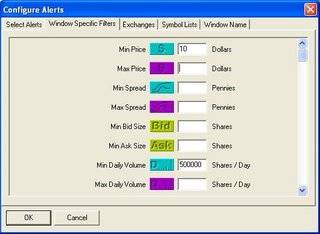
 After modifying and creating an alert, you can drill down deeper with window specific filters. This is where you can really customize the alerts to fit your trading profile. The more precise you have your trading methodology defined, the easier it will be for you to modify the alert. Below is an an example I use for daytrade alerts. I prefer stocks with a minimum price of 10 dollars and average daily volume of 500,000 shares. After modifying and creating an alert, you can drill down deeper with window specific filters. This is where you can really customize the alerts to fit your trading profile. The more precise you have your trading methodology defined, the easier it will be for you to modify the alert. Below is an an example I use for daytrade alerts. I prefer stocks with a minimum price of 10 dollars and average daily volume of 500,000 shares.
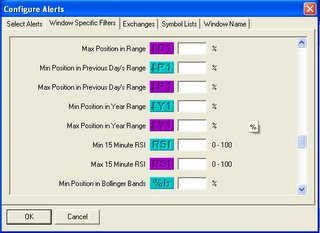
 After the basic criteria, you can input a myriad of other options including bollinger band position, RSI, position in trading range, etc. These are very valuable parameters and they allow you to come up with some very high quality scans. After the basic criteria, you can input a myriad of other options including bollinger band position, RSI, position in trading range, etc. These are very valuable parameters and they allow you to come up with some very high quality scans.
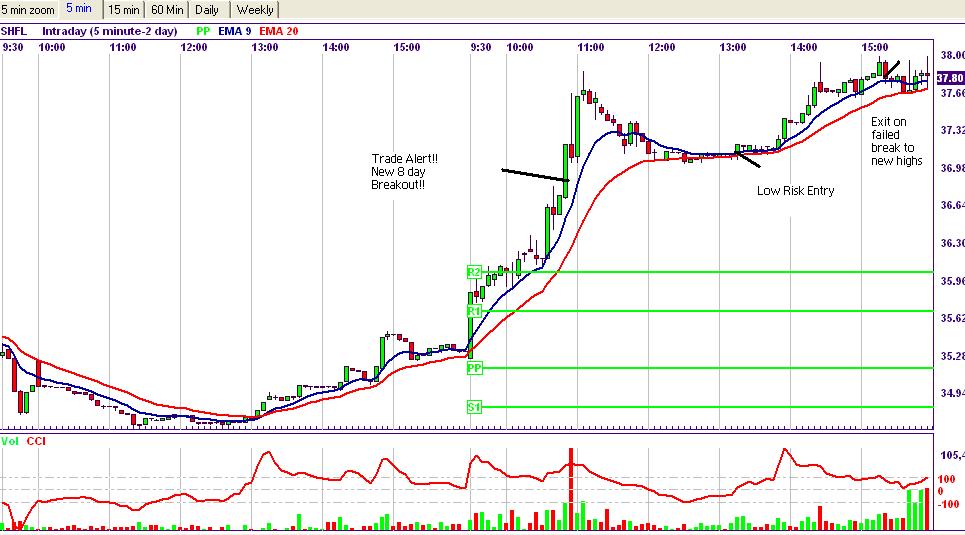
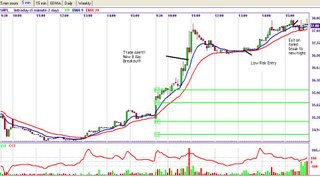
As I mentioned before, a real time scanner is a great tool to have especially when nothing is happening with your watchlist. However, it is important to note that proper entry and exit is still very important. What I find myself doing each morning and afternoon is watching the scanner for possible trades. As they scroll by I check the 5 and 15 minute charts and very important, the daily chart. If it looks good on the daily chart but I have missed a good entry I add the stock to a ticker and then watch the stocks that make it to the ticker for good entries. The fact that they are on my ticker means that they have already broken out or broken down based on my scan and therefore, if a decent entry is available, then the trade should be taken (of course taking overall market conditions into account). Here are two examples of trades I took today based on a Trade Ideas scan.
I didn't take this trade till after lunch even though the alert came through at 10:55 for various reasons (See Alert Window at beginning of this post). I added it to my ticker and after lunch I noticed it make a higher candle high after and ABC pullback and decided that it was a safe entry with a decent chance at testing prior highs. This trade had roughly a 7:1 risk reward ratio. As you can see if worked out very nicely.
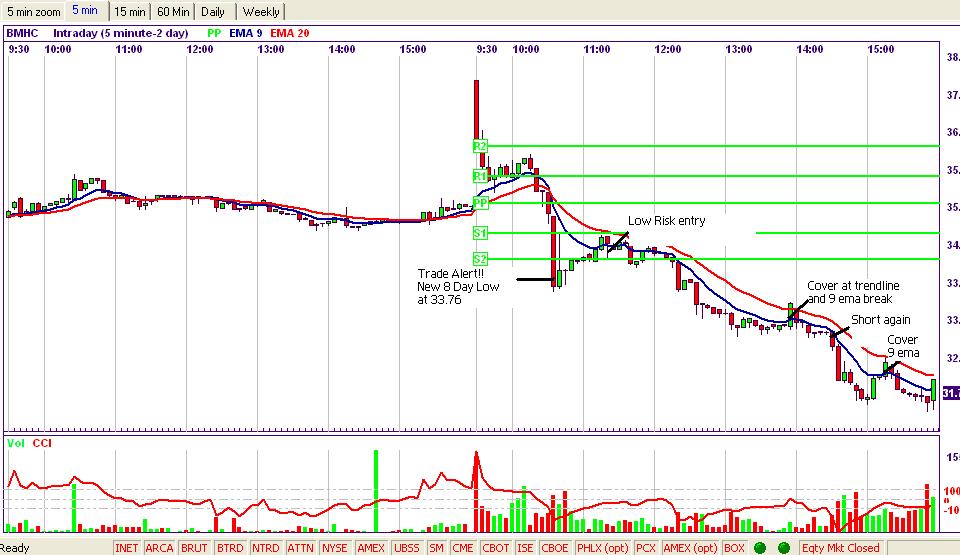
 BMHC alerted mid morning today. By the time it alerted (based on an 8 day low), it was too late to enter. However, after forming a nice bear flag into resistance, it afforded a very nice entry. I covered when it looked like it would break a trendline I had and after it took out the 9 ema. A few bars later, it broke down again for another decent short. BMHC alerted mid morning today. By the time it alerted (based on an 8 day low), it was too late to enter. However, after forming a nice bear flag into resistance, it afforded a very nice entry. I covered when it looked like it would break a trendline I had and after it took out the 9 ema. A few bars later, it broke down again for another decent short.

The important thing to note here, is that just cause it came up on the scan, doesn't mean it is an automatic trade. Even with a high quality scan, most alerts are not tradeable immediately.
Also, this product is not just for daytraders. I have been testing it out for swing trades by using it for picks in the CNBC Squawk Box trading contest. While I'm not anywhere near the lead, I didn't expect to be as you need to take foolish risks and use no diversification to win one of these things. However, I am up and have not experienced any significant drawdown.
Another benefit to using a product like this is that it allows me to focus purely on the technicals specific to a trade removing any bias I may have. Sometimes we see the perfect swing setting up and we are tempted to enter early on our expectations. With the scanner, if you see an alert, that means the conditions have already been met. The less emotions involved the better you will trade.
To summarize, I love this product. It provides me with hundreds of potential trades daily.
If you are interested in Trade Ideas, please sign up through my
Feel free to email me for the details on my custom scans if you sign up through my link and need help.
Sorry but there are no charts tonight due to the length of this post.
Good night,
DT |
|
|
 [复制链接]