- 金币:
-
- 奖励:
-
- 热心:
-
- 注册时间:
- 2006-7-3
|
|

楼主 |
发表于 2009-3-19 16:41
|
显示全部楼层
Dow near 12K Posted by downtowntrader | 3/05/2007 10:17:00 PM | 5 comments »
The Dow seems to be bearing in on the 12,000 mark which is a nice round number that could offer up some near term support. I've been noticing the talking heads on CNBC and Bloomberg saying that this is a good buying opportunity and that this is a little bump in the road. This makes me even more cautious of any bounce due higher. It is still up in the air as to whether this is a correction or a change in primary trend, but either scenario should result in much lower prices ahead. Things have moved very quickly and it is getting difficult to find any decent shorting candidates in my opinion, so hopefully there is a bounce soon. There may be some interesting long opportunities if the markets gap lower in the next day or two and exhaust the sellers. At this point, the safest thing to do is wait it out.
I added a few new blogs to the blog roll tonight. For those that haven't checked out TyroTrader or Tradewhileworking, please do so. Tyro has been posting some great stuff recently, and Tradewhileworking really caught my eye as a guest blogger on Fly this weekend.
I also want to introduce a new blogger to the trading blog community. Tuff is a good friend of mine and has been a guest blogger for me in the past. He just started his own blog titled Regulation FD. He will be focusing on discovering inefficiencies in the markets which can be exploited by becoming the "smart" money. We will be trying to collaborate on some posts between the two blogs in the future, but our core missions are quite different. His first analysis on the blog shows the kind of research and thought that goes behind his stock selection process. And trust me, this is just the tip of the iceberg with this guy. He asked me to post a technical overview of his first company profiled, which happens to be Hurco Companies.
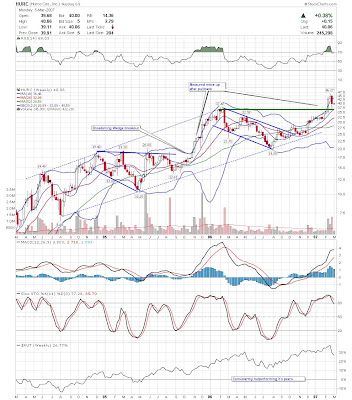
Hurco Companies, Inc. (Public, NASDAQ:HURC)
A daily chart for HURC follows below. While HURC has been on a tear recently, and has weathered the correction fairly well, I can't get all that excited about it here because of the state of the market. It could hold here at the rising 20sma, but my gut is telling me it will have an ABC correction with only the down A wave complete here. I would guess that the rising 50sma and lower bollinger band will be tested, which may offer a great entry depending on the market condition at that point. A couple of things that stand out to me here is the nice increase in volume recently, and the fact that the indicators are in synch.

Here is a weekly chart showing a much cleaner perspective. HURC is clearly above resistance and not too far from its highs. This is actually a pretty clean chart without to many surprises. I really like how HURC has been outperforming its peers as shown by the Price Performance line for HURC vs the Russell.
On a lighter note, I've noticed a few bloggers (Jaime, Mike, Estocastica, Trader-X, Howard) out there posting their top 20 movies, so I thought I would throw mine out there. In no particular order.
Braveheart The Usual Suspects Dances with Wolves Godfather Saving Private Ryan City of God Snatch The Sixth Sense Matrix Trilogy The Gladiator Donnie Brasco Heat Shrek 1 and 2
Meet Joe Black Interview with the Vampire Traffic
Reservoir Dogs The Royal Tenenbaums Blow - Gangs of New York
Babel and The Departed are two recent movies that may make the list after I rewatch them at home.
I had a few Pitt/TraderX movies on the bubble that didn't make the cut including Fight Club, Legends of the Falls, and Seven. You can practically exchange any of these with Joe Black, but I thought Hopkins was awesome in that. So there you have it.
Comments are welcome and if any readers want to post in the comments section I would love to see your lists.
Good Luck,
Joey
Plunge Continues Posted by downtowntrader | 3/04/2007 10:56:00 PM | 0 comments »
The bears resumed the attack on friday as most of the indices closed near the lows of the week. Regardless of the reason, whether it be fears of recession, global slowdown, or carry trades unwinding, the bottom line is price is falling across the board. Watch the charts and ignore the chatter. While the indices can expect a bounce soon, it may still be a few days away. Looking back at the start of the May decline, the indices dropped about 12 days without any sort of bounce. We are only 5 days into this leg down if you count Monday. Here is a chart showing the May drop on the Q's.

While we could bounce sooner then that, I don't expect anything more then a small retrace. There were too many people hurt with this drop, and it will take time to heal those wounds.
I'm looking to short this market, but it is difficult to find weak stocks that haven't run away yet. I don't like picking tops in strong stocks, so I am looking for stocks that tried to bounce back but are falling under their own weight. UTEK, NVLS, and IT come to mind. I'm also looking at stocks like UA, CHS, PSS, and AEOS in the retail sector for weakness. Sorry for the lack of charts again, but my free time is all tie up with a couple projects I am working on.
Good Luck,
DT
mobile blogging Posted by downtowntrader | 3/01/2007 09:12:00 PM | 0 comments »
I'm writing this from my phone so hopefully it posts ok. the markets
gapped down hard today in a move that was begging to be faded. while
most indices closed red, they closed far above the lows of the day. I
will take advantage of any strength in the next few days to scale out
of any remaining short term trades I have. It looks like there is
still a lot of room to move down here, so hopefully some low risk
shorting opportunities present themselves. I won't be home till much
later so there won't be a regular post tonight. good luck, DT
Weak bounce Posted by downtowntrader | 2/28/2007 07:43:00 PM | 0 comments »
The markets looked like they were poised for a strong bounce early this morning but fizzled out fairly quickly. None of the indices could even muster a 1% gain today which doesn't bode well for bulls. I took opportunity to reduce exposure in some positions, but I also started to put on some guerilla type trades on as well. These are pseudo daytrades, lasting anywhere from intraday to 2 days. I don't know if the markets will continue this dead cat bounce or rollover right here so I am preparing for both. Ideally, we either continue bouncing higher, or have at least one more narrow range day in order to allow for less risky shorting.
Since I am preparing for two scenarios, I am going to highlight what I am looking for in individual equities.
The first play is if there is more left to this bounce. I am looking for stocks that are on their lower bollinger bands with oversold indicators. I then look for a narrow range or hammer type candle that I can use to trade off. FDO below is a good example. It is clearly oversold, and had a nice narrow range day today. If the general market is behaving appropriately, and FDO trades above todays high, then I think the odds favor a long position. The target on these types of trades is fairly aggresive, near the 9ema for a partial sell and middle band to close the position. This is a little risky in this environment, but the tight stop may make up for it. This type of play should not be treated as anything other then a long scalp.
 The second play is to hope for some consolidation in order to allow weak stocks to catch up to declining moving averages. This is more of a swing entry, depending on the market environment. With the indices oversold already, I will be looking to keep these fairly tight as well. AEOS is a good example of a stock that is retracing it's way higher to declining moving averages. It is also below a trendline that has held for months. In an ideal world, it would trade sideways to higher for a few more days. The second play is to hope for some consolidation in order to allow weak stocks to catch up to declining moving averages. This is more of a swing entry, depending on the market environment. With the indices oversold already, I will be looking to keep these fairly tight as well. AEOS is a good example of a stock that is retracing it's way higher to declining moving averages. It is also below a trendline that has held for months. In an ideal world, it would trade sideways to higher for a few more days.
One thing to keep in mind is that I'm putting these out there as ideal scenario type trades, and more then likely, the market will not be so easy to follow. If the opportunity is not present, then I will sit on my hands. I will wait for the dust to settle before commiting any longer term money to any positions.
Good Luck,
DT
Bears Growl Posted by downtowntrader | 2/27/2007 09:47:00 PM | 1 comments »
The bears took the markets down hard today. The blame fell on the Chinese drop overnight and possibly on the Cheney bomb attempt, but in reality, these markets have been due a correction for quite some time now. Days like today are a swing traders nightmare because you are holding positions overnight, mostly weighted to the general trend (up until today). I took a beating from the premarket on, although I think I did a fair job of maneuvering my way around some stocks. I also saw some really weird stuff happening today on NYSE stocks, as others reported seeing too(Kevin, JC, Bill). I was watching MR as it dropped 65% to $10 and then pop back up to $25. There were a few trades down there and I even tried buying some, but the ask was stuck at 24.50. Now, it is showing the low of day as 21.11. I saw crossed bids, stickies, market orders not filling. All the sorts of things you can expect to see when a system is overwhelmed with volume. So what happens next? I can't pretend to know, but I have to think that an intermediate, if not a primary top is in.
If you think about the psychology behind a top, there are a lot of people that were hurt with todays drop. They will be itching to get out on any bounce that occurs in the next days and weeks. This should cause a supply imbalance, absorbing any buying. I don't know if the markets bounce immediately here, or if they follow through tomorrow, but I can't fathom institutional money aggresively buying here. I think the best course of action for swing traders is to sit tight and manage your open positions as best you can. There should be a low risk buying or selling opportunity soon. Daytraders should find the increased volatility refreshing, and I even bought a couple things today, looking to fade the panic selling. Should be an interesting day tomorrow to say the least.
Good Luck,
DT
Gotta love Microsoft Posted by downtowntrader | 2/26/2007 09:02:00 PM | 4 comments »
My trading PC blue screened on me yesterday and wouldn't even boot up this morning. I spent all day downloading drivers and reinstalling programs. All this and I still have all sorts of problems. I may have a hardware issue at this point which would really be a pain in the @#$. Needless to say, I wasn't able to track the markets today and won't be able to do any research tonight. This will keep me on the sidelines tomorrow as well. At least I had some open positions move well today. Hopefully I can resolve these PC issues tonight.
Good Luck,
DT
Large Caps at support Posted by downtowntrader | 2/25/2007 10:49:00 PM | 1 comments »
The Dow and S&P500 have pulled back to their rising 20 day sma's and could be ready to move higher. It is interesting how there has been a disconnect with the Nasdaq and Russell recently. When the large caps were making new highs recently, the Nasdaq was threatening to break down. Then last week, the Nasdaq, led by seminconductors, decided to move higher while the large caps drifted back. Now, the large caps seem ready to bounce, as the Nasdaq and Russell are getting extended. Interesting action to say the least. Here are a few charts I found interesting this weekend.
Empire Resources, Inc. (Public, AMEX:ERS)
ERS has a high flyer last year and has had a steep correction. It has attempted to end the correction a few times, but there were still too many sellers. It takes time to build a proper base, but it looks like ERS is close to attempting another breakout.

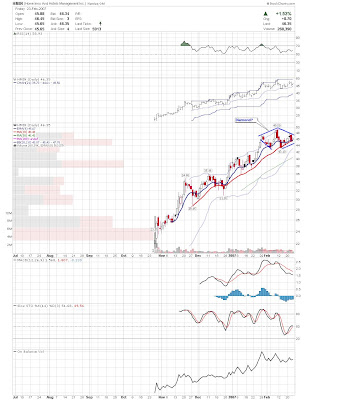
Home Inns & Hotels Management Inc. (ADR) (Public, NASDAQ:HMIN)
I can't say I've traded diamonds often, as they are hard to find. Often times, a diamond is really part of a larger pattern. While this may not be a text book diamond, it looks pretty close to me. Either way, it looks like this is a continuation base regardless of how it is labeled.
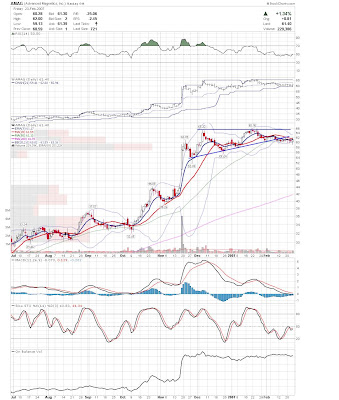
Advanced Magnetics, Inc. (Public, NASDAQ:AMAG)
AMAG may have a false breakdown here which could leave to a powerful move higher.
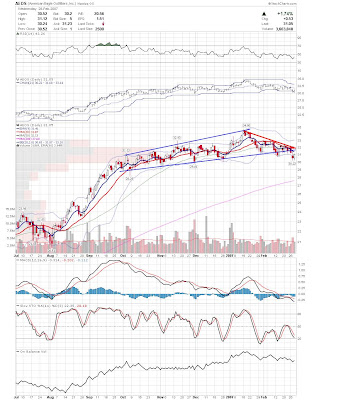
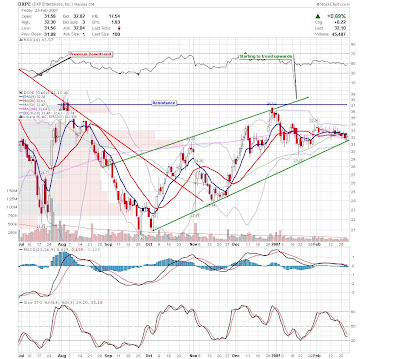
DXP Enterprises, Inc. (Public, NASDAQ:DXPE)
I've mentioned DXPE a few times as potentially resuming the uptrend, and it has basically drifted sideways. It is close to do or die time here, so it is worth watching to see if it breaks out.
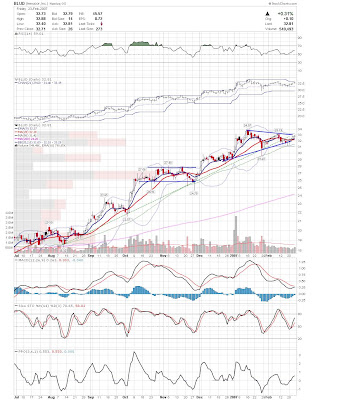
Immucor, Inc. (Public, NASDAQ:BLUD)
BLUD is also close to do or die time, as it needs to either get back over the ascending trendline or possibly continue the corrective phase.
Rambus Inc. (Public, NASDAQ:RMBS)
RMBS is looking pretty decent to me, as it is trading a very narrow range while drifting to the 20sma.

The Estee Lauder Companies Inc. (Public, NYSE:EL)
EL looks like it begun to break out of this tight bull pennant base and then pulled back and succesfully tested it as support. I will be watching for a continuation move here.

Good Luck,
DT |
|
|
 [复制链接]


