- 金币:
-
- 奖励:
-
- 热心:
-
- 注册时间:
- 2006-7-3
|
|

楼主 |
发表于 2009-3-19 17:42
|
显示全部楼层
Volatile Session Posted by downtowntrader | 9/19/2006 09:24:00 PM | 1 comments »
Today was a pretty volatile session with most of the indices pulling back pretty hard and then reversing pretty strongly off their 20 day sma's. There were plenty of wild moves on stocks as well, leaving doji's and spinning tops all over the daily charts. I can only imagine that tomorrow may get wild, although if i remember correctly, the last two fed release days have been positive in the morning leading up to the announcement. The bulls showed some resolve today and although everything is overbought, the bulls could make an assault tomorrow on alltime high territory on the Dow and May highs on the SP500. I still believe that buying here is pretty risky but I am giving my long positions a little more room to run.
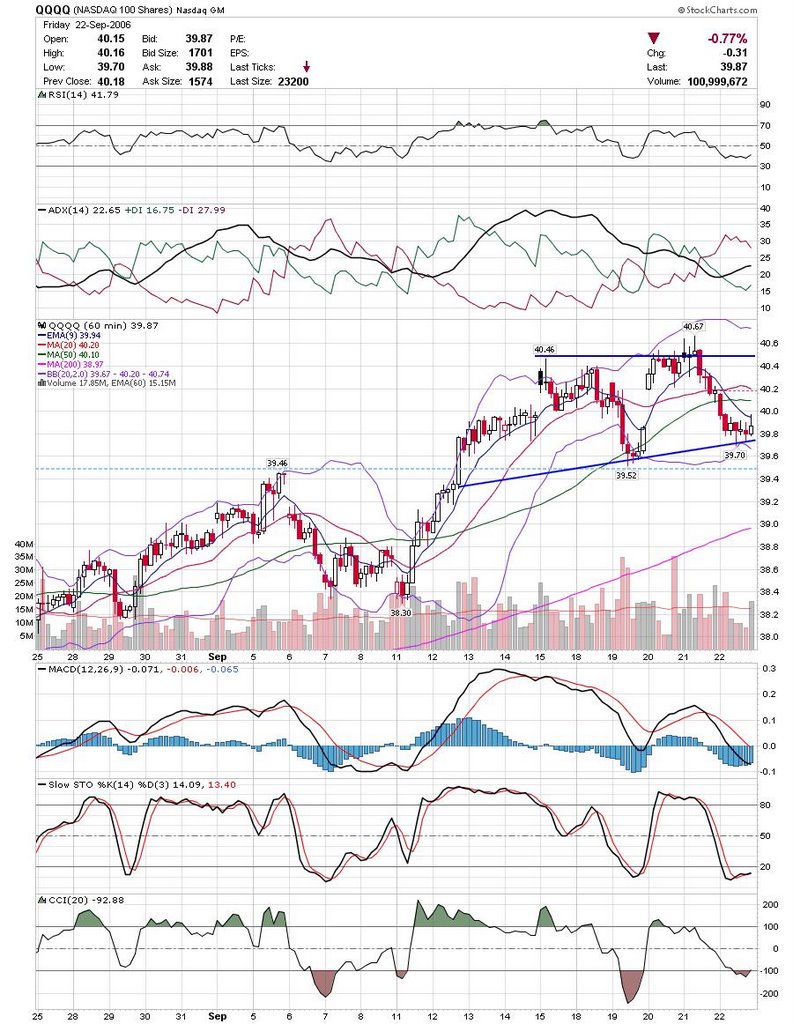
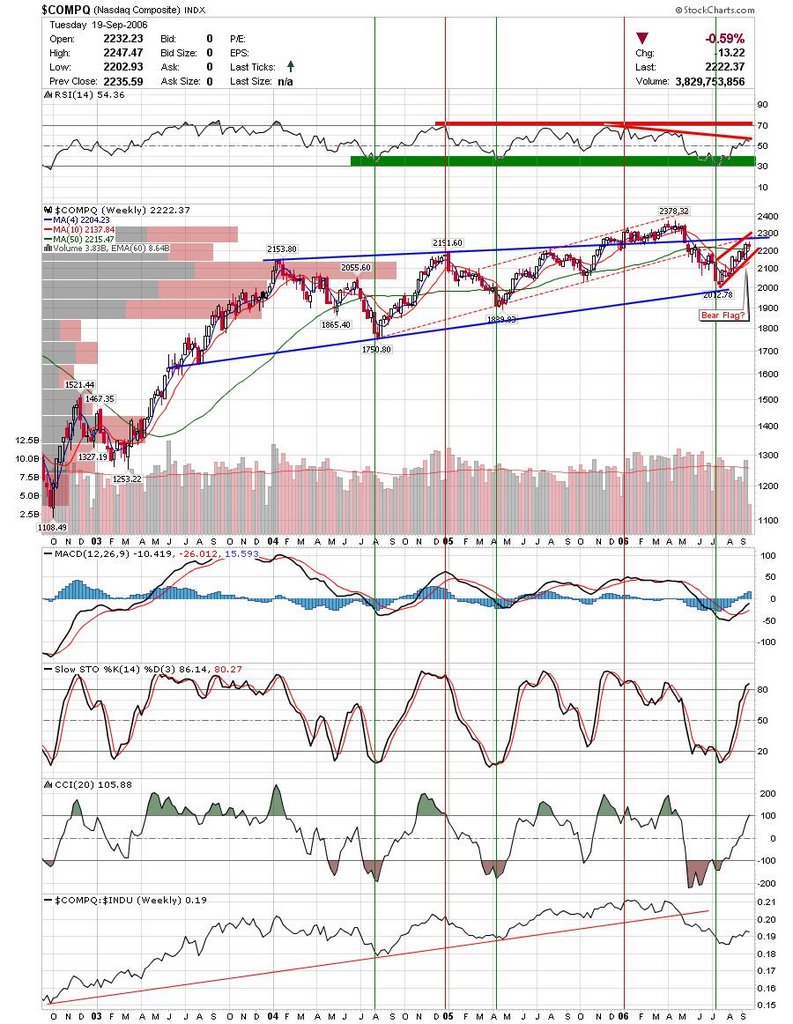
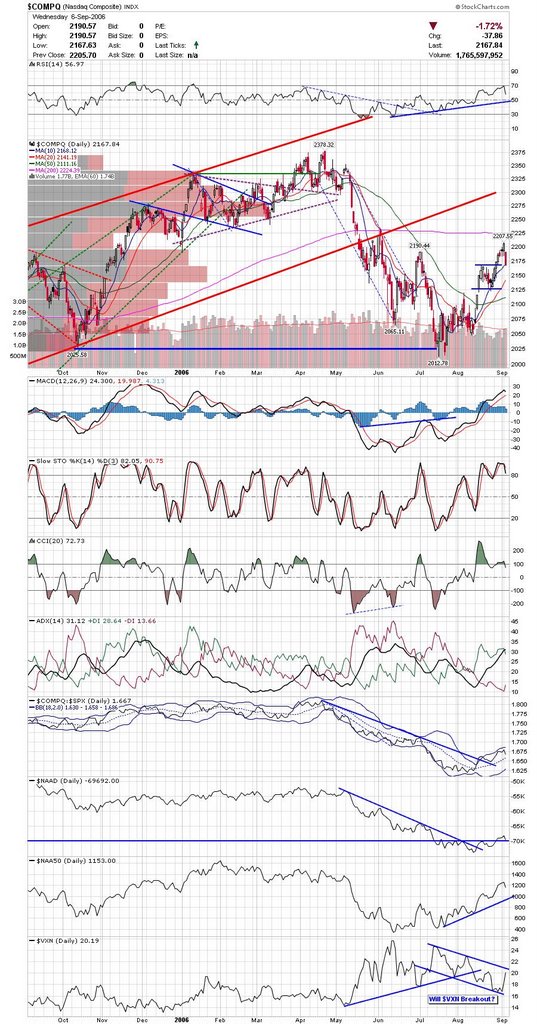
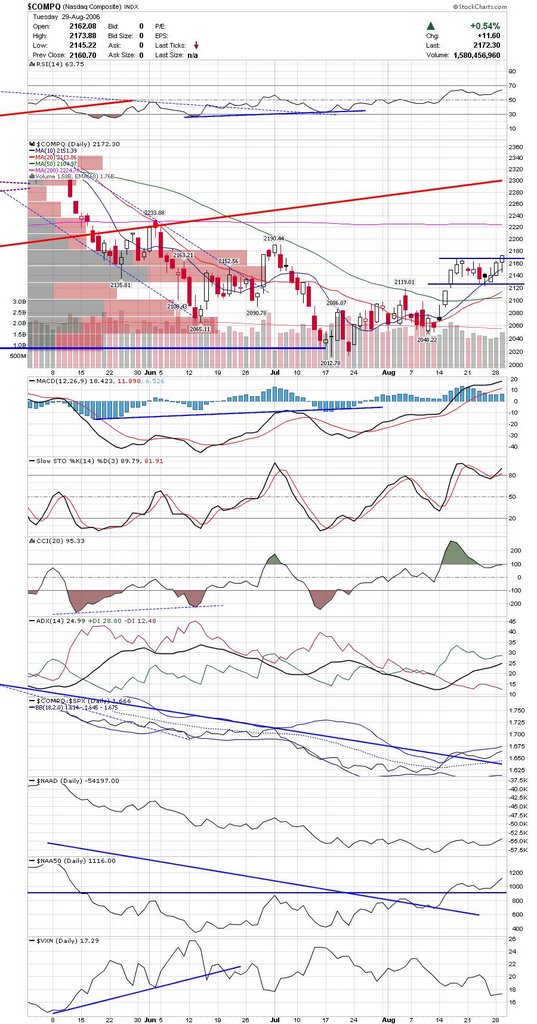
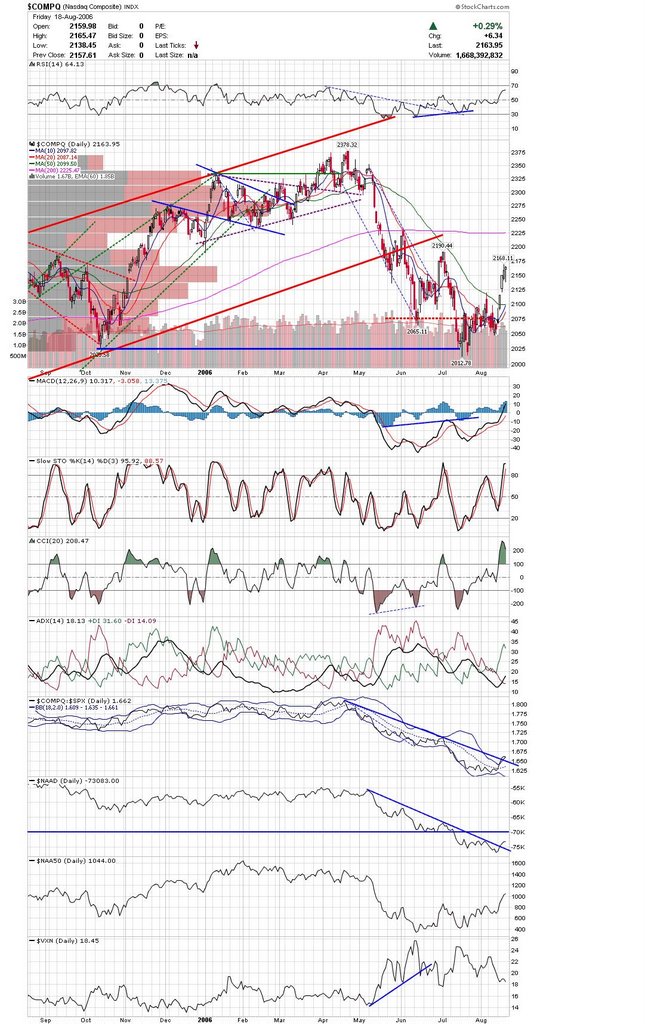
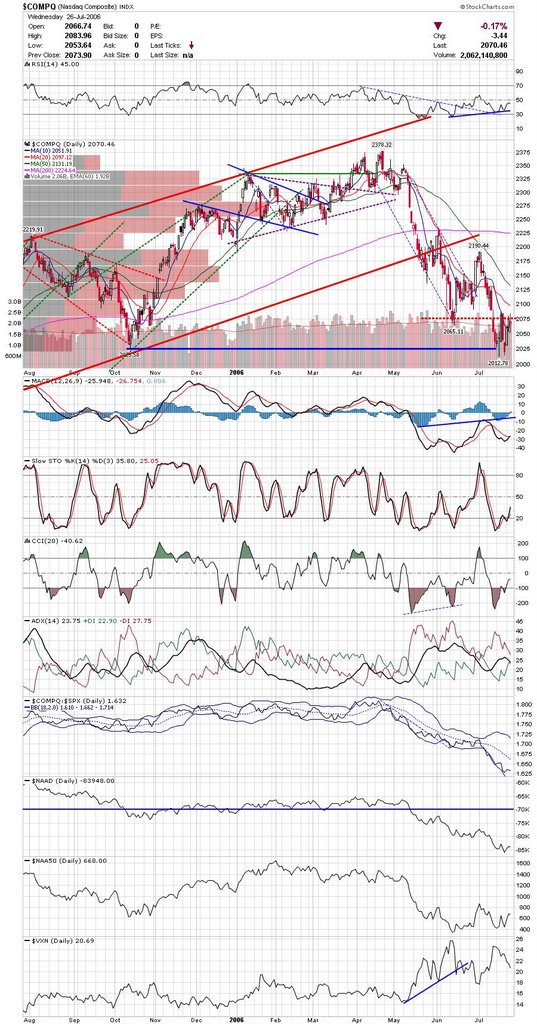
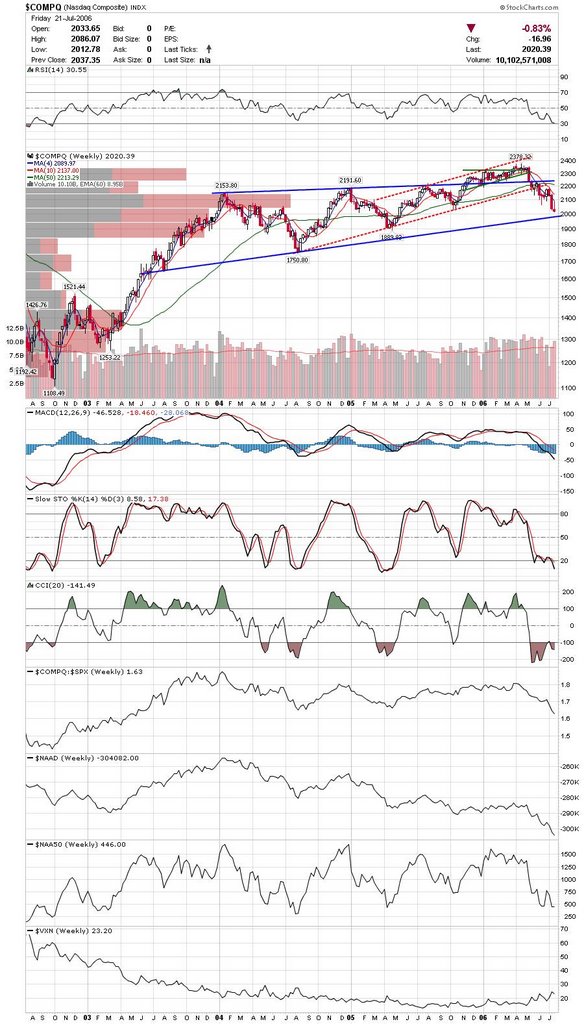
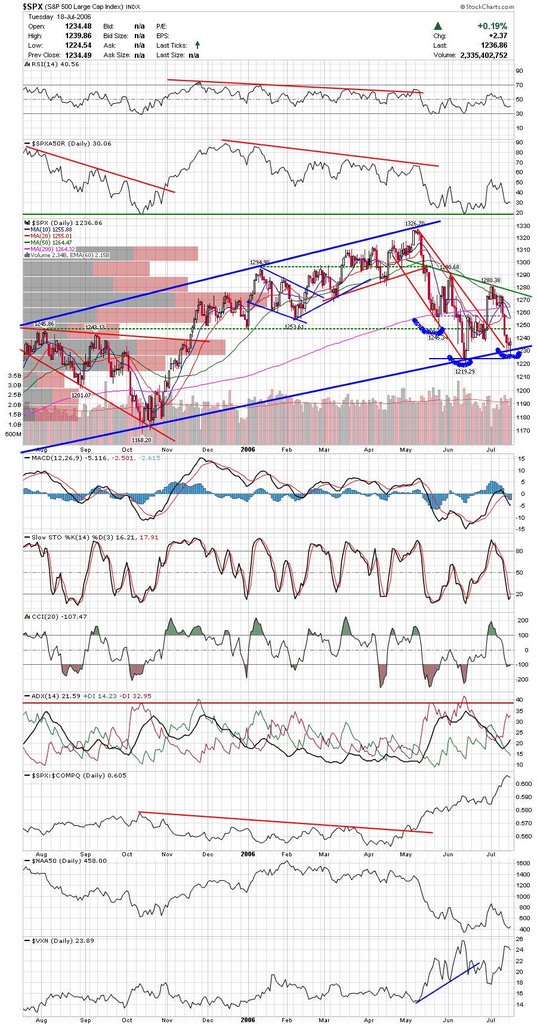
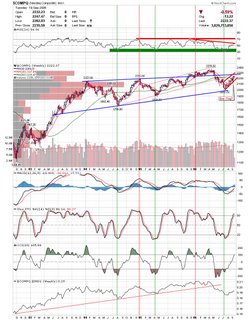
Here is a weekly chart of the Nasdaq Composite. It is up to what could amount to formidable resistance and may be forming a bear flag.
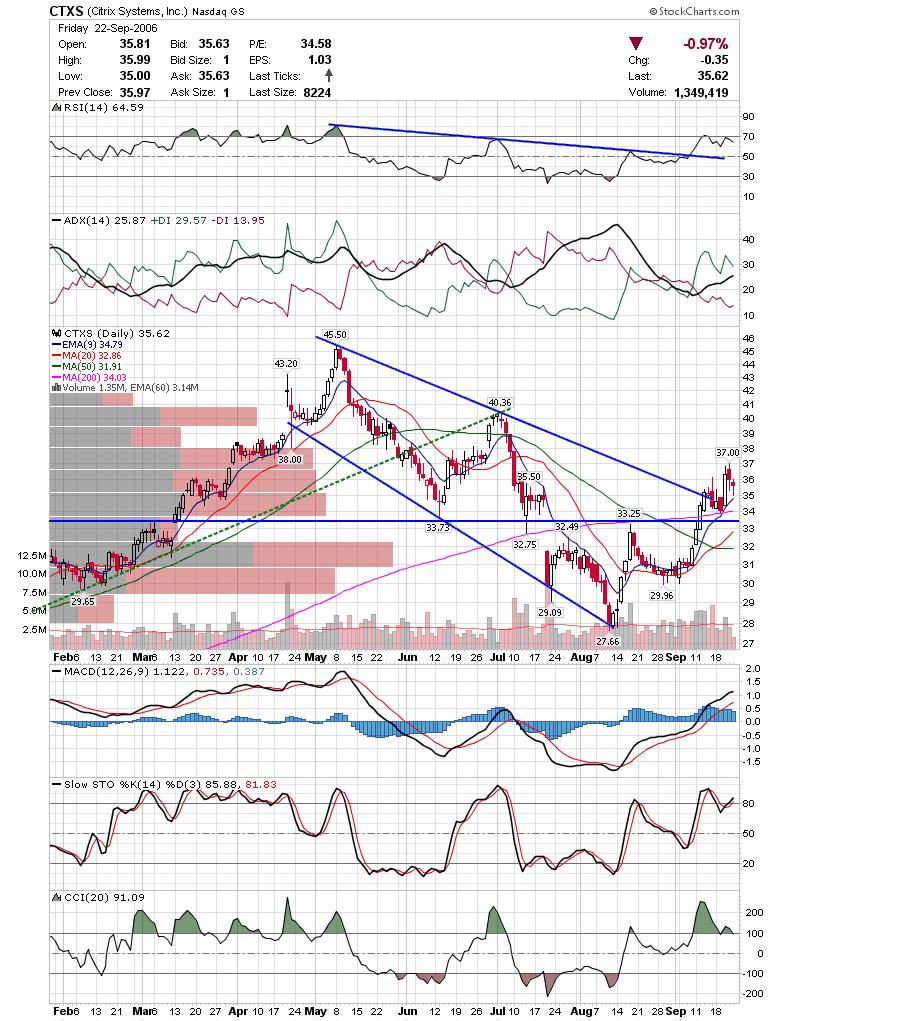
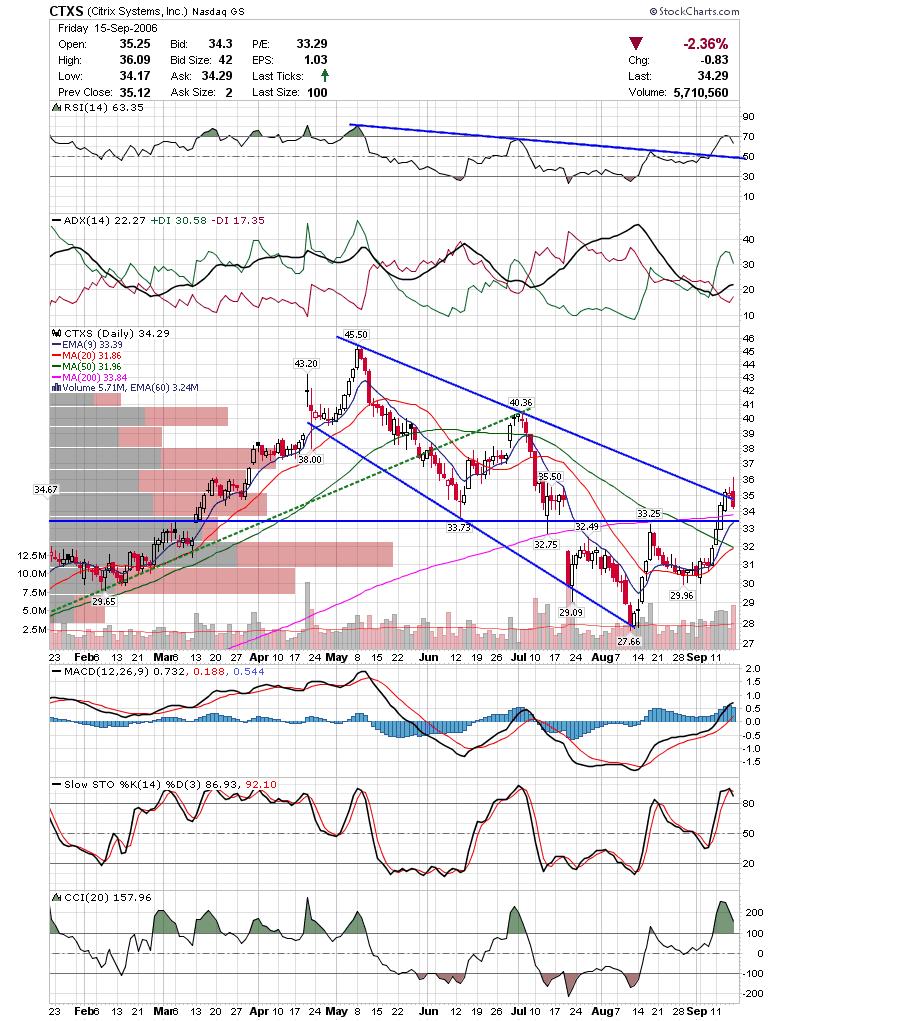
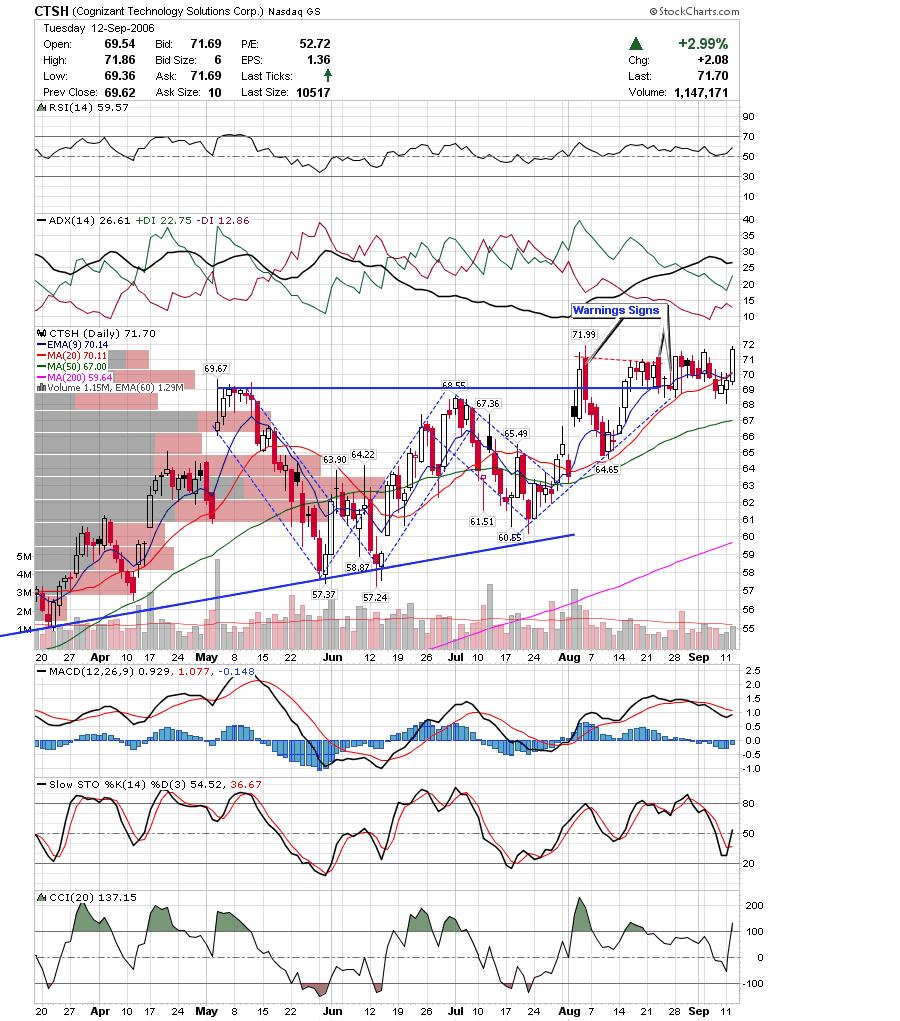
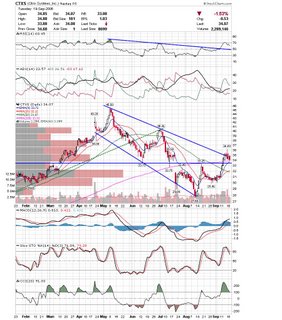
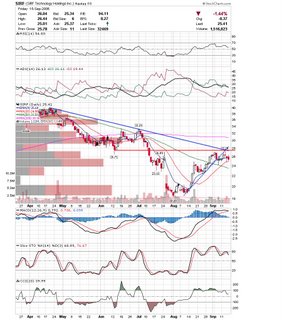
 CTXS was highlighted on Sundays update and is starting to drift down a little. If it loses the 200sma tomorrow, then it should drop fairly quickly to the 20sma. CTXS was highlighted on Sundays update and is starting to drift down a little. If it loses the 200sma tomorrow, then it should drop fairly quickly to the 20sma.
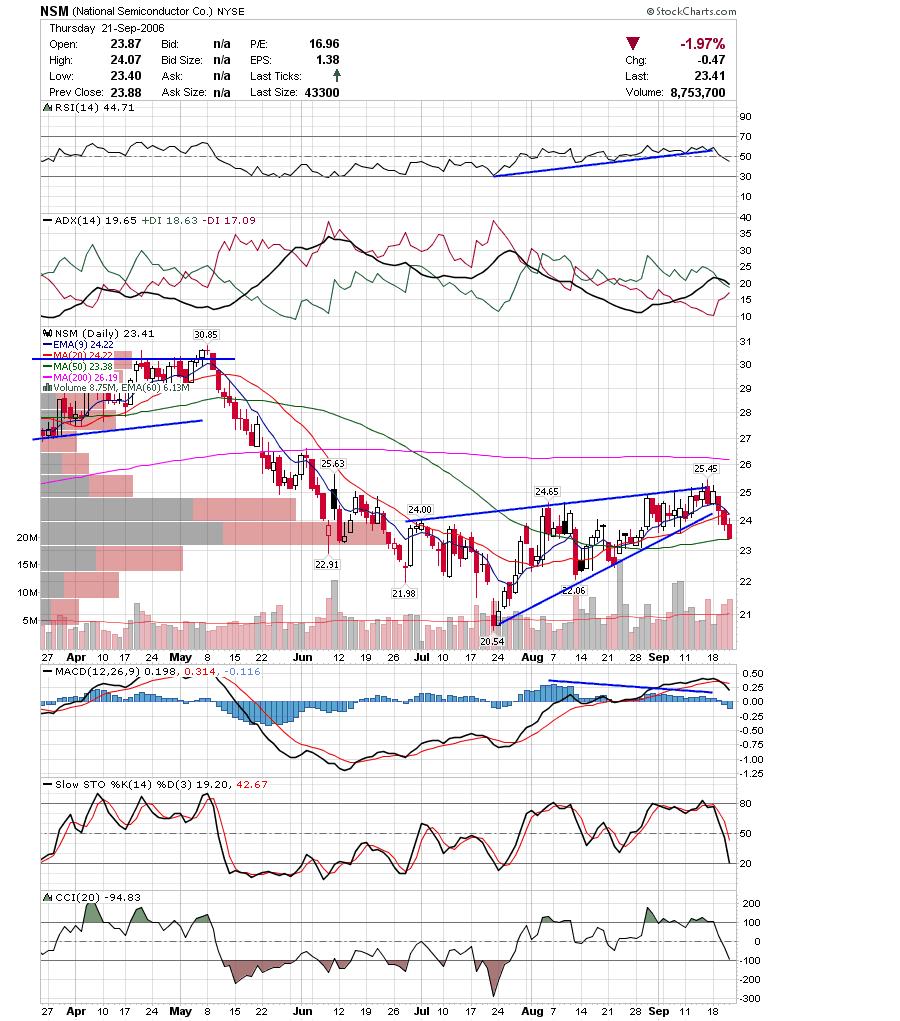
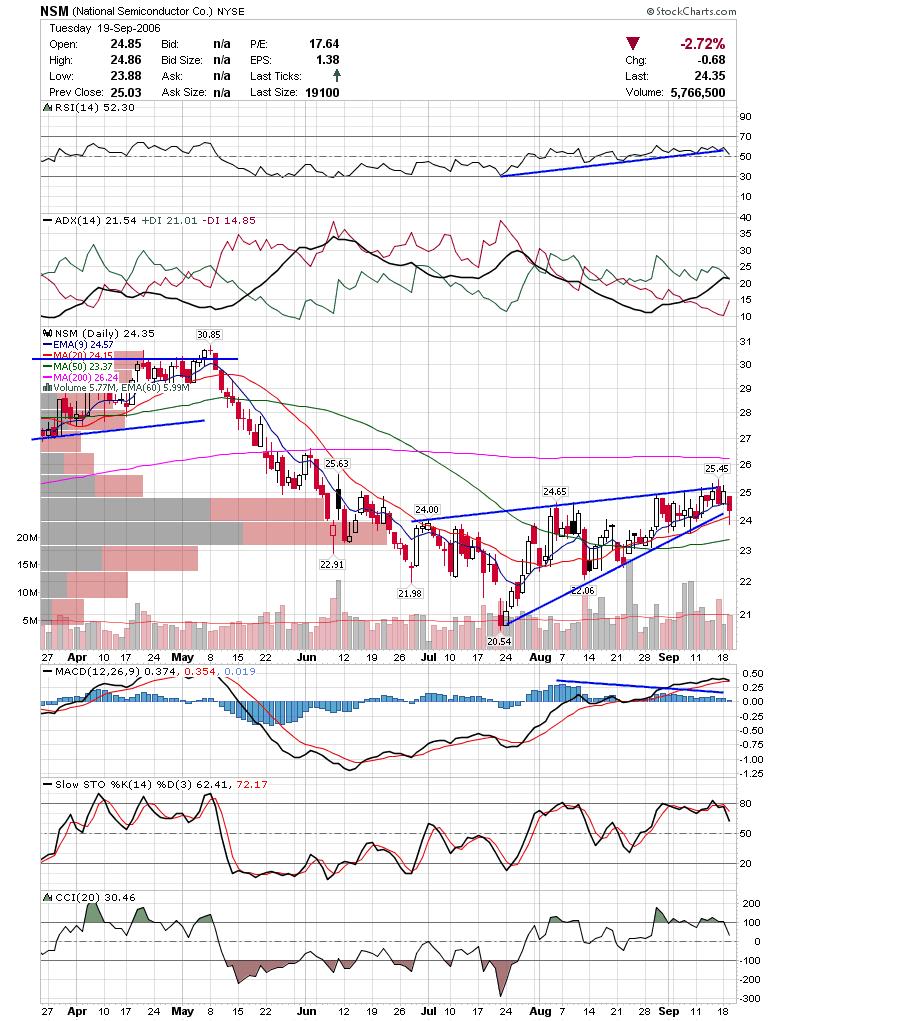
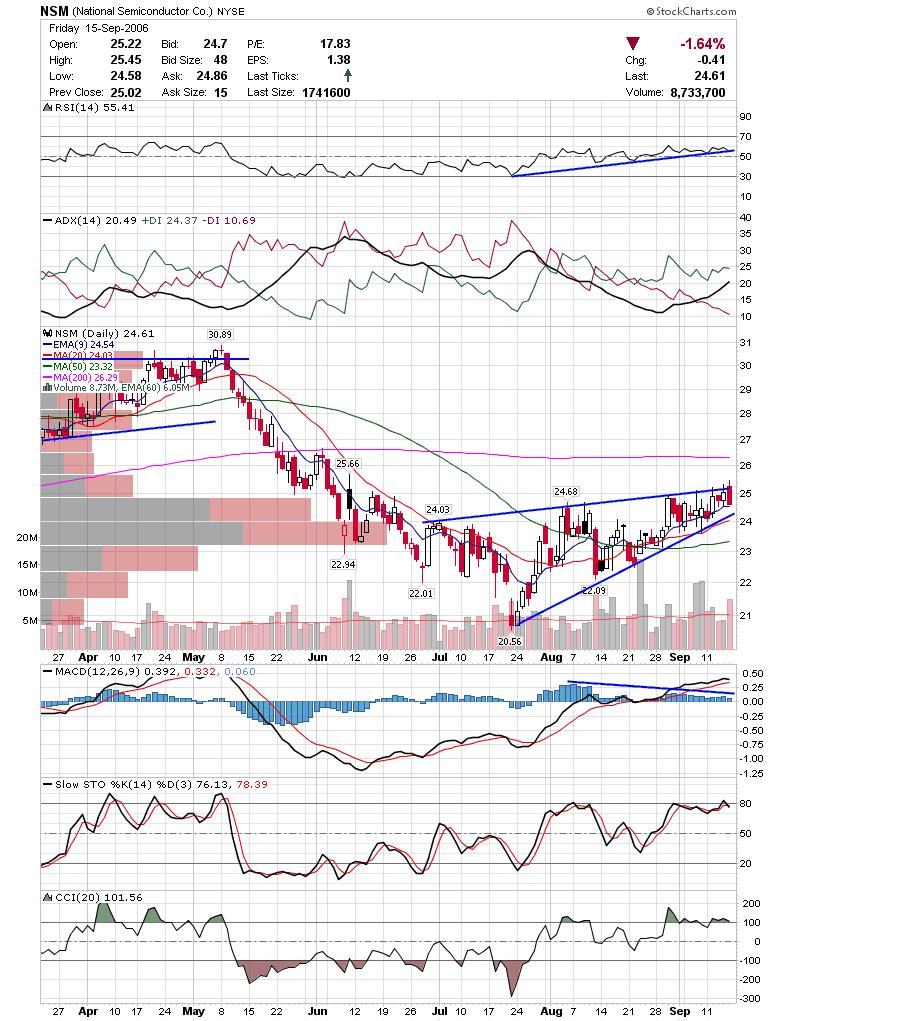
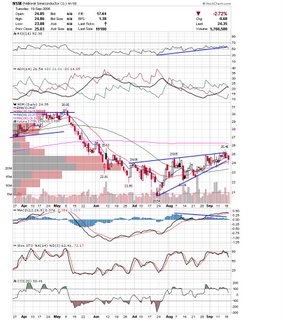
 NSM fell out of the wedge today but closed well. The indicators are softening from an overbought level, so this may drop more. NSM fell out of the wedge today but closed well. The indicators are softening from an overbought level, so this may drop more.
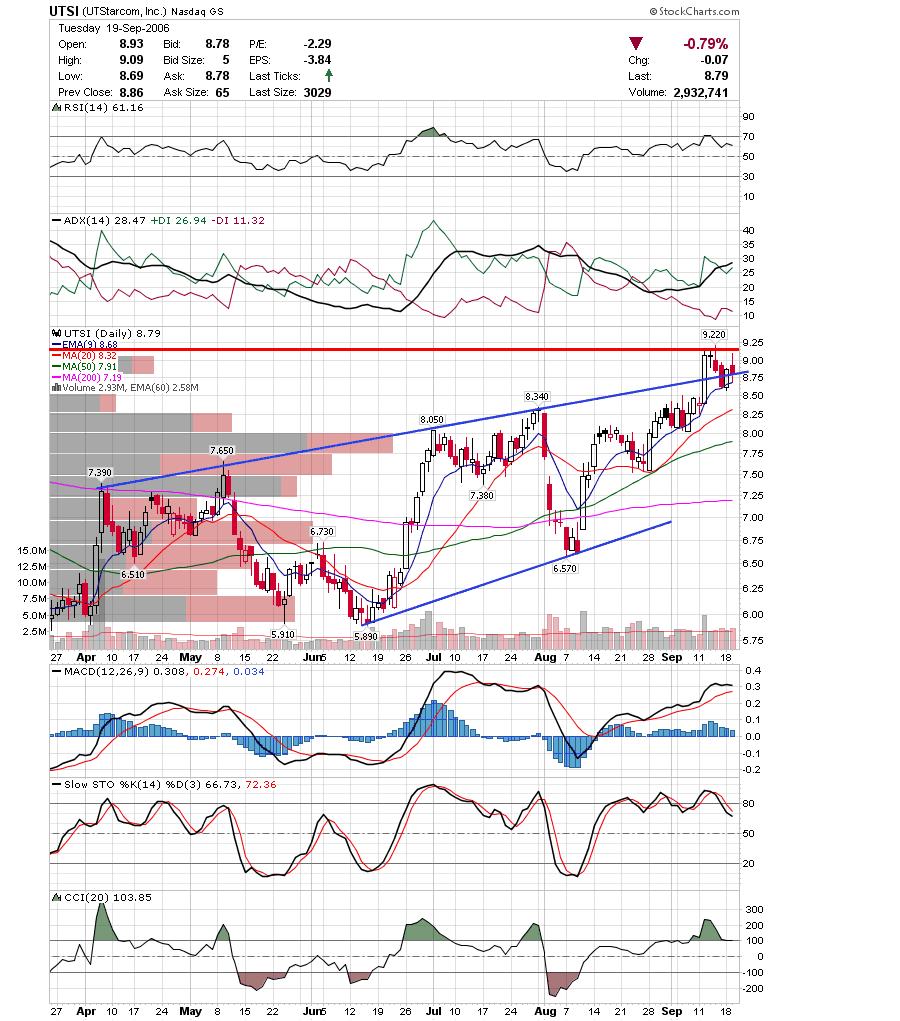
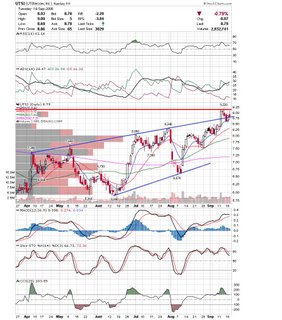
 UTSI was highlighted on Pristine's chart of the week column this week. Usually, these bomb out as a lot of rookies play these stocks, and I notice that the pop gets faded. However, after triggering on their system, and pulling back as expected, it held up without making the lower low. If it can clear the resistance above, it should make for a nice move. UTSI was highlighted on Pristine's chart of the week column this week. Usually, these bomb out as a lot of rookies play these stocks, and I notice that the pop gets faded. However, after triggering on their system, and pulling back as expected, it held up without making the lower low. If it can clear the resistance above, it should make for a nice move.
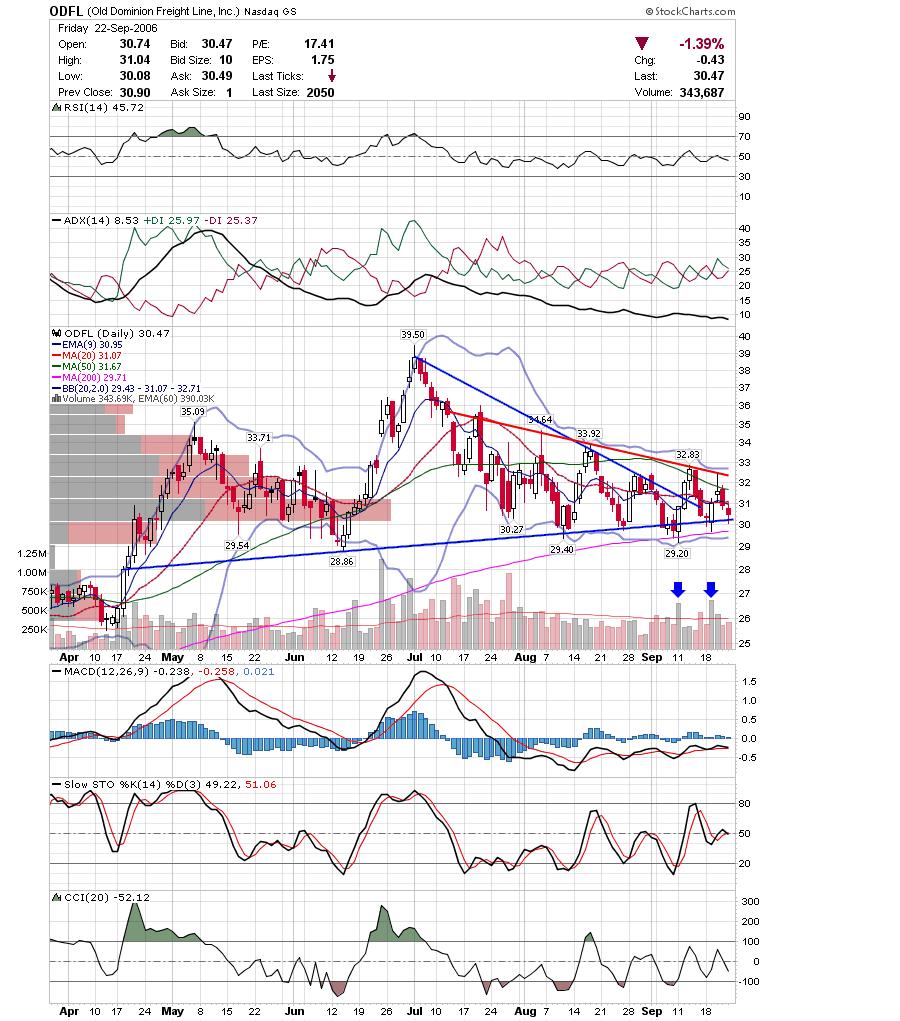
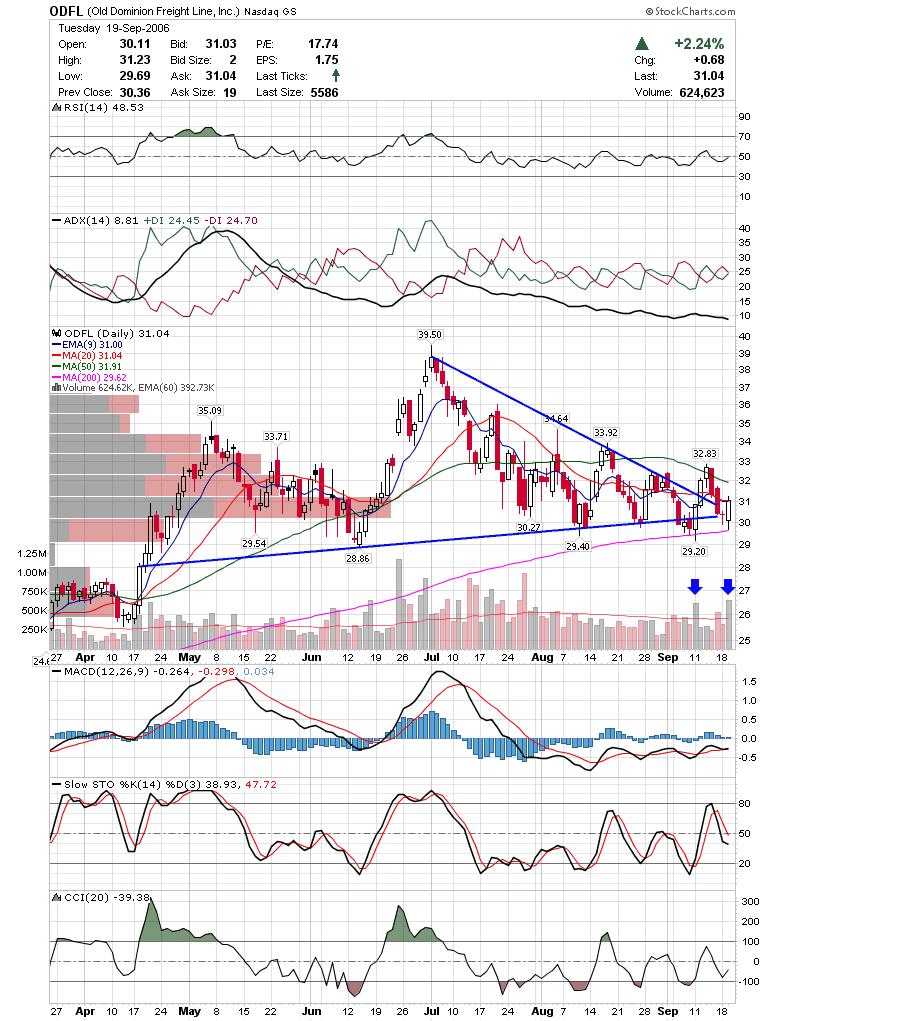
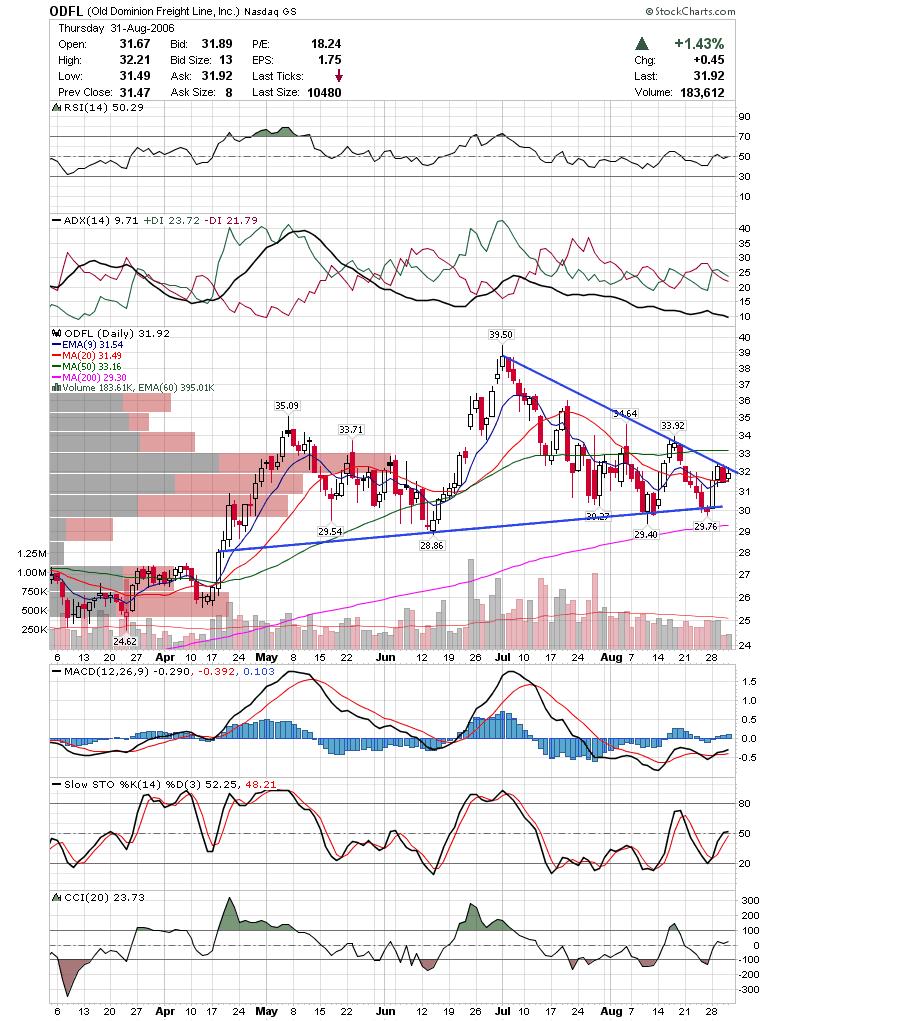
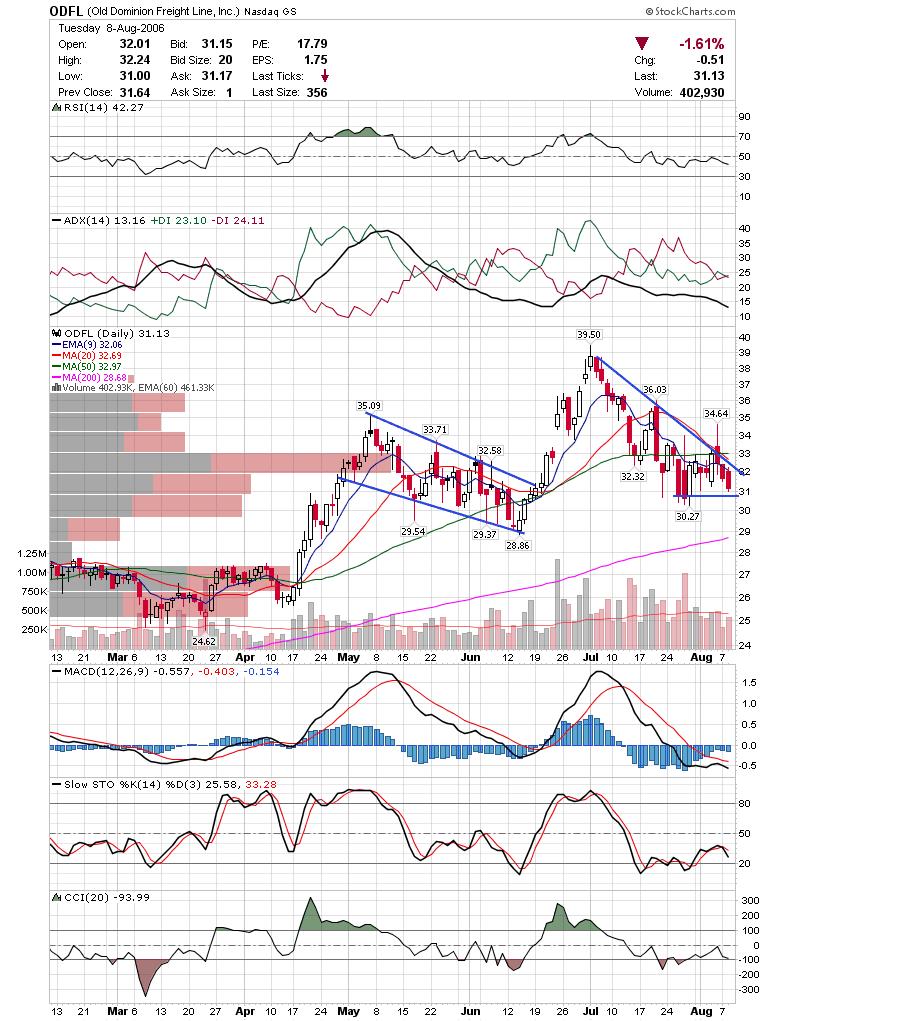
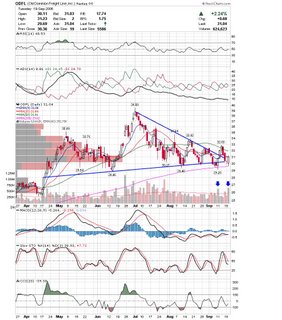
 ODFL has been getting strong support and may get a "whipsaw" rally here. In a whipsaw, a stock breaks support and aggresive shorts pile in. The stock then rallies back over broken support drawing in new buyers and forcing shorts to cover. Keep an eye on it to see if it follows through. ODFL has been getting strong support and may get a "whipsaw" rally here. In a whipsaw, a stock breaks support and aggresive shorts pile in. The stock then rallies back over broken support drawing in new buyers and forcing shorts to cover. Keep an eye on it to see if it follows through.
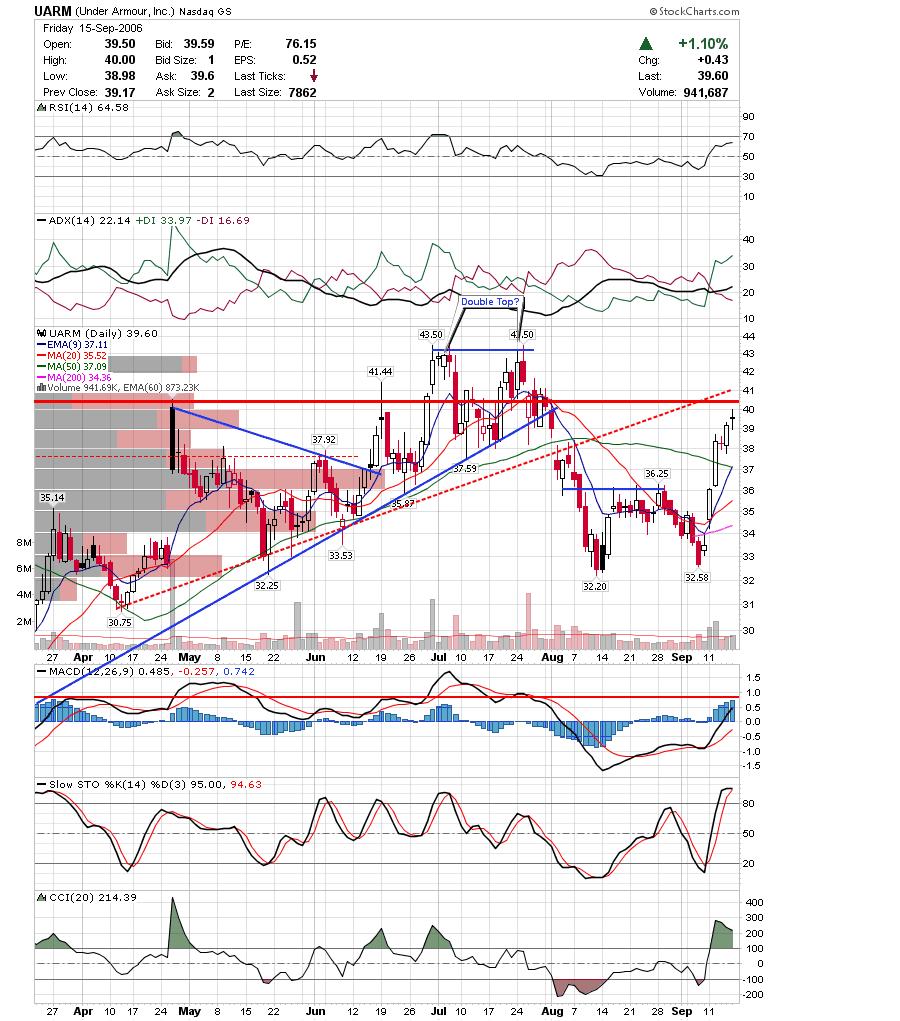
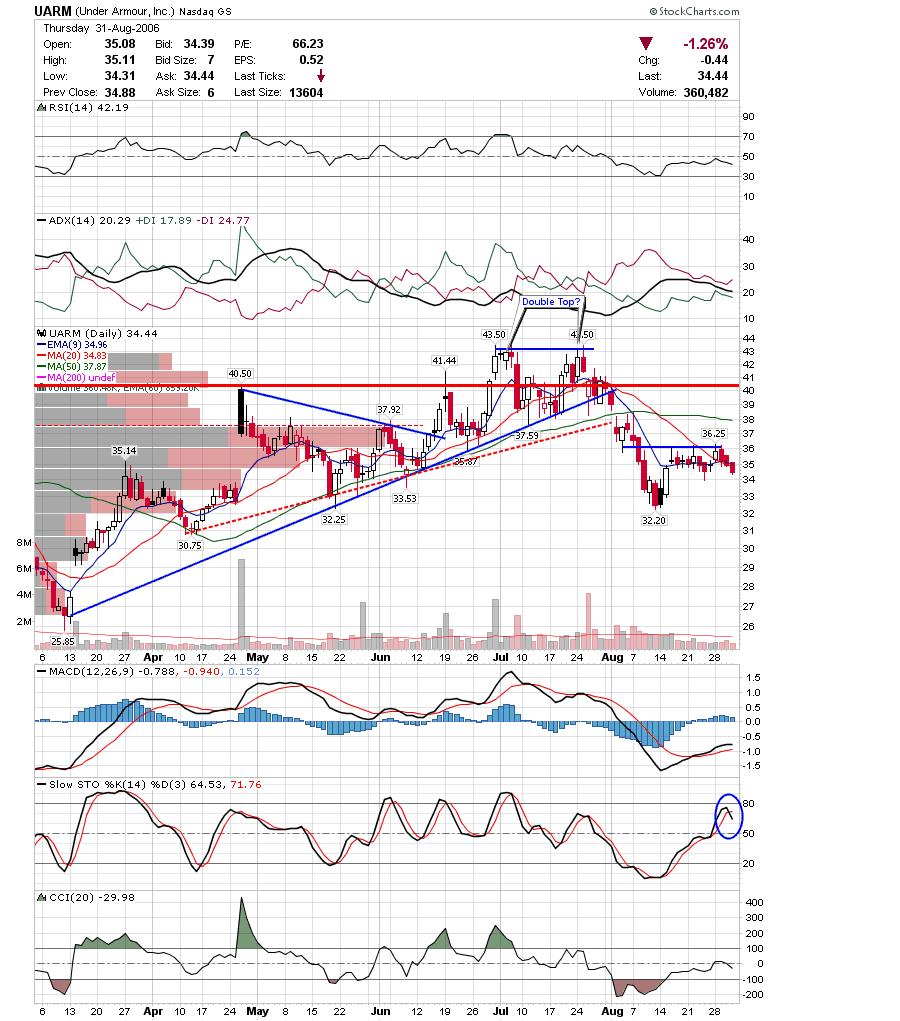
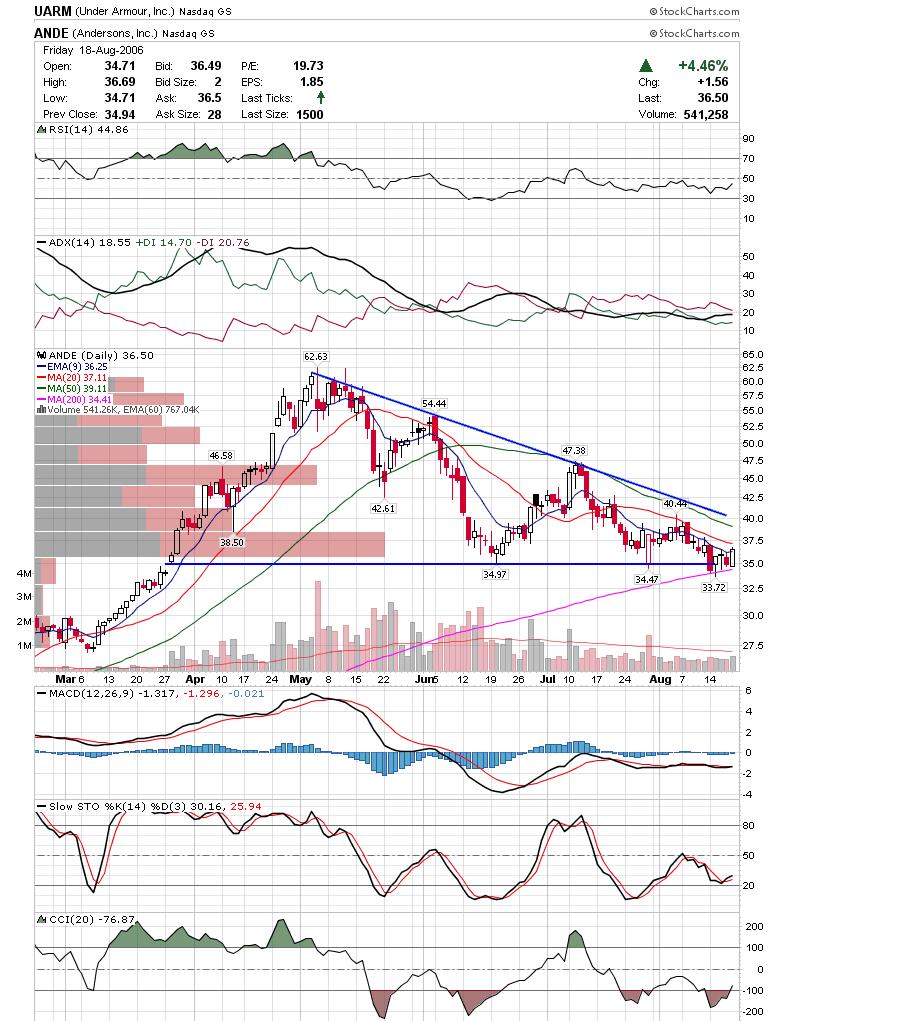
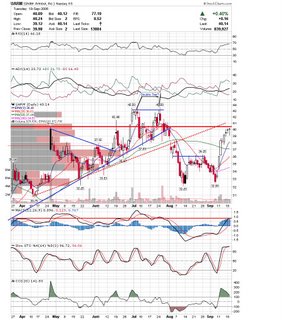
 UARM was one of those volatile stocks today, and I'm glad I missed it. I highlighted it this Sunday as a potential short and it looked like it gave a good signal today. However, it rallied very strongly at the end of the day to close in a doji. It still looks mighty toppy to me. UARM was one of those volatile stocks today, and I'm glad I missed it. I highlighted it this Sunday as a potential short and it looked like it gave a good signal today. However, it rallied very strongly at the end of the day to close in a doji. It still looks mighty toppy to me.
Careful tomorrow as it could get pretty wild after the Fed announcement.
Good Luck,
DT
Anniversary Posted by downtowntrader | 9/18/2006 04:39:00 PM | 7 comments »
Today is my Anniversary so I will be not be posting an update. The markets ended up forming spinning tops / dojis which signal indecision. This is expected as traders may be waiting for the fed meeting before putting on any meaningful positions. Here are a few links to check out:
Nice post by TraderX on one of the most common mistakes amateur traders make. Kirk had almost exactly the same thoughts too. Along those lines, here is a good articleby Barry Ritholtz on how Money Management is more important then stockpicking.
I love reading Fallonds public stockchart.com roundup. If you are learning how to chart, you really owe it to yourself to spend some time on the public area of stockcharts.com and try to really analyze how others chart and compare what your charts look like compared to others.- And finally, my link of the day. I saw this a while ago and a friend of mine was checking it out today and I still found it funny.
Have a nice evening and good luck tomorrow,
DT
Sunday Night Roundup Posted by downtowntrader | 9/17/2006 11:22:00 PM | 1 comments »
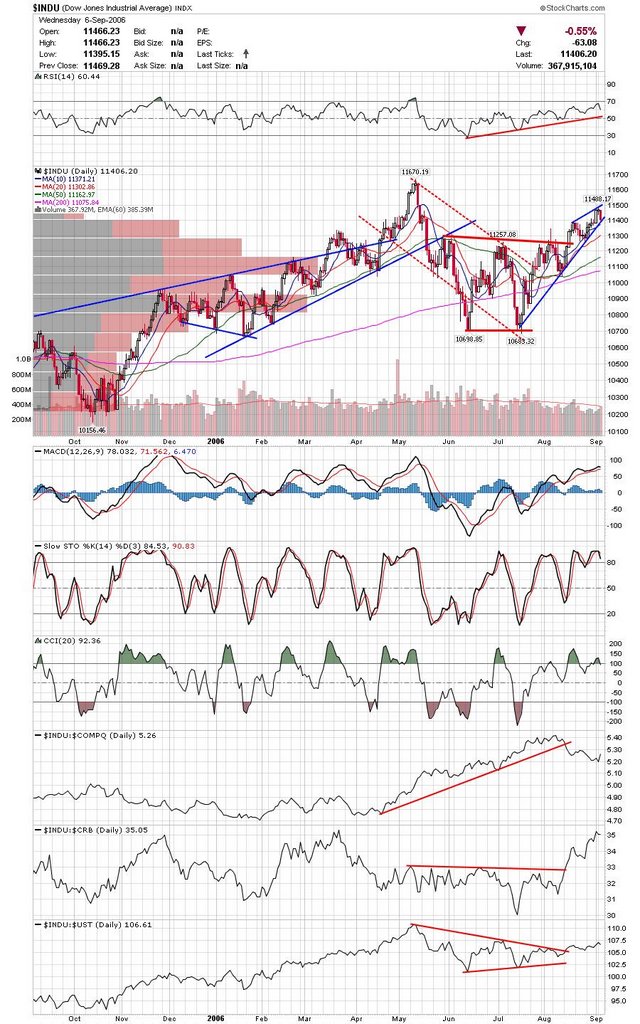
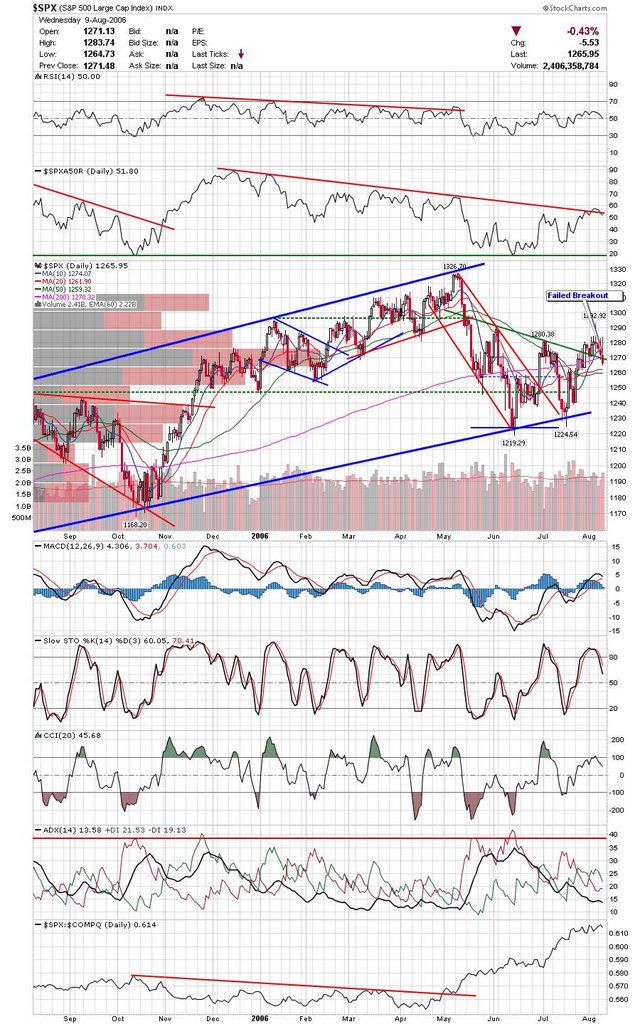
Last weeks gains were quite impressive for bulls, but with overbought conditions, and the Fed meeting coming up, I would be very careful about what positions I initiate in the next couple of days. The Dow is just a few points from an all time high, so it will be interesting to see if there is a squeeze that takes it there or if the rally is too tired. The Nasdaq has been leading this move up which is bullish, but in looking at some sector charts tonight, I noticed the hardware index and Sox coming up to 200sma resistance. I would think that a pullback, at a minimum, is in order here. As usual for Sunday's, lot's of charts.
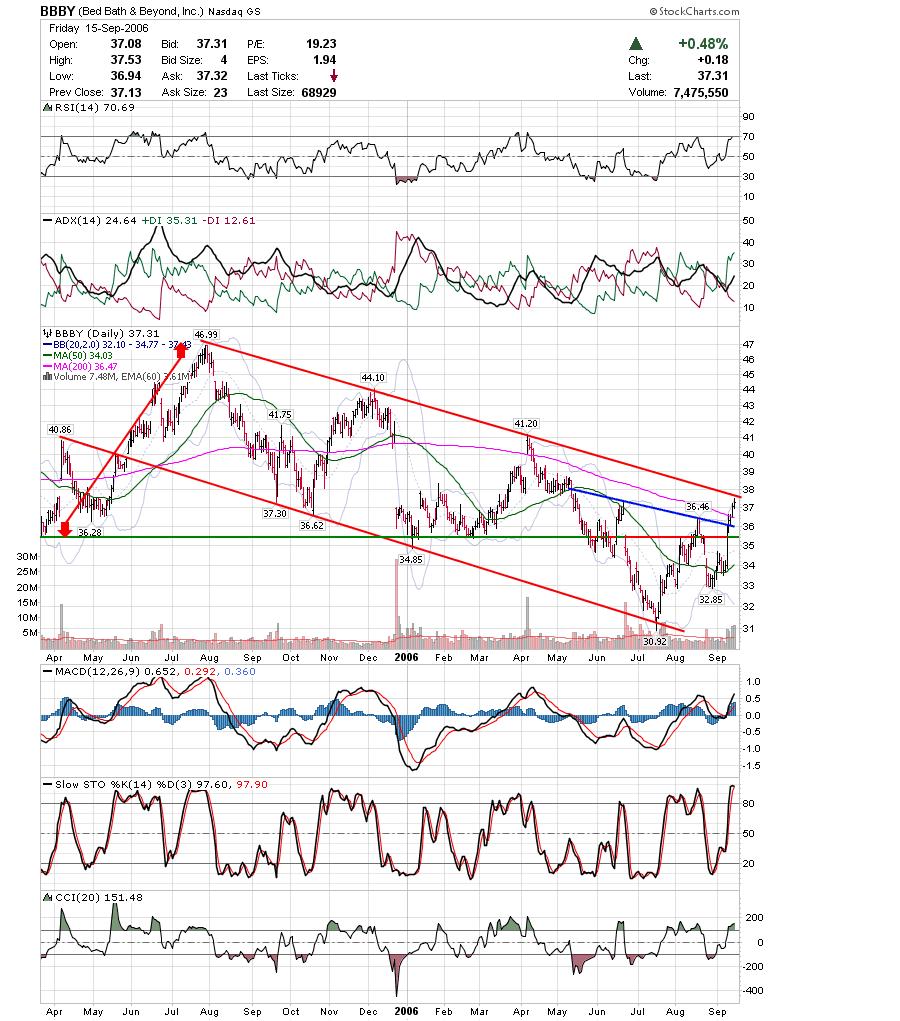
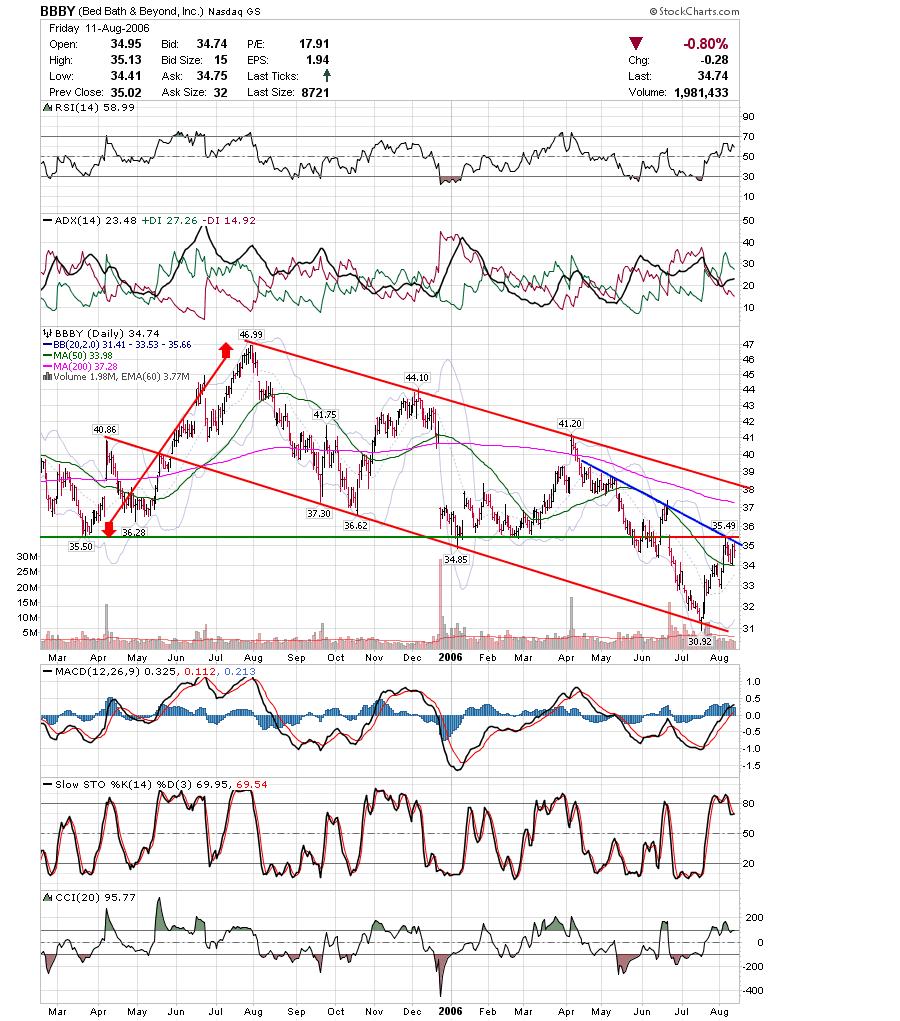
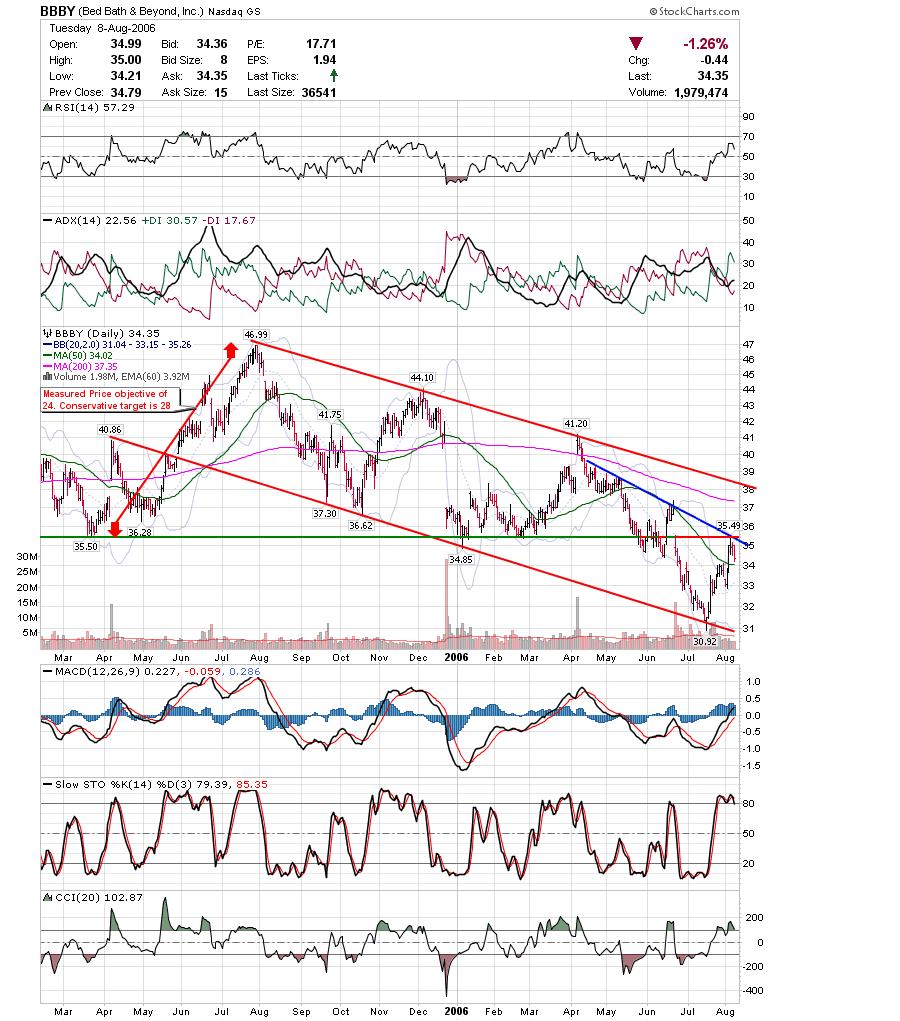
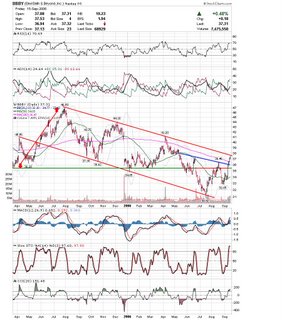
BBBY has been strong but may run into trouble at resistance here. The key here is what the Fed says about the consumer and / or housing this week.
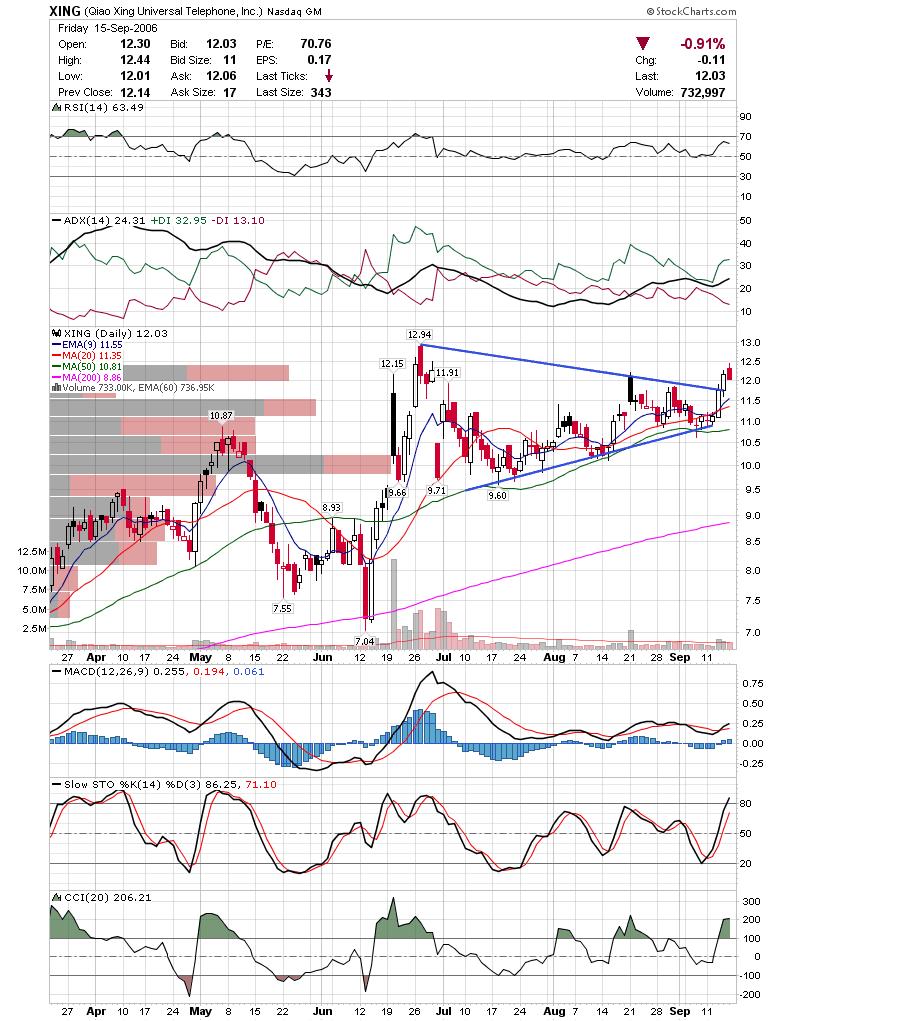
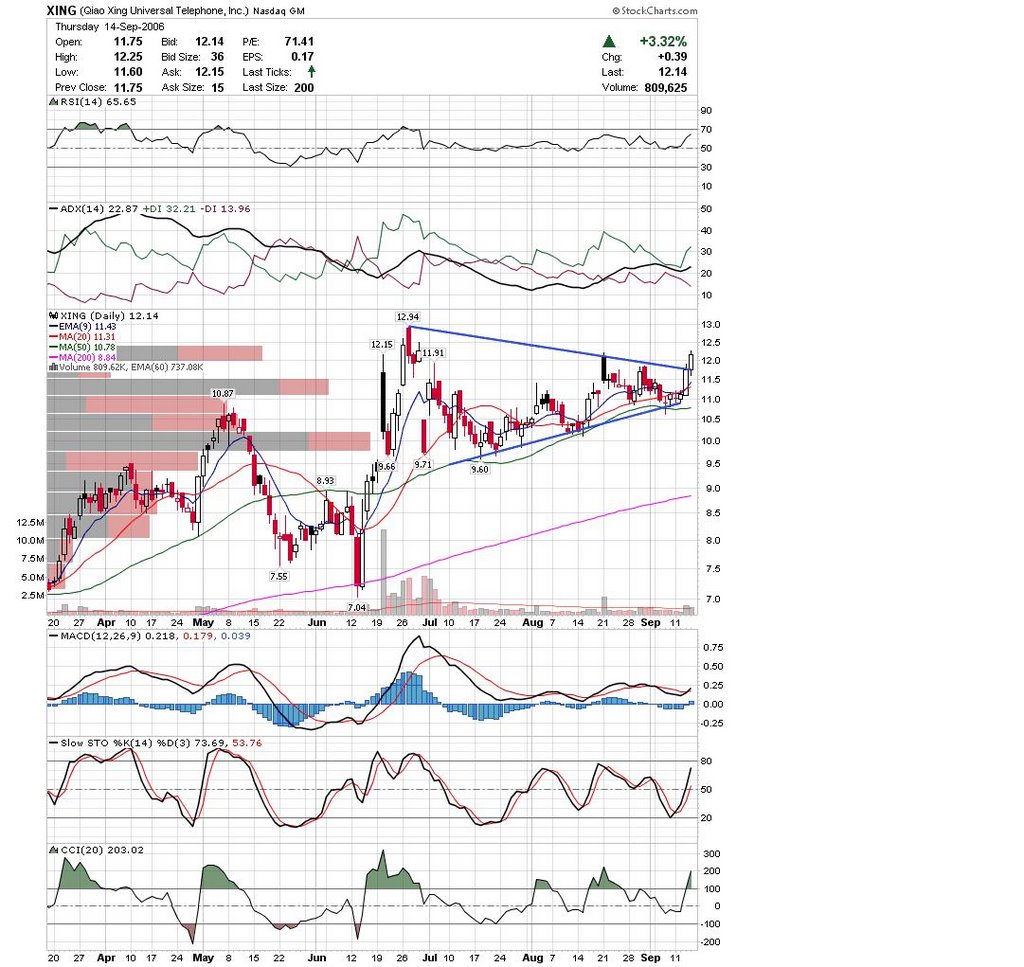
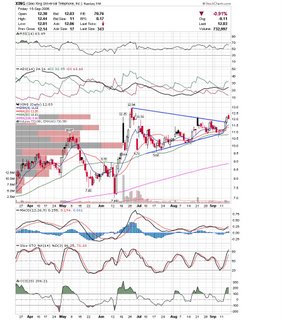
 Re-Posting XING for those that didn't trade Friday. MACD is turning up nicely. Re-Posting XING for those that didn't trade Friday. MACD is turning up nicely.
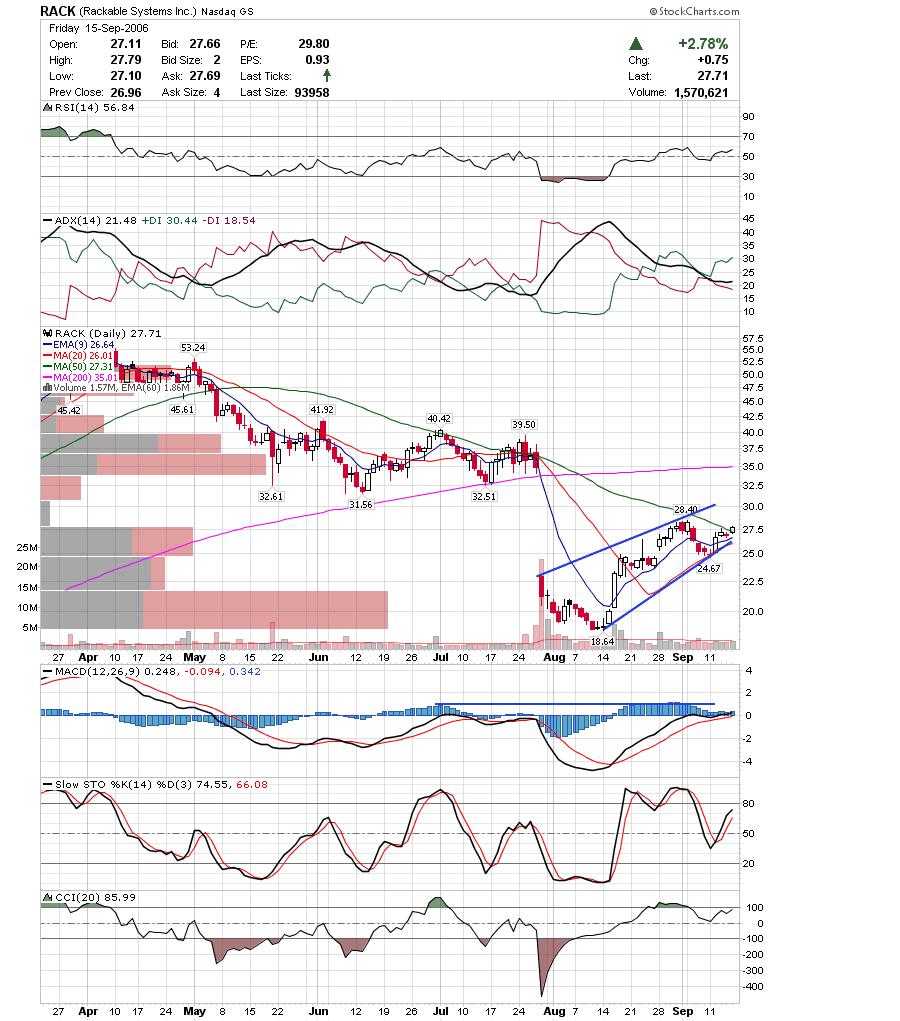
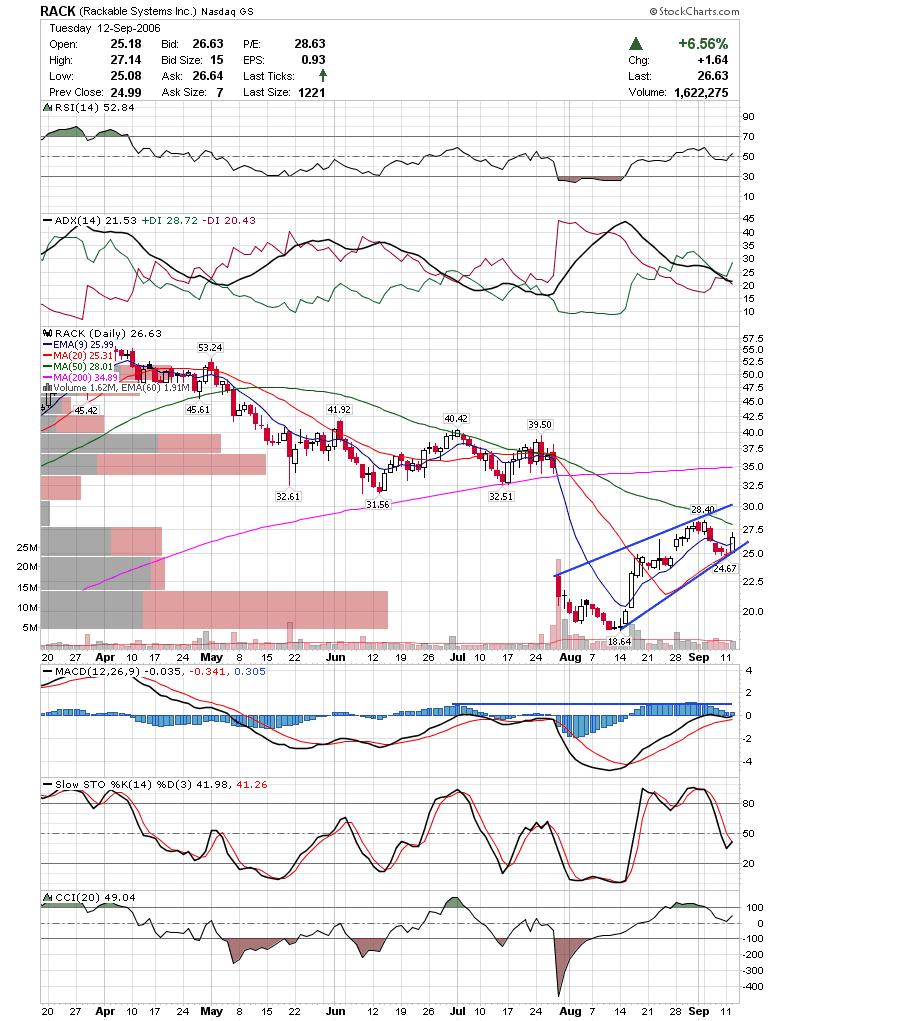
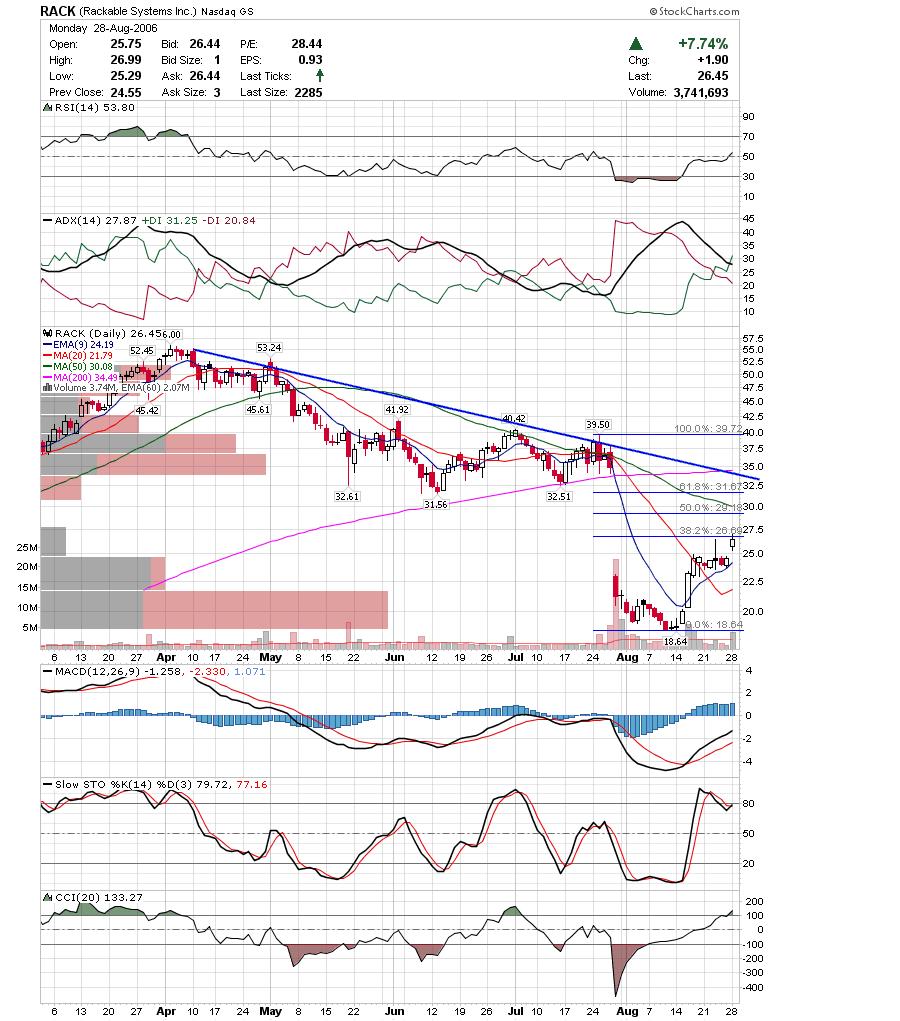
 While the hardware index is looking like it is near some resistance, RACK looks like it will touch 29's at least. While the hardware index is looking like it is near some resistance, RACK looks like it will touch 29's at least.
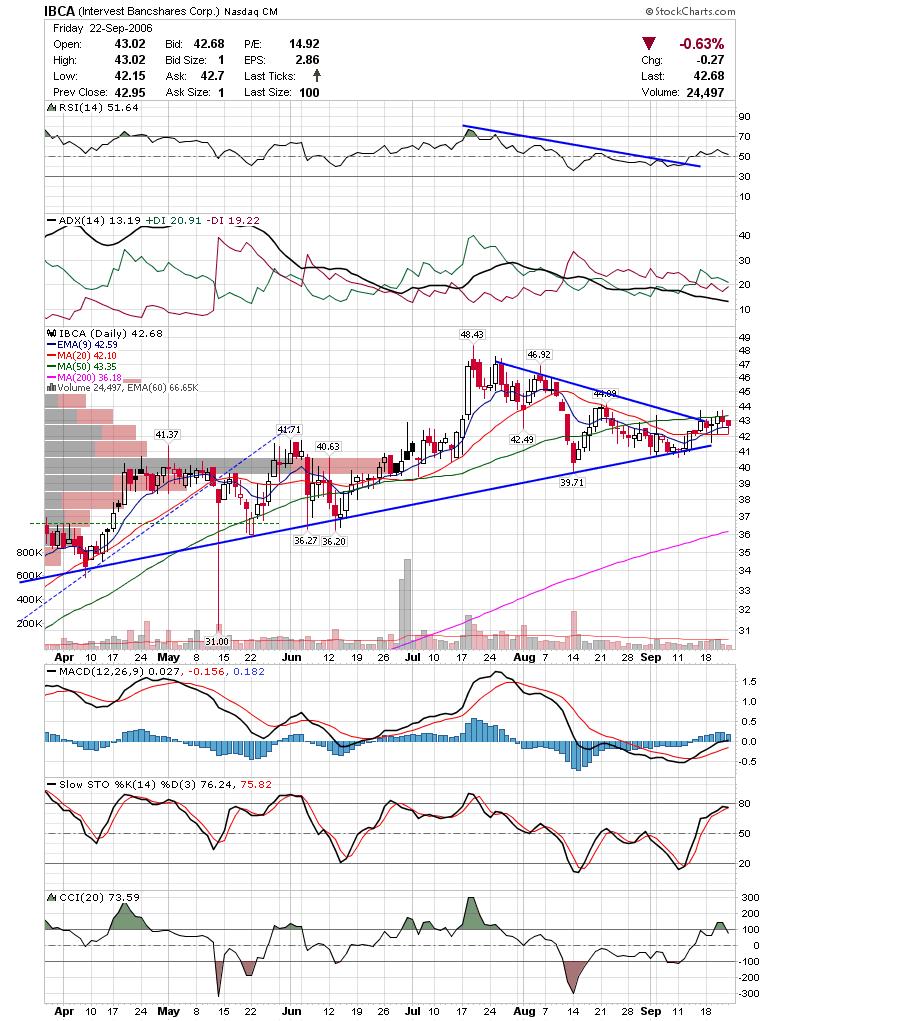
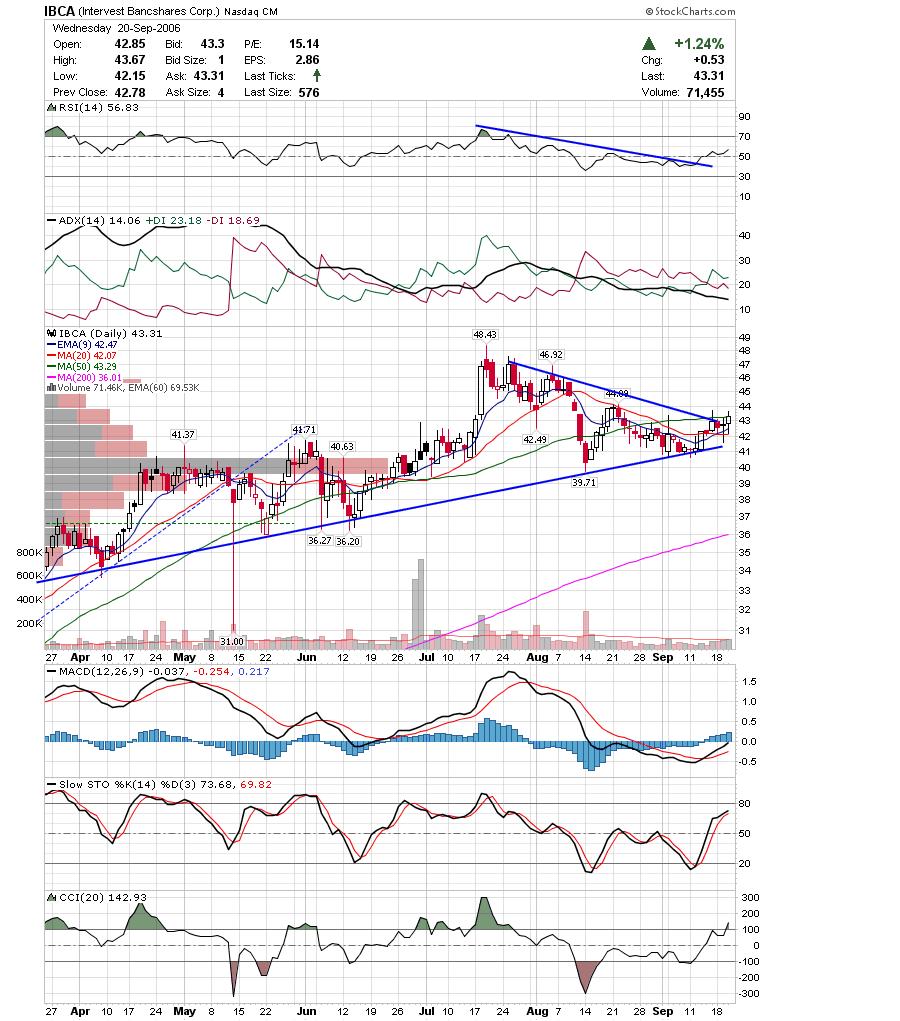
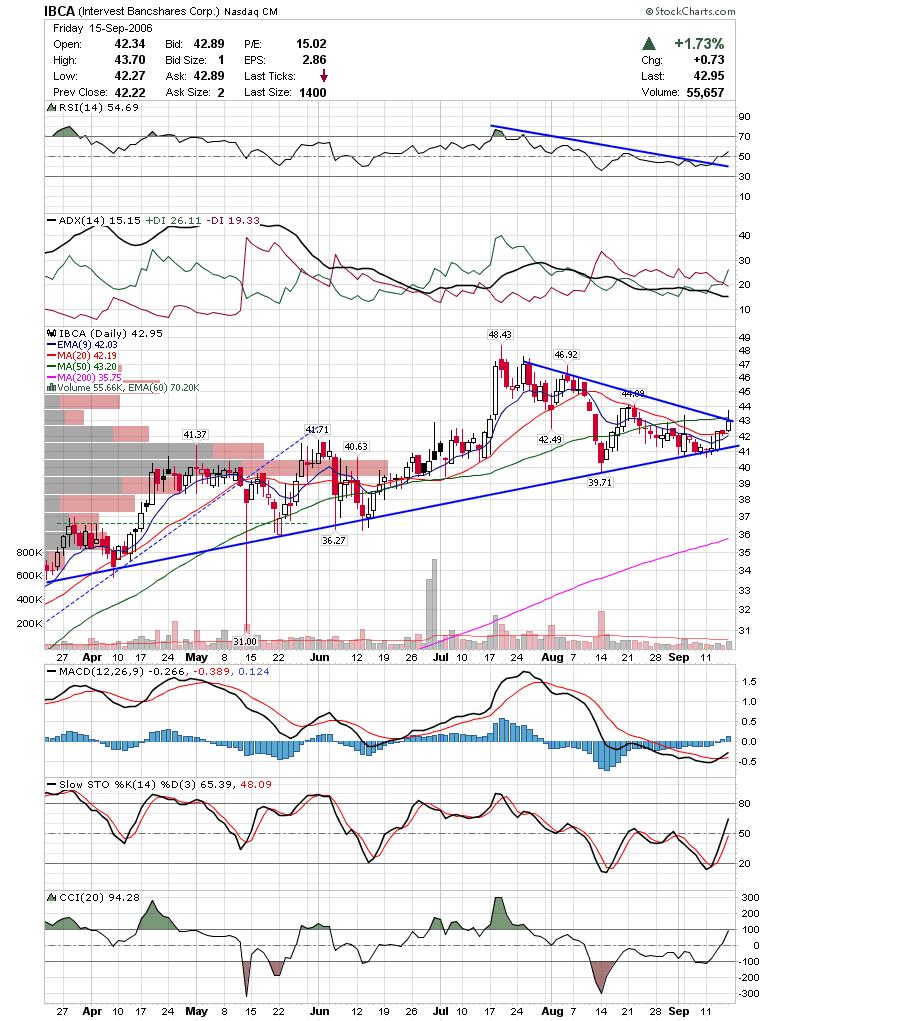
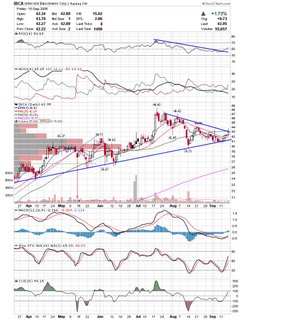
 IBCA found support at it's rising trendline and looks good if it can clear the 50sma. IBCA found support at it's rising trendline and looks good if it can clear the 50sma.
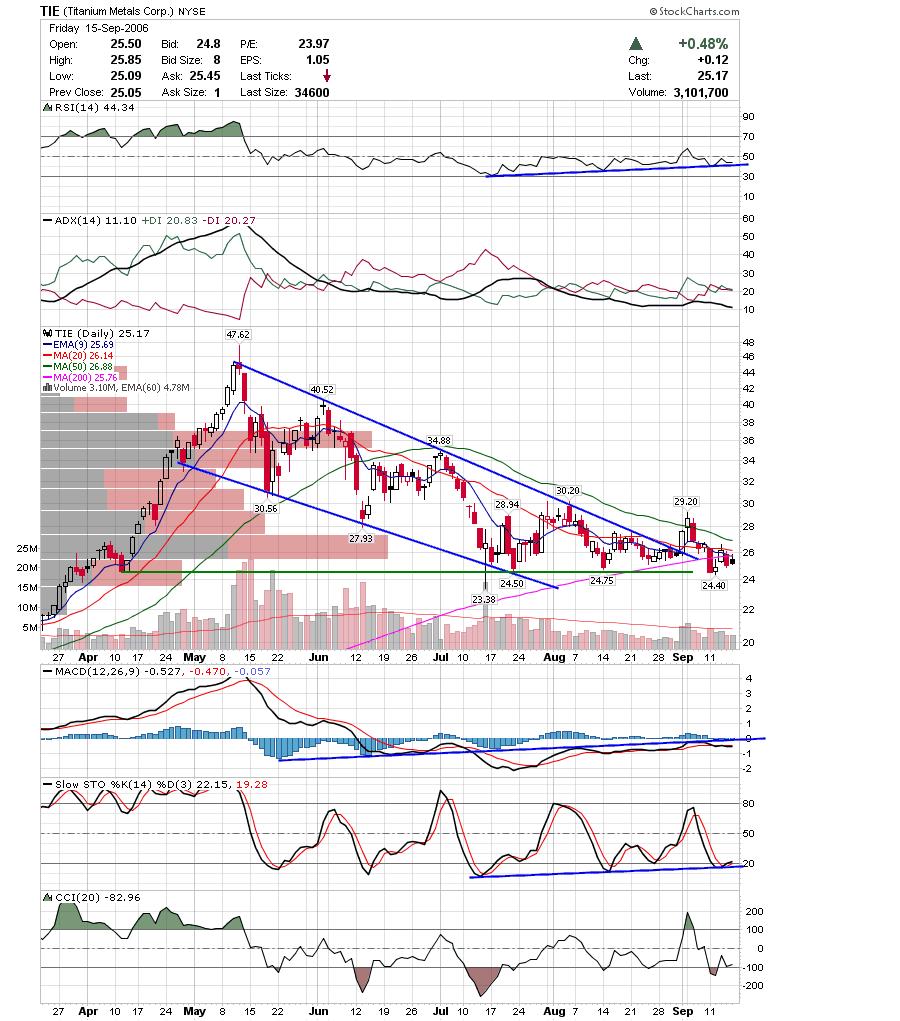
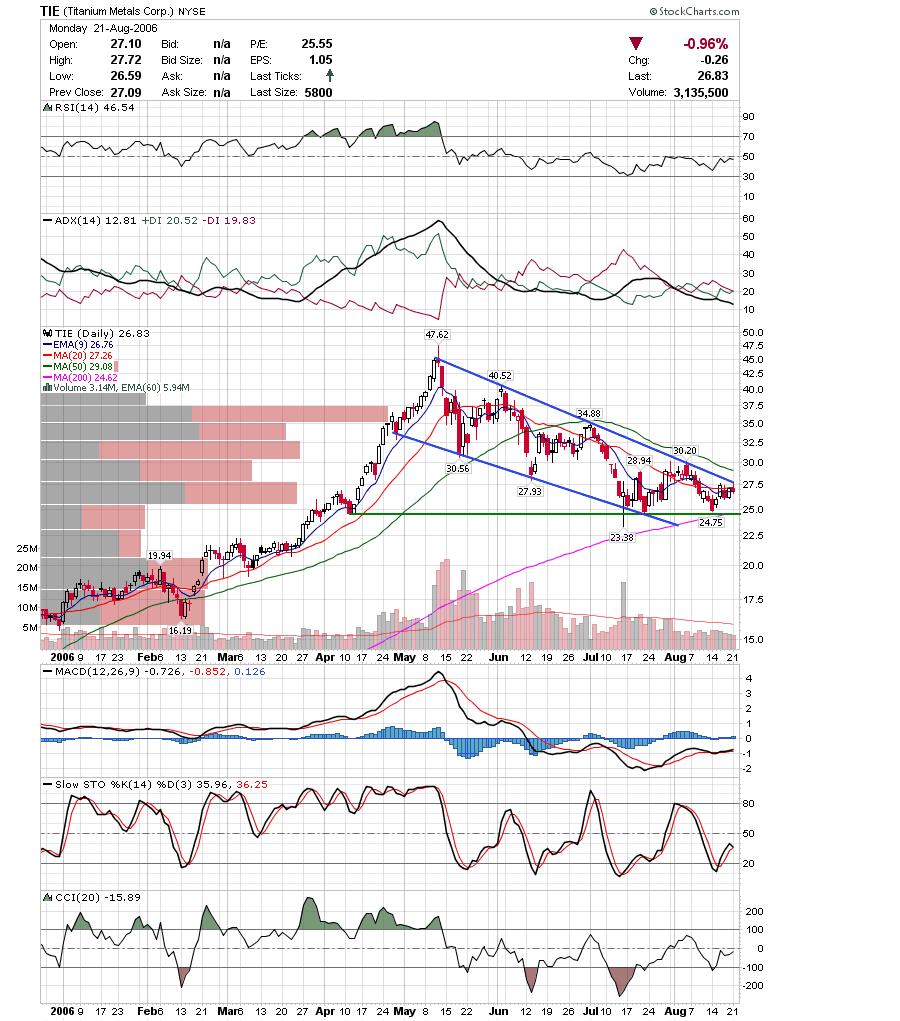
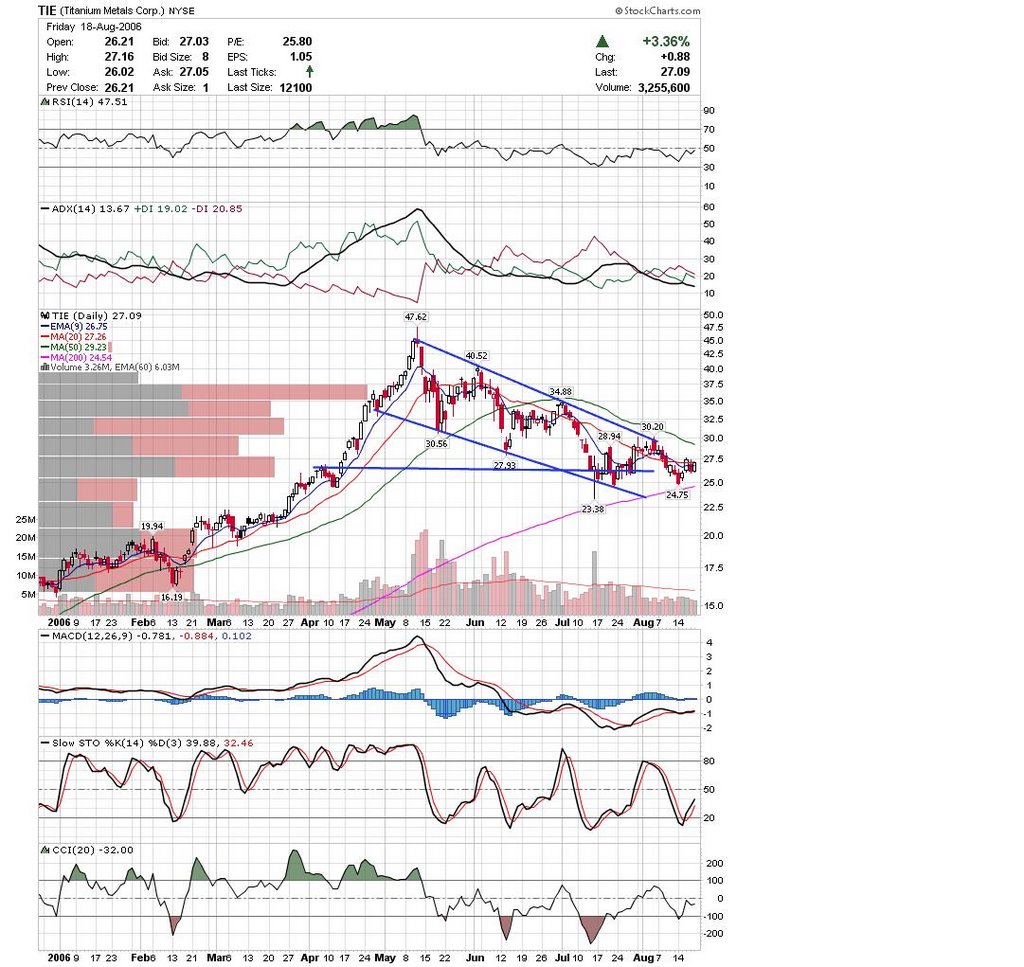
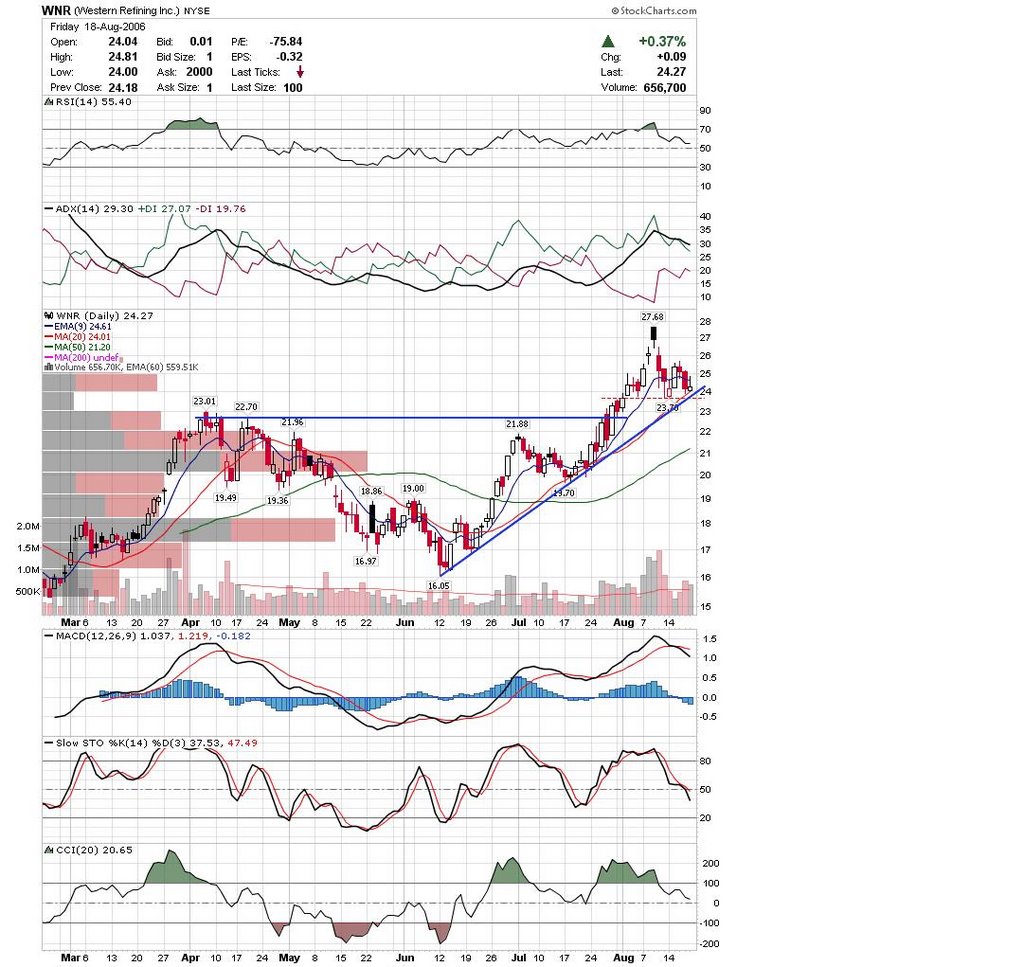
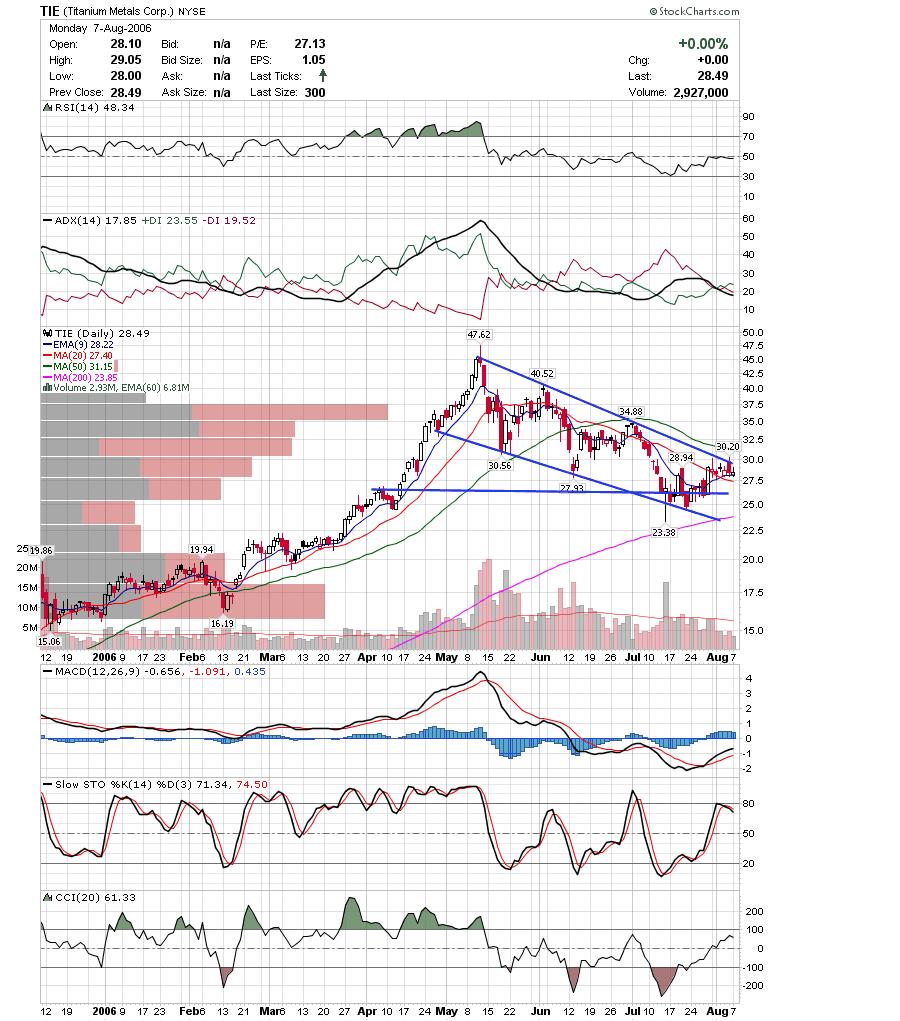
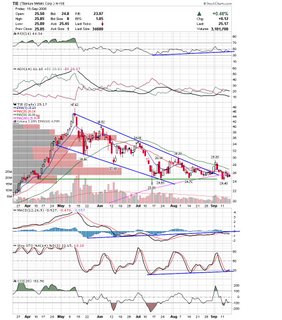
 TIE is back at major support and with Basic Materials oversold, it could be due a nice bounce. Of course, if it breaks under 24, it could get ugly real fast. Either way works, as long as it moves ;) TIE is back at major support and with Basic Materials oversold, it could be due a nice bounce. Of course, if it breaks under 24, it could get ugly real fast. Either way works, as long as it moves ;)
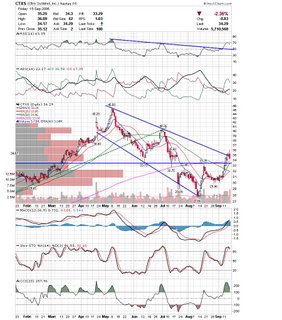
 CTXS has managed to work it's way up to trendline resistance. If the Nasdaq runs in to trouble this week, then CTXS should give back a decent chunk of this last leg up. CTXS has managed to work it's way up to trendline resistance. If the Nasdaq runs in to trouble this week, then CTXS should give back a decent chunk of this last leg up.
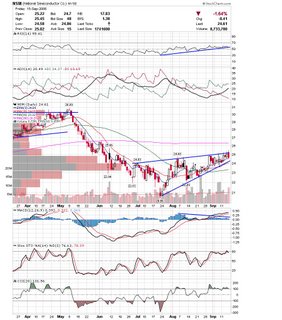
 NSM may be running out of steam, and is in danger of breaking down from this bearish wedge. NSM may be running out of steam, and is in danger of breaking down from this bearish wedge.
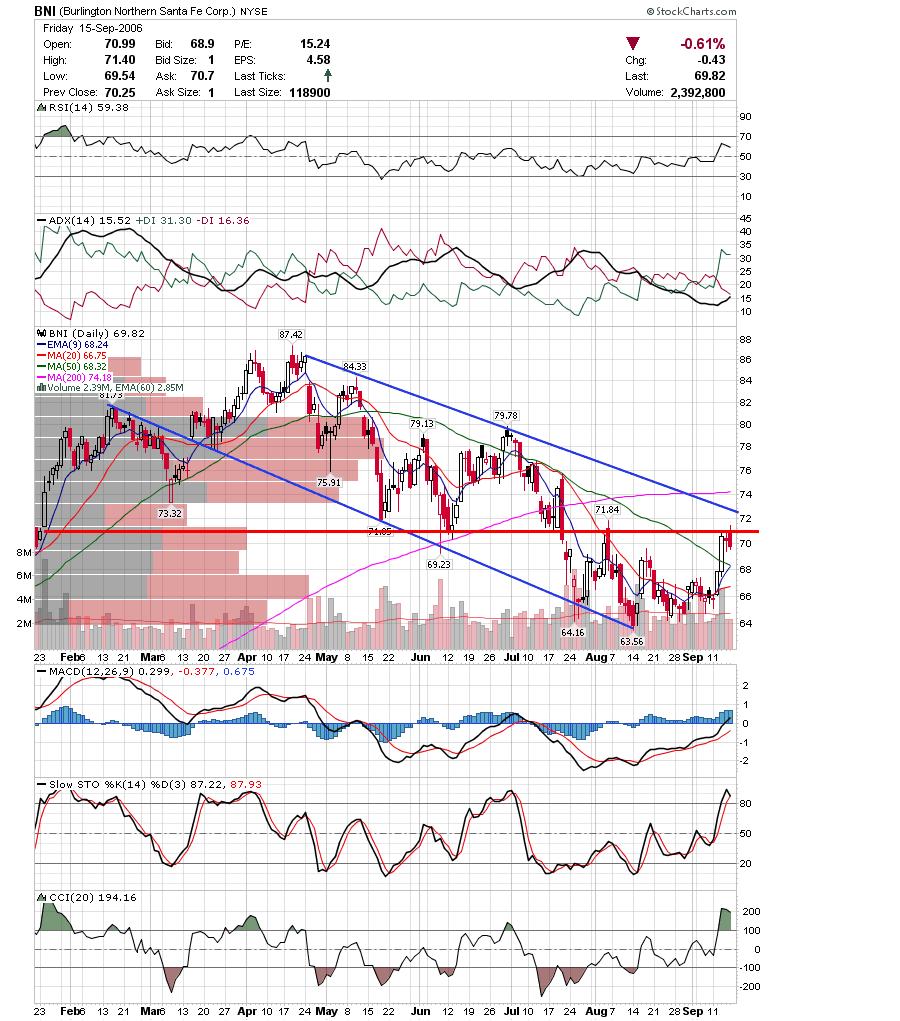
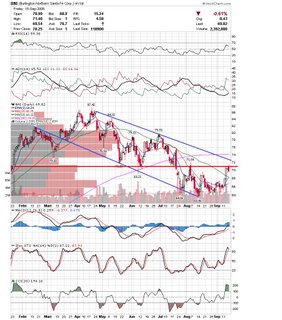
 BNI didn't quite make it to the descending trendline, but did stall at a previous piot area. BNI didn't quite make it to the descending trendline, but did stall at a previous piot area.
 UARM looks like it got a nice short squueze but formed a doji near resistance. This could turn into an evening star pattern if tomorrow is ugly. UARM looks like it got a nice short squueze but formed a doji near resistance. This could turn into an evening star pattern if tomorrow is ugly.
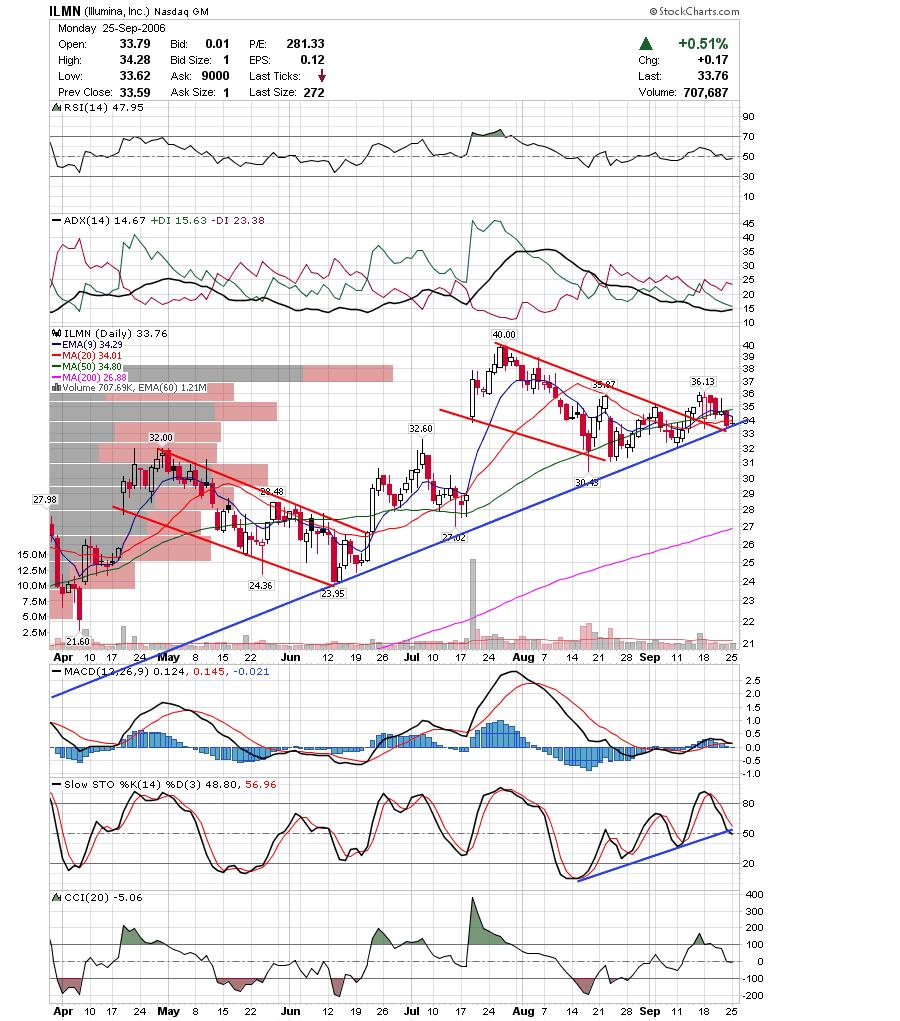
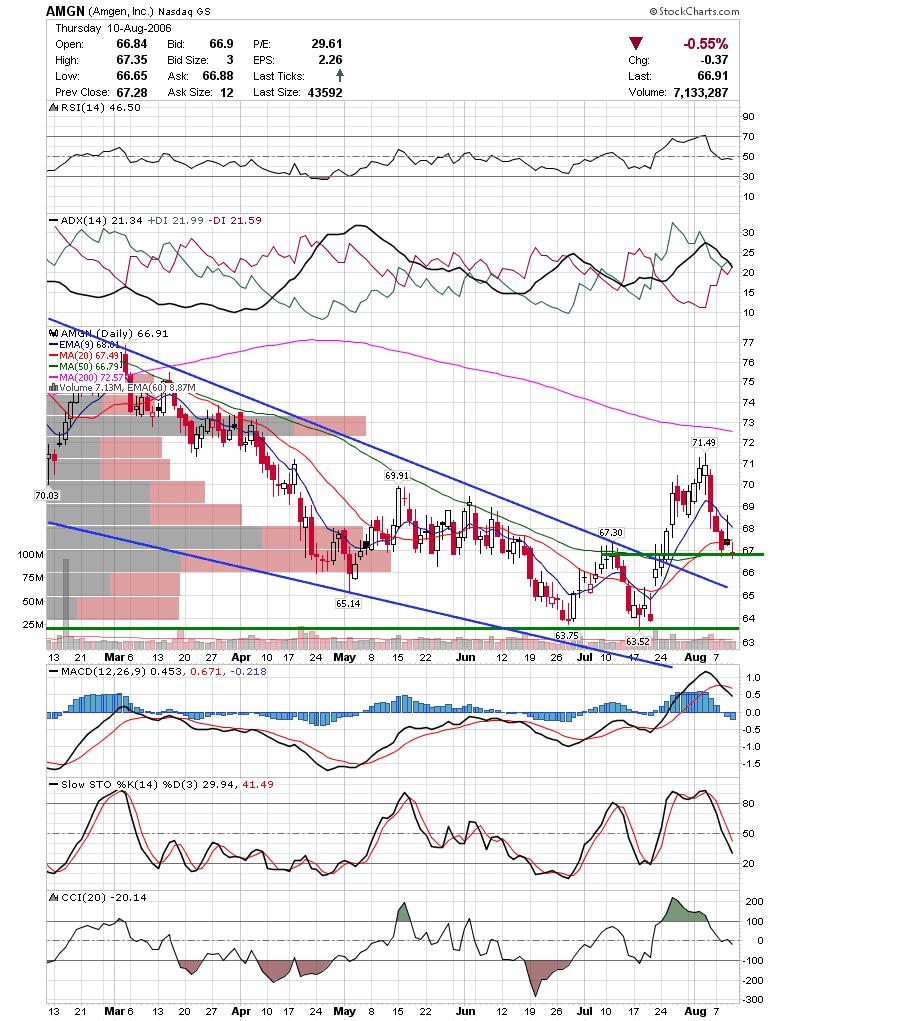
 I was looking at the Biotech indices and thinking they were looking bullish, and Trader Jamie also mentioned a possible rotation into Biotechs on his blog. Here are two that I think looks bullish. I was looking at the Biotech indices and thinking they were looking bullish, and Trader Jamie also mentioned a possible rotation into Biotechs on his blog. Here are two that I think looks bullish.
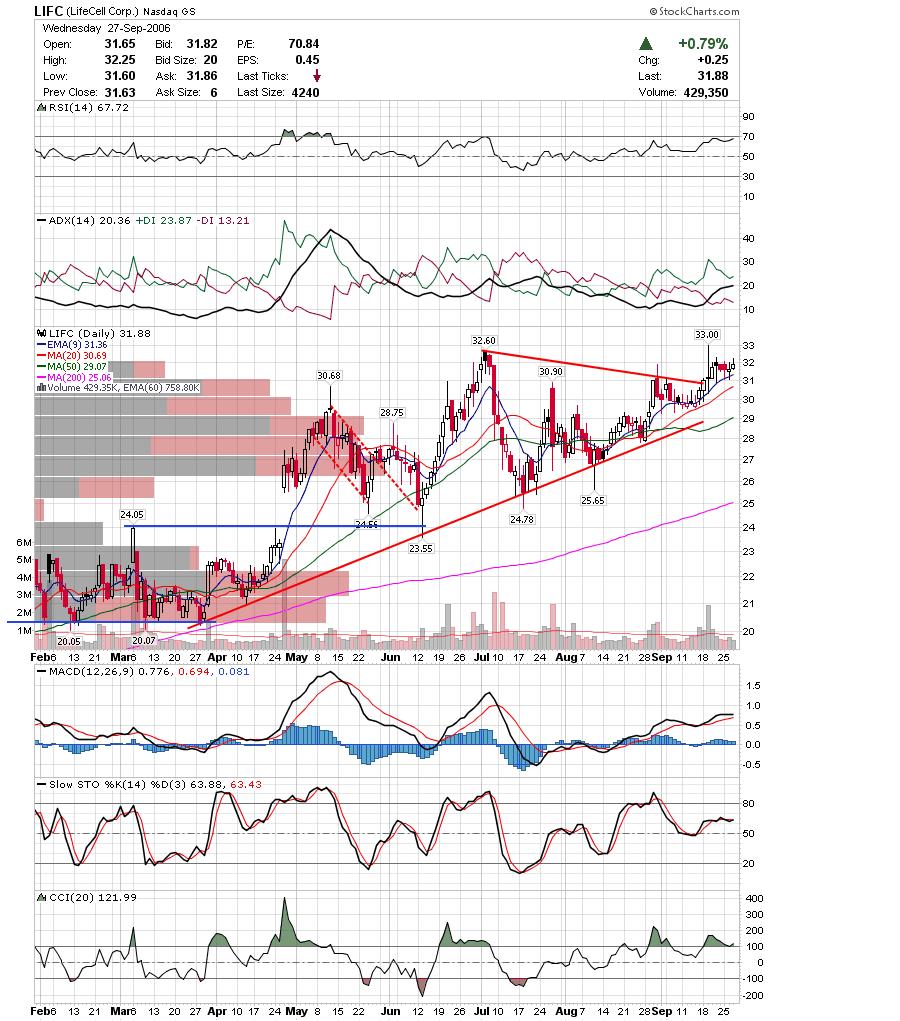
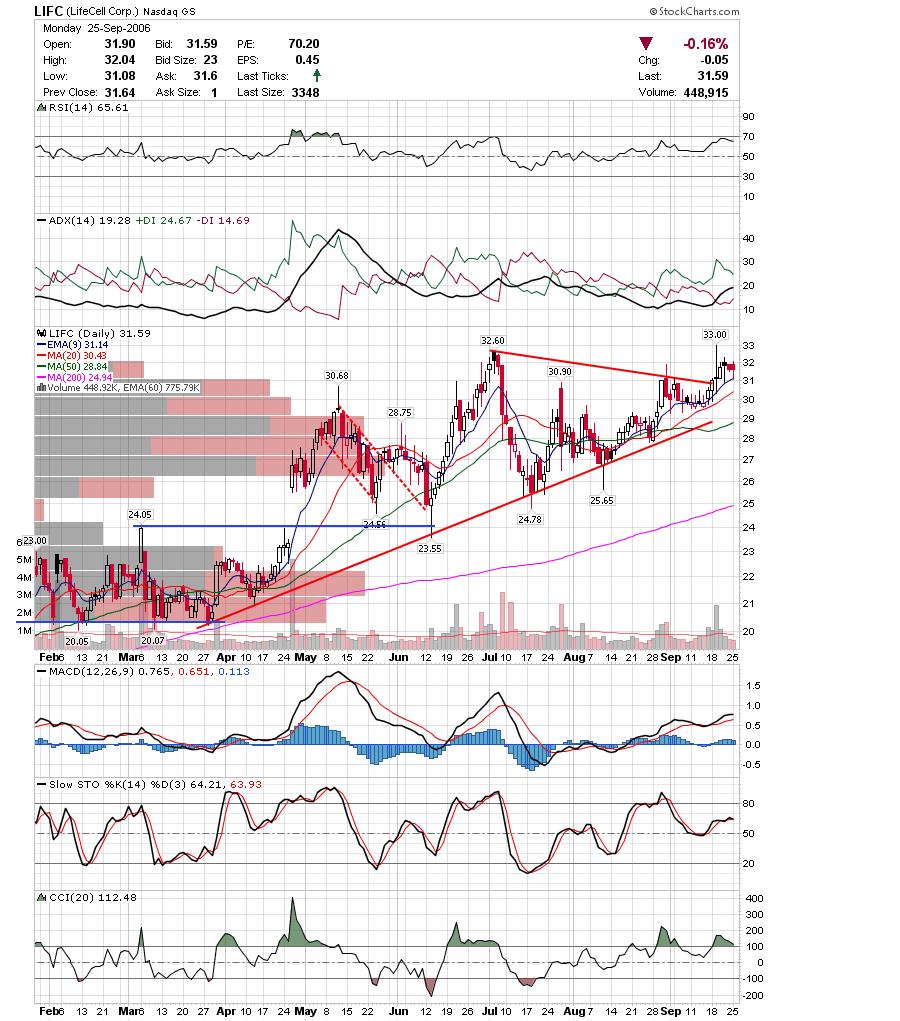
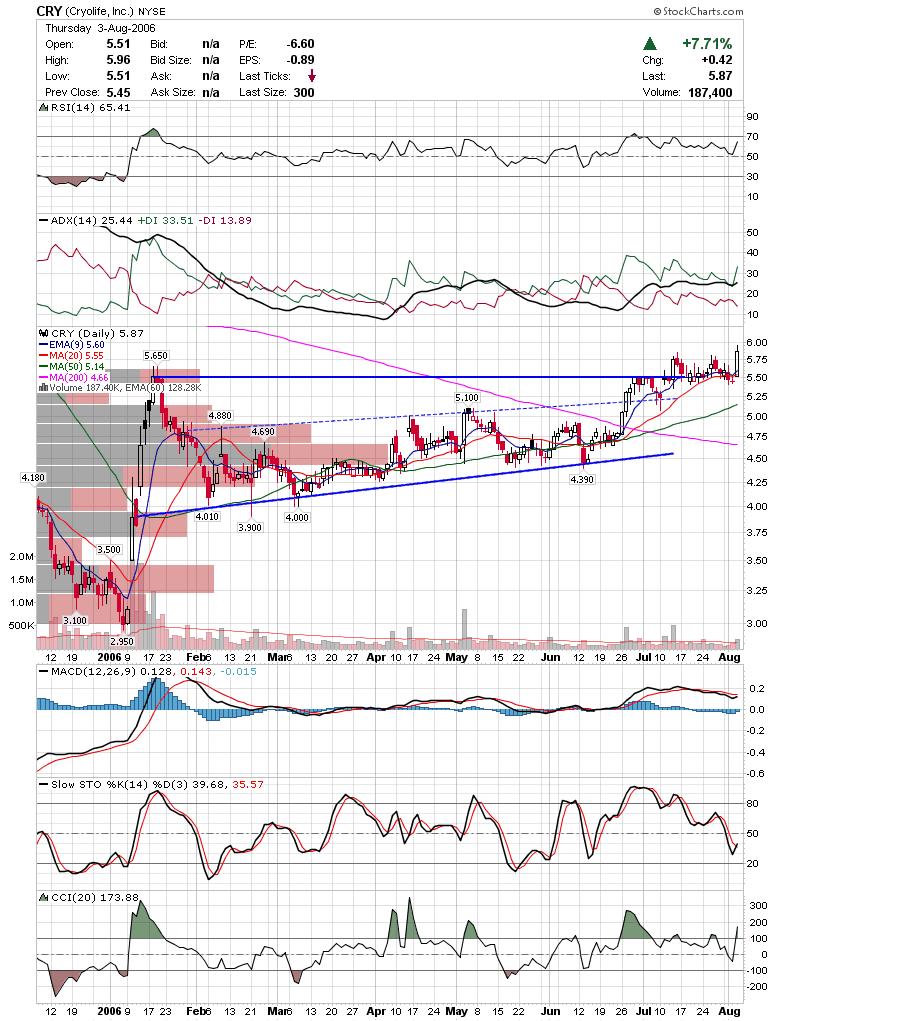
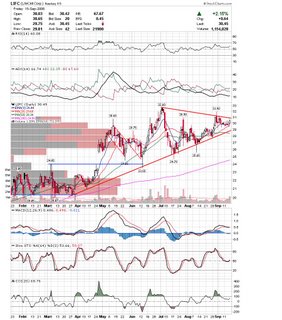
First up is LIFC. It is finding support at the 20sma right under trendline resistance. Slow Stochastics is turning back up as well.
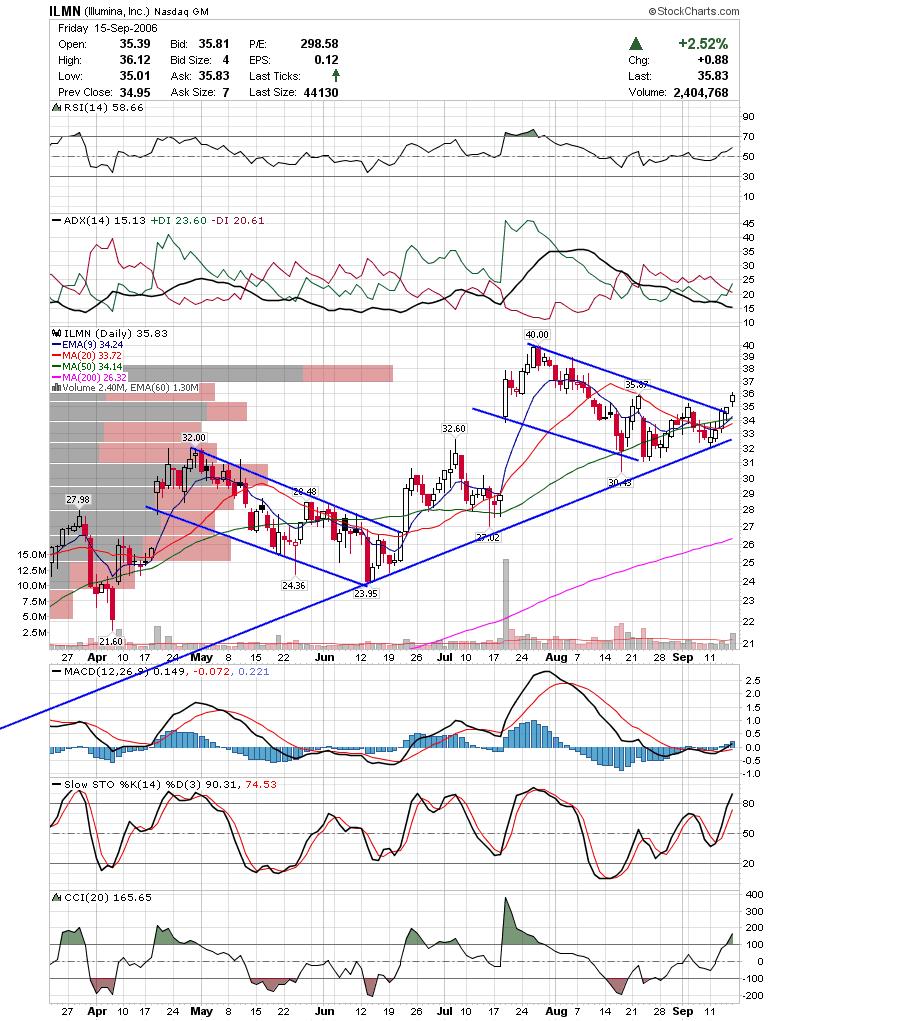
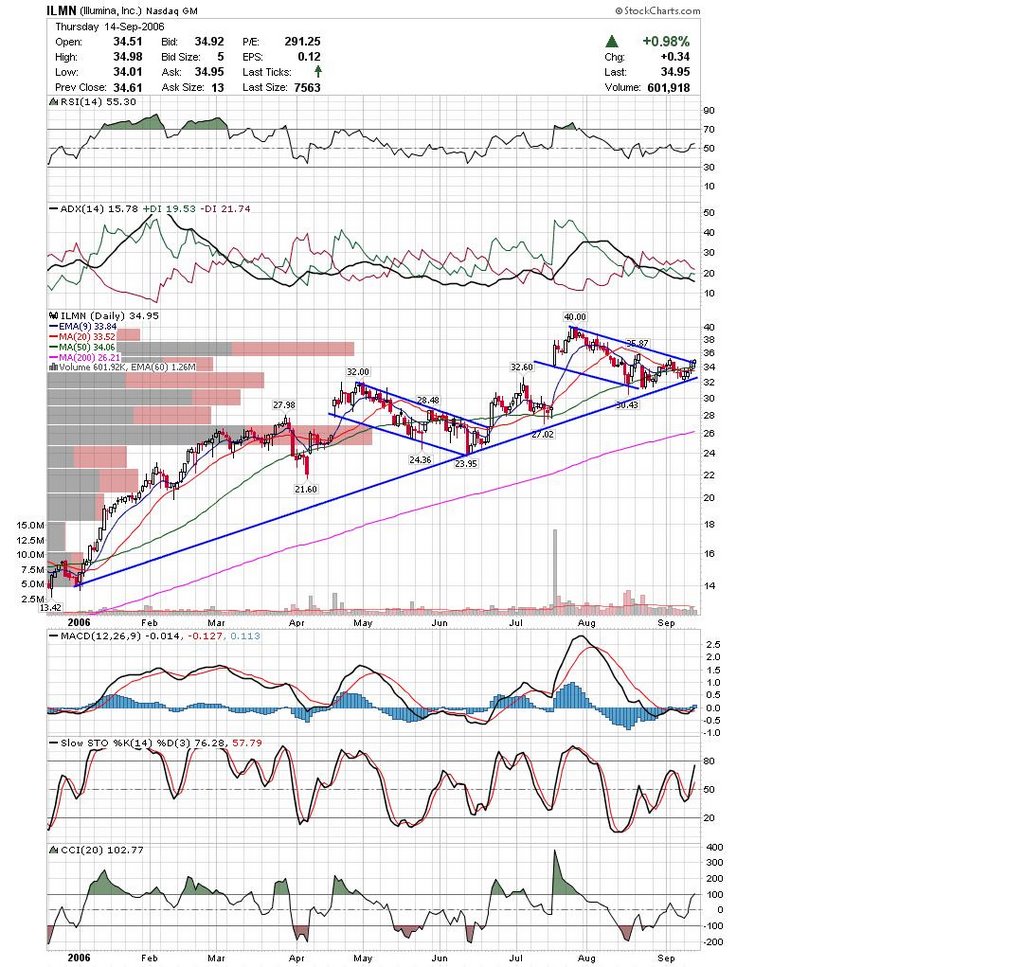
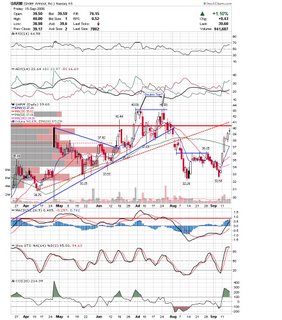
 Second is ILMN which I mentioned last week. This looks like it is starting the next leg up. Second is ILMN which I mentioned last week. This looks like it is starting the next leg up.
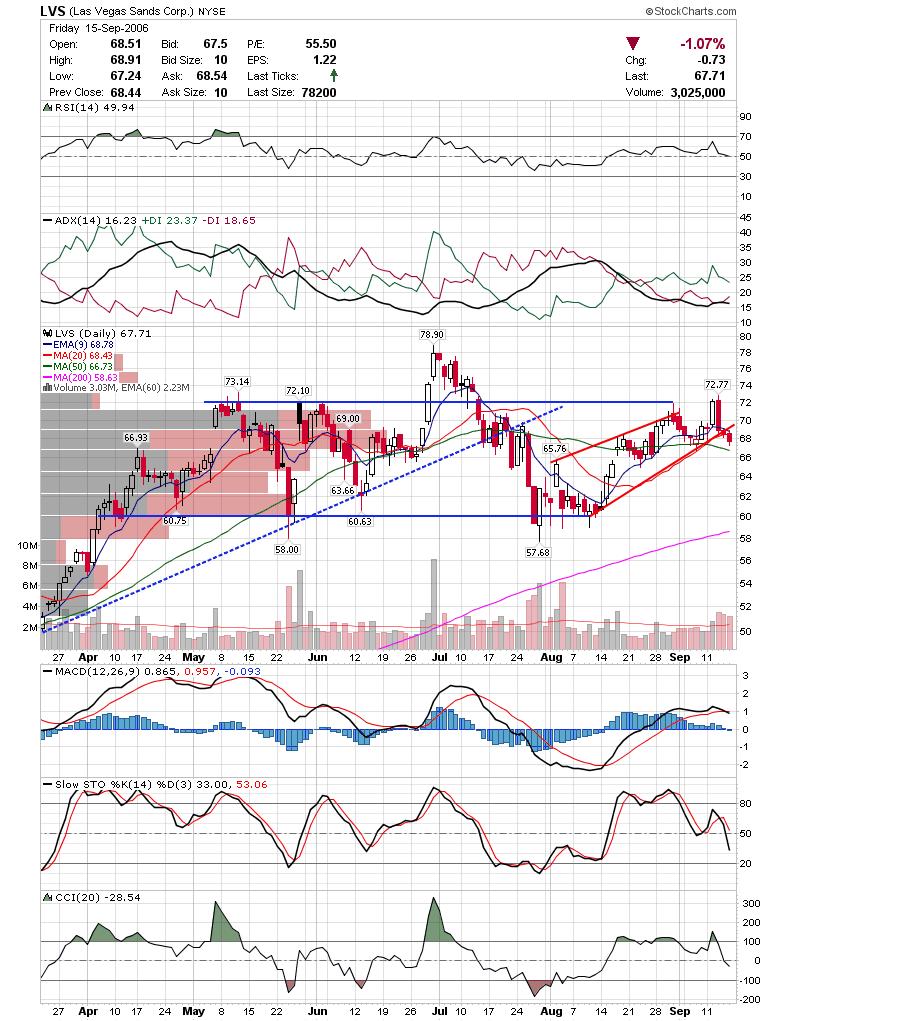
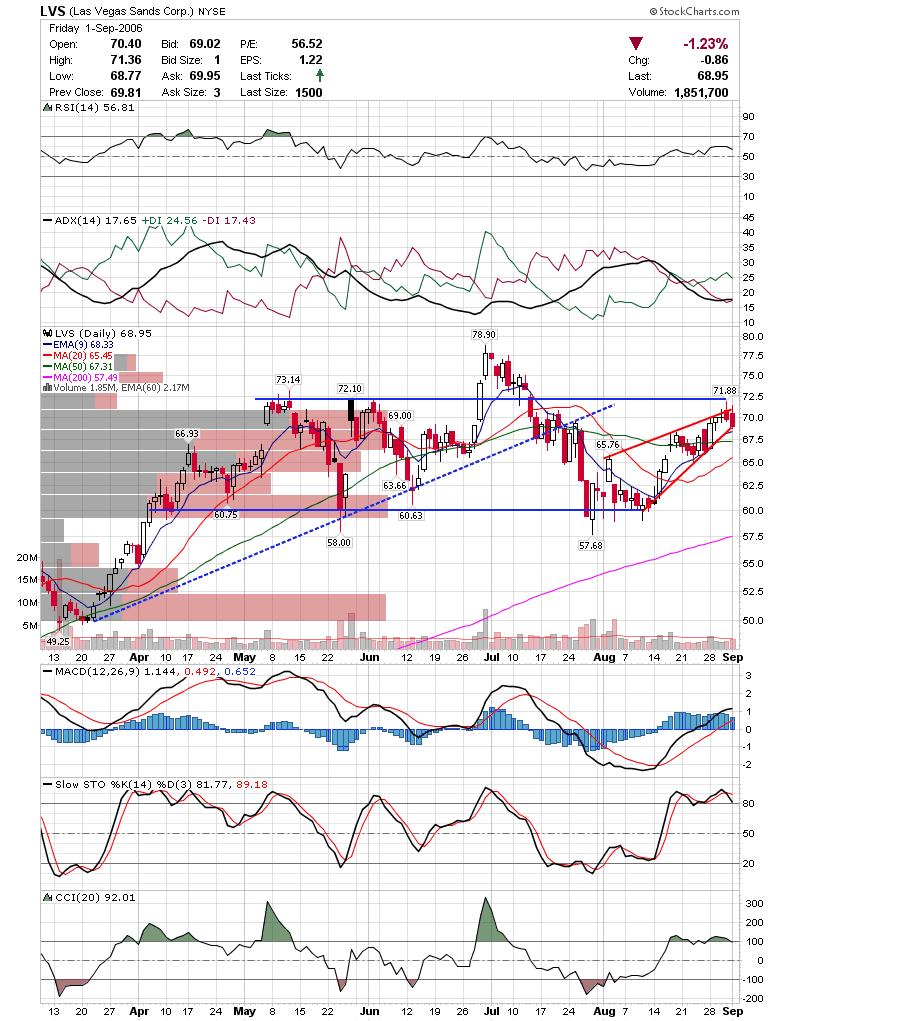
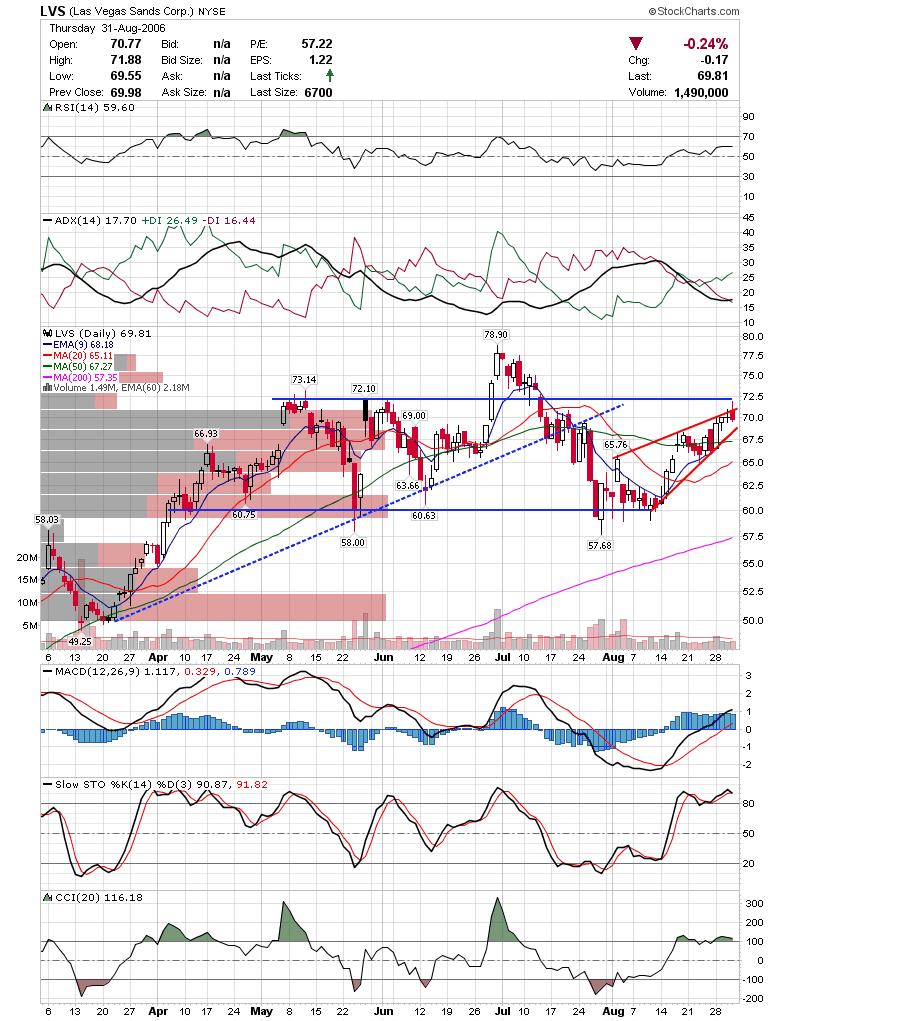
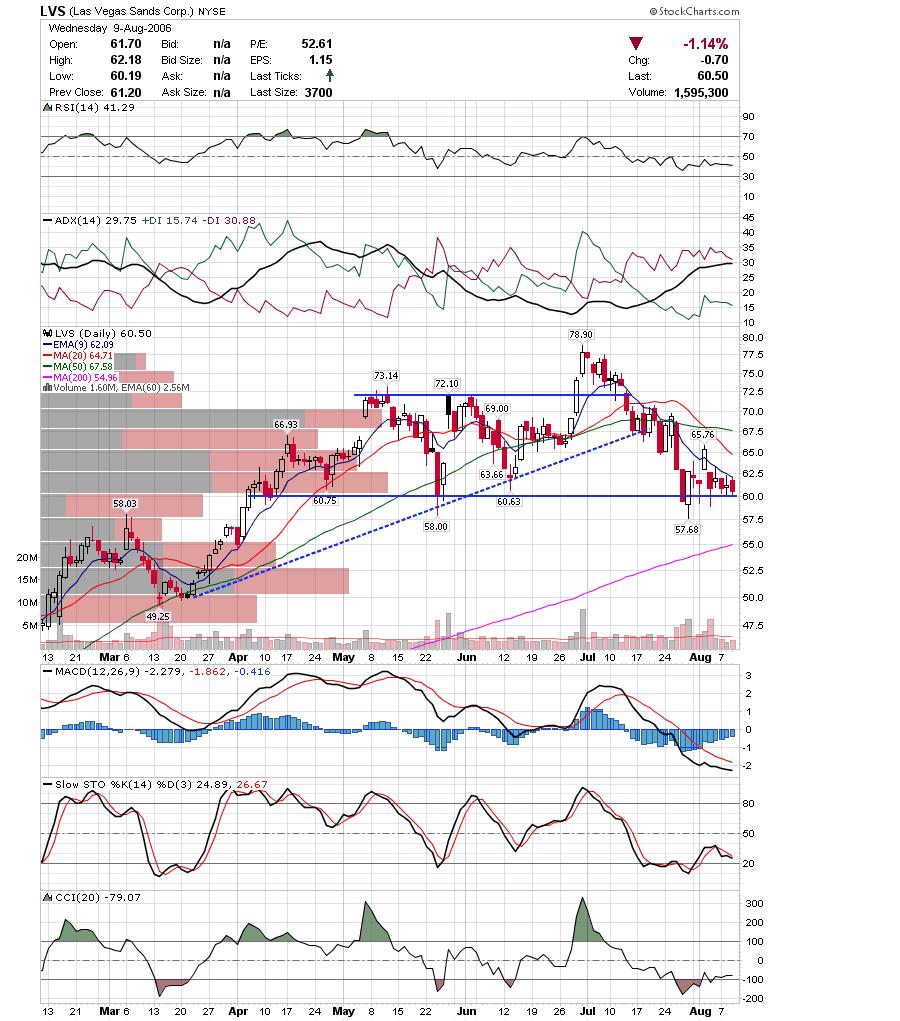
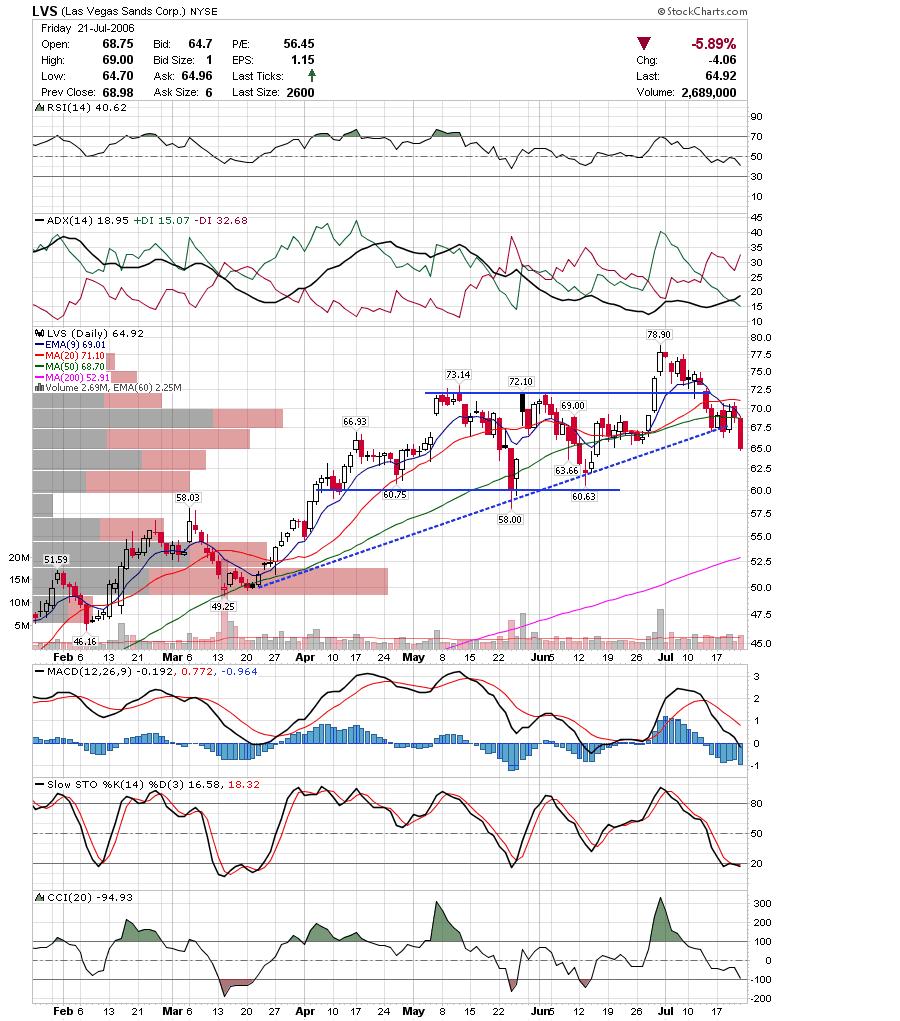
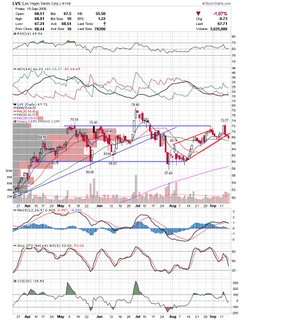
 LVS looks like it is done here. It tried to rally and gave back all the gains the next day. It is leaning out of a rising wedge in what could be the right shoulder of a Head and Shoulders top. LVS looks like it is done here. It tried to rally and gave back all the gains the next day. It is leaning out of a rising wedge in what could be the right shoulder of a Head and Shoulders top.
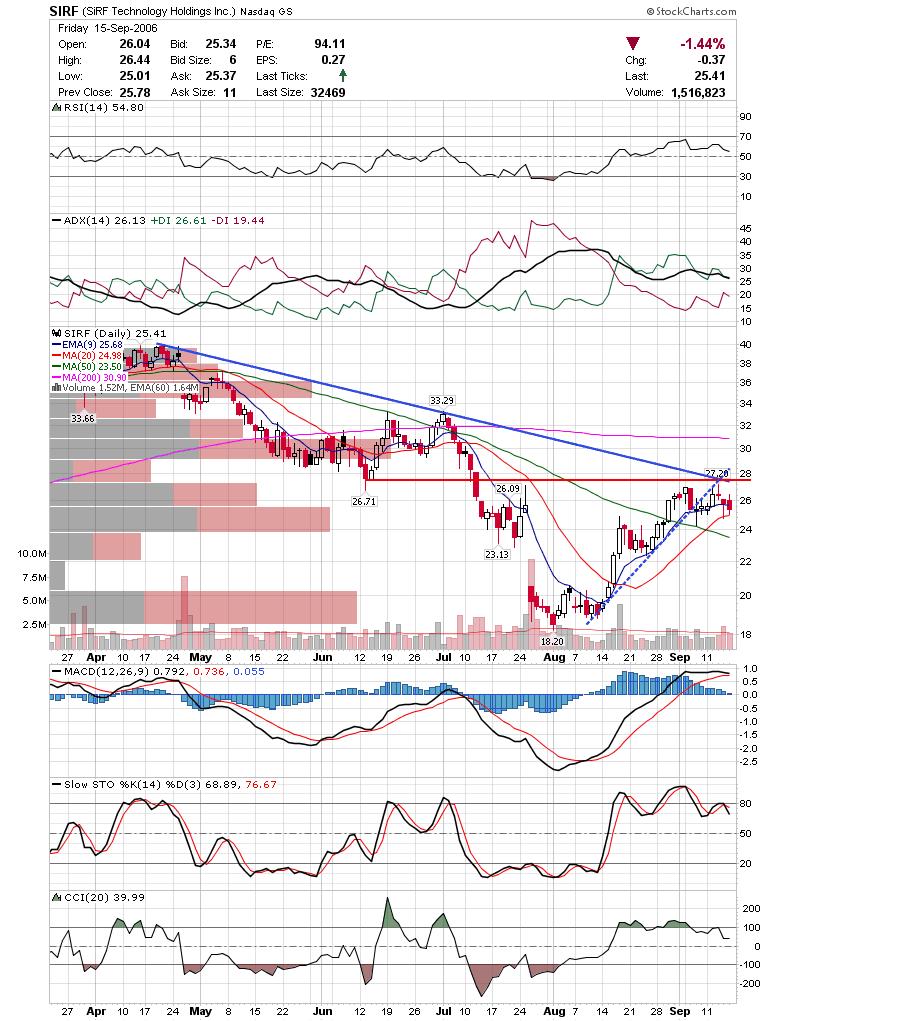
 SIRF is another short chart that may be failing at a declining trendline. MACD is about to cross as well. SIRF is another short chart that may be failing at a declining trendline. MACD is about to cross as well.
 At this point I think it's best to either start nibbling on the short side or stay on the sidelines. The markets could get a push as the media frenzy on a new Dow high may get some people to chase, but the markets rarely break major resistance successfully if they are overbought before getting there. Shorting heavily could be quite dangerous as well, as bulls have been strong. As always, adhere to your plan and wait for the markets to confirm the move. At this point I think it's best to either start nibbling on the short side or stay on the sidelines. The markets could get a push as the media frenzy on a new Dow high may get some people to chase, but the markets rarely break major resistance successfully if they are overbought before getting there. Shorting heavily could be quite dangerous as well, as bulls have been strong. As always, adhere to your plan and wait for the markets to confirm the move.
Good Luck,
DT |
|
|
 [复制链接]