- 金币:
-
- 奖励:
-
- 热心:
-
- 注册时间:
- 2006-7-3
|
|

楼主 |
发表于 2009-3-18 21:13
|
显示全部楼层
On Vacation Posted by downtowntrader | 9/20/2007 11:18:00 PM | 0 comments »
I will be on a weekend vacation through Monday, so no charts till then.
Good Luck,
Joey
Stock Chart Analysis SLV Posted by downtowntrader | 9/19/2007 10:00:00 PM | 4 comments »
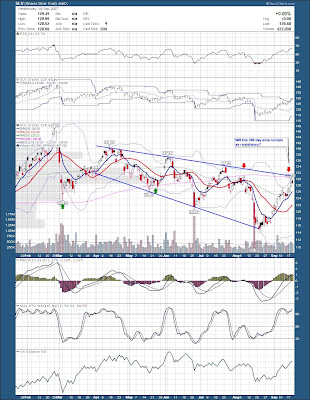
Stock Chart Analysis SLV
iShares Silver Trust (ETF) (Public, AMEX:SLV)
Gold and Silver have had a very sharp move recently, specifically heading into the much anticipated Fed release. While this could just be the beginning of something, it may of gotten ahead of itself in the near term. I'm not sure why there is a disconnect between Gold and Silver, but the GLD etf is at new yearly highs while SLV remains mired under it's 200 day sma. Looking at the chart of Silver below, it is pushing up against a trendline and it's 200 day sma which may prove to be a little much for it in it's extended state. I'm not sure if it will reverse here and retest the recent lows, but it seems like it will at least backoff and retrace to the 20 day sma. There could be some decent shorts in the sector, being that the miners are also overbought. I am looking at PAAS and SSRI as possibilities.
Good Trading,
Joey
for more analysis, check out downtowntrader.com
Stock Chart Analysis HMSY Posted by downtowntrader | 9/19/2007 09:45:00 PM | 0 comments »
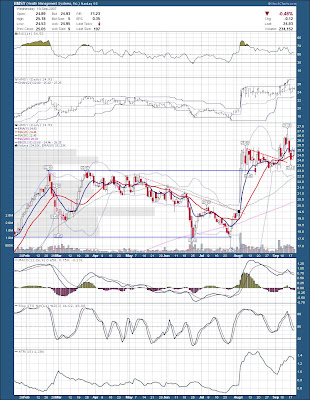
Stock Chart Analysis HMSY
HMS Holdings Corp. (Public, NASDAQ:HMSY)
While the markets are pretty overbought in the near term, there are still some stocks close to safe entries on the long side. I mentioned how HMSY broke out of a nice base a month ago, and while it did move out, it came back for a retest of support the past week or so. While there is a chance that HMSY had a false breakout and may of topped, you still have to favor the underlying trend until it is proven. HMSY is now sitting on it's 20 day sma, after a nice move on Fed Tuesday. It may consolidate a few more days, but I believe there is a good chance that it moves to fresh new highs soon.
Good Trading,
Joey
for more analysis, check out downtowntrader.com
Wedding Anniversary Posted by downtowntrader | 9/18/2007 06:23:00 PM | 0 comments »
Today is the 10th Anniversary of my wedding and as much as I would like to discuss the huge move after the Fed dropped rates, I don't think it would go over too well at home. The only move I made today was buying into BZH whom I had mentioned in earlier posts. I think there could be a massive squeeze in homebuilders, and in fact there could be a bottom on the BZH chart. I will try and post my thoughts on this tomorrow. One thing I will mention, right now a lot of people may be fearing they missed out. Keep in mind that these moves reverse some times and the prudent thing to do is not chase stocks. Stocks like WYNN, BIDU, RIMM and AMZN have had strong moves leading into todays move and buying now will likely have you underwater soon. Look for stocks like ONXX or DRYS who are starting to move after a pullback.
Good Trading,
Joey
Day Trading Posted by downtowntrader | 9/16/2007 10:21:00 PM | 0 comments »
With the Fed meeting coming up on Tuesday, and all the uncertainty, I think it makes sense to not recommend new swing trades until after the reaction. I will not be initiating new positions other then daytrades as well. One group that looks promising for tomorrow (daytrades) are homebuilders. It looks like they may get a short squeeze heading into a fed meeting where a rate cut seems like a foregone conclusion. They may keep running after the decision as well, but who knows at this point. I'm looking at BZH as a possibility here. Also, momentum stocks like AMZN, BIDU, RIMM, WYNN, LVS, etc. have been giving good intraday moves.
Good Trading,
Joey
Stock Chart Analysis HDNG Posted by downtowntrader | 9/12/2007 09:44:00 PM | 1 comments »
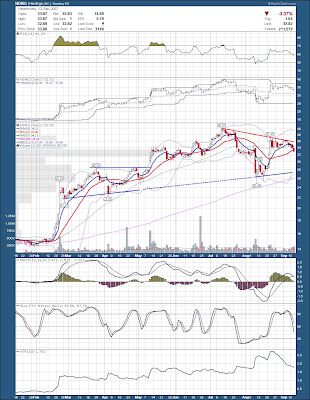
Stock Chart Analysis HDNG
Hardinge Inc. (Public, NASDAQ:HDNG)
While I'm not advocating going net short right now, I am taking some short positions if the chart setup looks decent. HDNG is one that may be rolling over and could offer a nice drop in quick order. HDNG had a sharp drop after reporting earnings in early August, but then had an equally sharp bounce higher a couple of weeks later. It has been struggling with the area highlighted below recently, and just lost the support of the 50 and 20 day sma's. While I won't ignore the recent strength in this stock, the fact is it could be rolling over and may drop all the way to the trend line near 28. The risk may well be worth the potential reward.
Good Trading,
Joey
for more analysis, check out downtowntrader.com
Investopedia Article Posted by downtowntrader | 9/11/2007 08:26:00 PM | 10 comments »
I had a new article (Multiple Timeframes can Multiply Returns) published on Investopedia.com today. If you're interested, check it out. Comments are always welcome. If you haven’t caught any of my previous articles and are interested, you can find them in my Articles and Interviews section. Good Trading,
Joey
Stock Chart Analysis CPLA Posted by downtowntrader | 9/09/2007 08:35:00 PM | 0 comments »
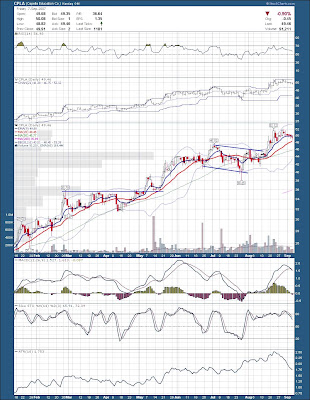
Stock Chart Analysis CPLA
Capella Education Company (Public, NASDAQ:CPLA)
CPLA has barely budged during the few recent weak market days and remains near all time highs. It has pulled back very gently to it's rising 20 day sma and could find support there. There is a decent chance it pulls back further, but I'm keeping an eye on it in case it decides to break out here.
Good Trading,
Joey
for more analysis, check out downtowntrader.com
Stock Chart Analysis KCI Posted by downtowntrader | 9/09/2007 08:28:00 PM | 0 comments »
Stock Chart Analysis KCI
Kinetic Concepts, Inc. (Public, NYSE:KCI)
KCI gapped out of a base in late July and has had some volatile swings as it tries to consolidate the break out. If pulled back to the breakout area and is trying to re-establish the prior uptrend. It reclaimed the 20 day sma and appears to be using it for support. It is close to breaking the downtrend line shown below and could break to new highs soon if the markets cooperates.

Good Trading,
Joey
for more analysis, check out downtowntrader.com
Stock Chart Analysis ANIK Posted by downtowntrader | 9/06/2007 09:43:00 PM | 2 comments »
Stock Chart Analysis ANIK
Anika Therapeutics, Inc. (Public, NASDAQ:ANIK)
ANIK is a very low float trader, but the chart here looks solid enough to possibly risk a trade. I hate trading these sometimes because it's difficult to get out if you have a larger position, so I try to keep the positions fairly small. ANIK, much like most of the stock market corrected pretty steeply the past month. It's come back a decent amount, and is now drifting back to the 20 day sma. Sometimes these little pullbacks are weak longs locking in profits and with good money management, provide great entries. ANIK may break out if it can climb above the descending trend line shown below.

Good Trading,
Joey
for more analysis, check out downtowntrader.com
Stock Chart Analysis MVIS Posted by downtowntrader | 9/05/2007 09:20:00 PM | 0 comments »
Stock Chart Analysis MVIS
Microvision, Inc. (Public, NASDAQ:MVIS)
I've trade MVIS a few times this year, mostly successfully. Recently, they reported a deal with Motorola and instead of rocketing higher, it steadily sold off giving back all the post news gains. It kept dropping testing prior swing lows. I've been a bystander in this stock the past few months waiting for a low risk opportunity. Recently, it threatened to break down from an established support line, but held up, and then had a move yesterday making it back above the 50 day sma. This could of cemented the bottom here, and paves the way for a retest of the recent highs. At worst, at least now there is a clearly defined stop loss for a swing trade.
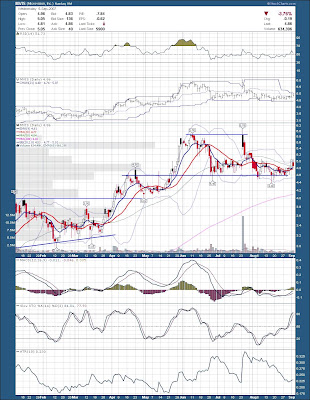
The nice thing about this possible trade setup, is that the longer term picture is pretty rosy for MVIS. It's always a good idea to trade with the larger trend, and there is no denying that MVIS has established a new uptrend. It is consistently making higher highs and lows on the weekly chart. It also clearly broke an established down trend line, and formed a confirmed reverse head and shoulders bottom. Volume is in all the right places, and it appears that this is a solid pattern. It's hard to project targets in low priced stocks, because the move from $1-4 is a 200% move yet the measured target is only 3 points from the breakout point. This still yields a conservative $7 target.

Today MVIS offered a pullback off yesterday's strong move, but held at the rising 20 and 50 day smas. This could be a decent low risk / high reward opportunity.
Good Trading,
Joey
for more analysis, check out downtowntrader.com
Disclaimer: I started a small position in MVIS today near the 50 sma. I am highlighting it because I will add to the position if it continues to move out.
Stock Chart Analysis PRSC Posted by downtowntrader | 9/05/2007 09:14:00 PM | 0 comments »
Stock Chart Analysis PRSC
The Providence Service Corporation (Public, NASDAQ:PRSC)
PRSC is coiling into a triangle after clearing a several month long tight base. Volume surged on the initial breakout and has been drying up as it consolidates. There was a strong candle that gapped under the base and then closed at new highs in mid August. Sometimes these moves catch a lot traders by surprise, including some institutions. The fallout sometimes takes weeks to sort out, but usually, it's in the direction of the initial surprise move.

Good Trading,
Joey
for more analysis, check out downtowntrader.com |
|
|
 [复制链接]


