- 金币:
-
- 奖励:
-
- 热心:
-
- 注册时间:
- 2006-7-3
|
|

楼主 |
发表于 2009-3-20 07:02
|
显示全部楼层
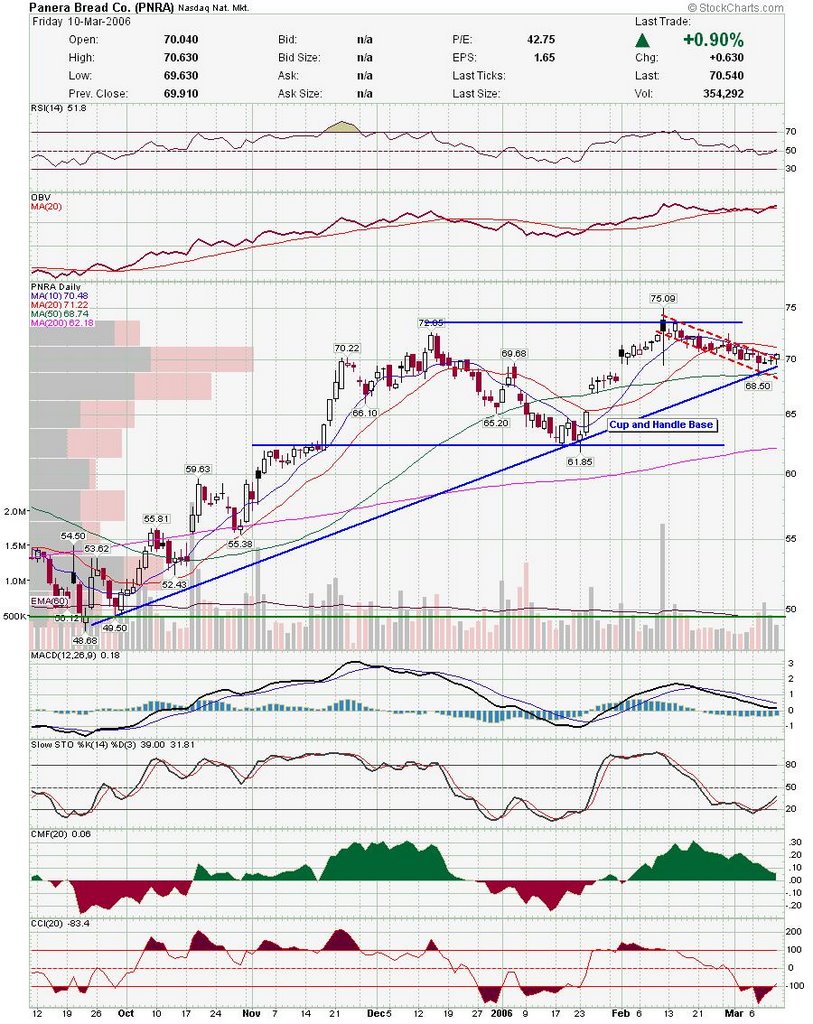
Is Gold entering a deeper correction? Posted by downtowntrader | 3/06/2006 10:39:00 PM | 0 comments »
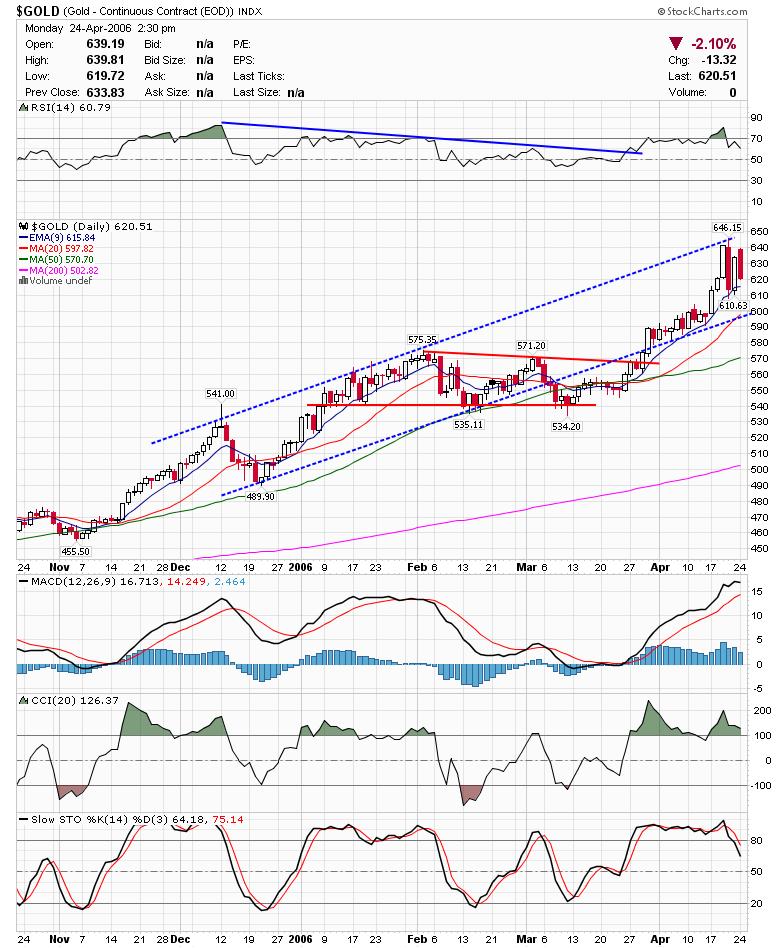
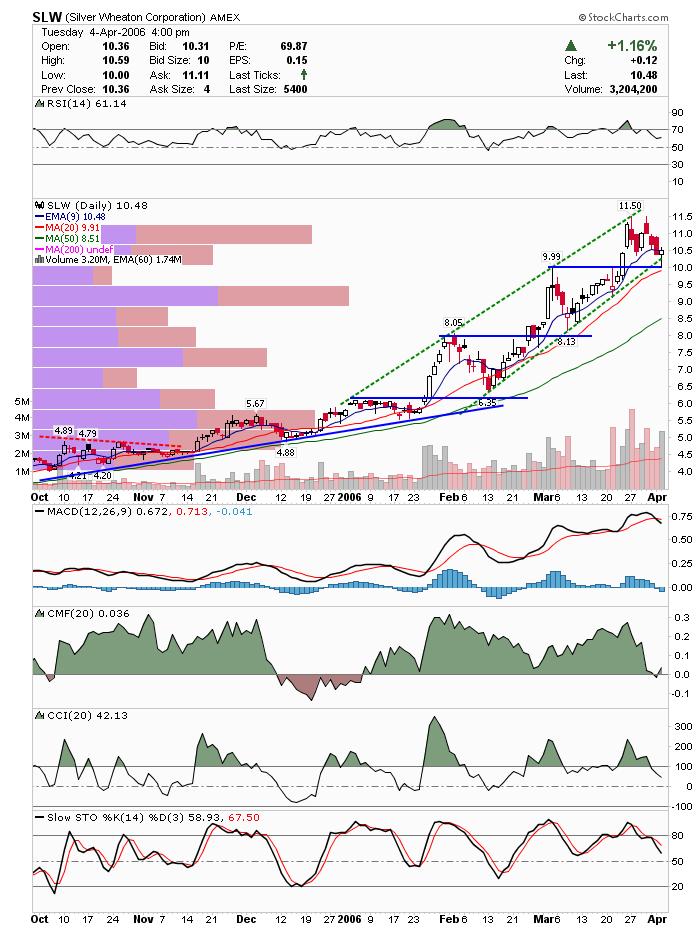
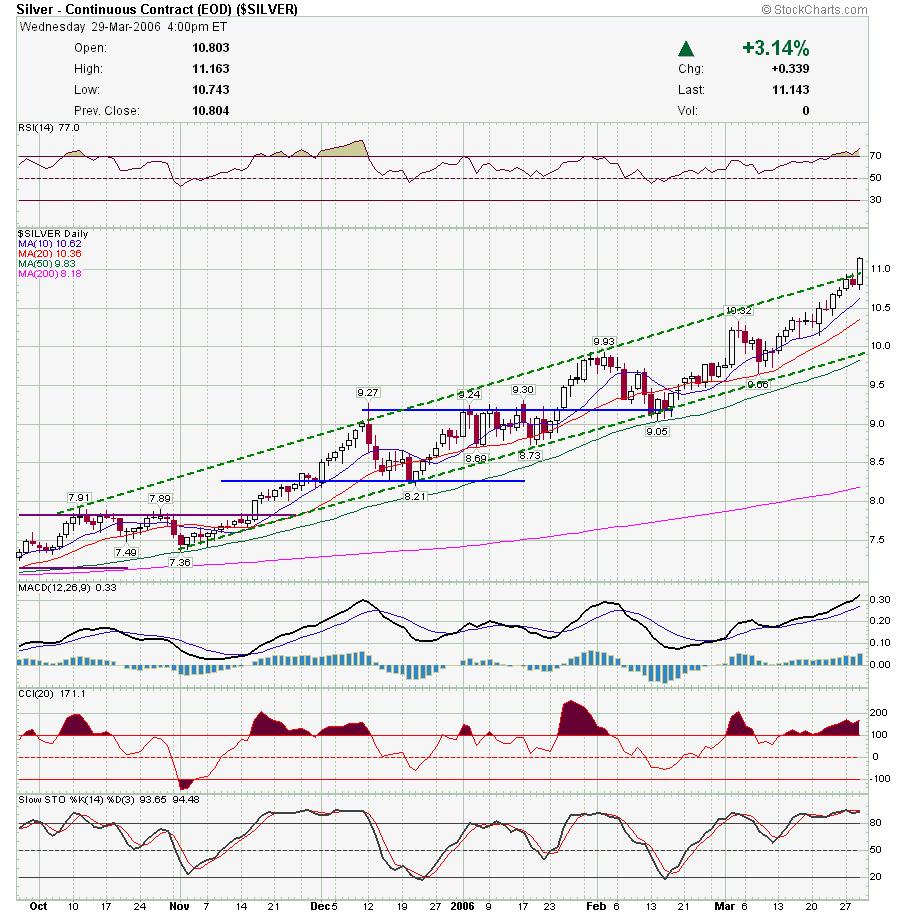
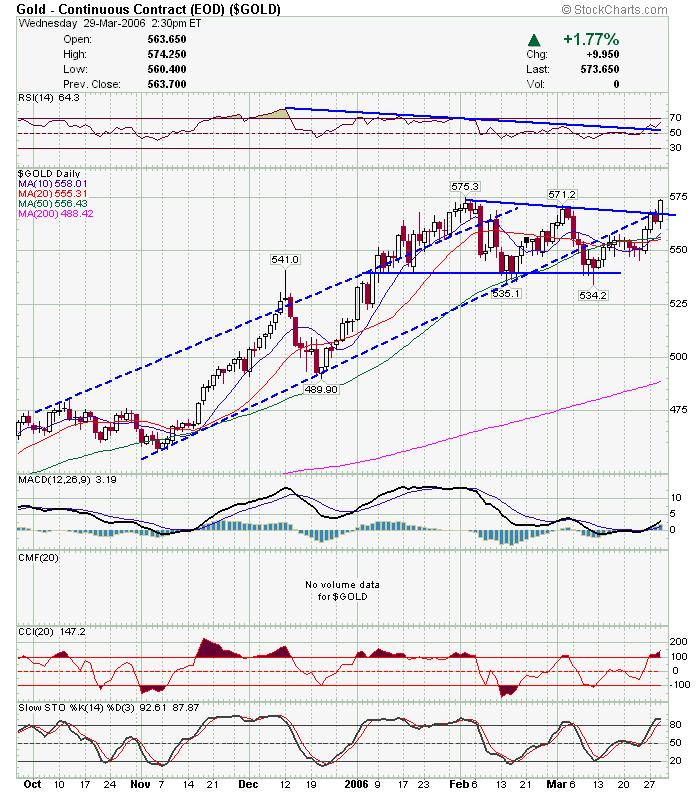
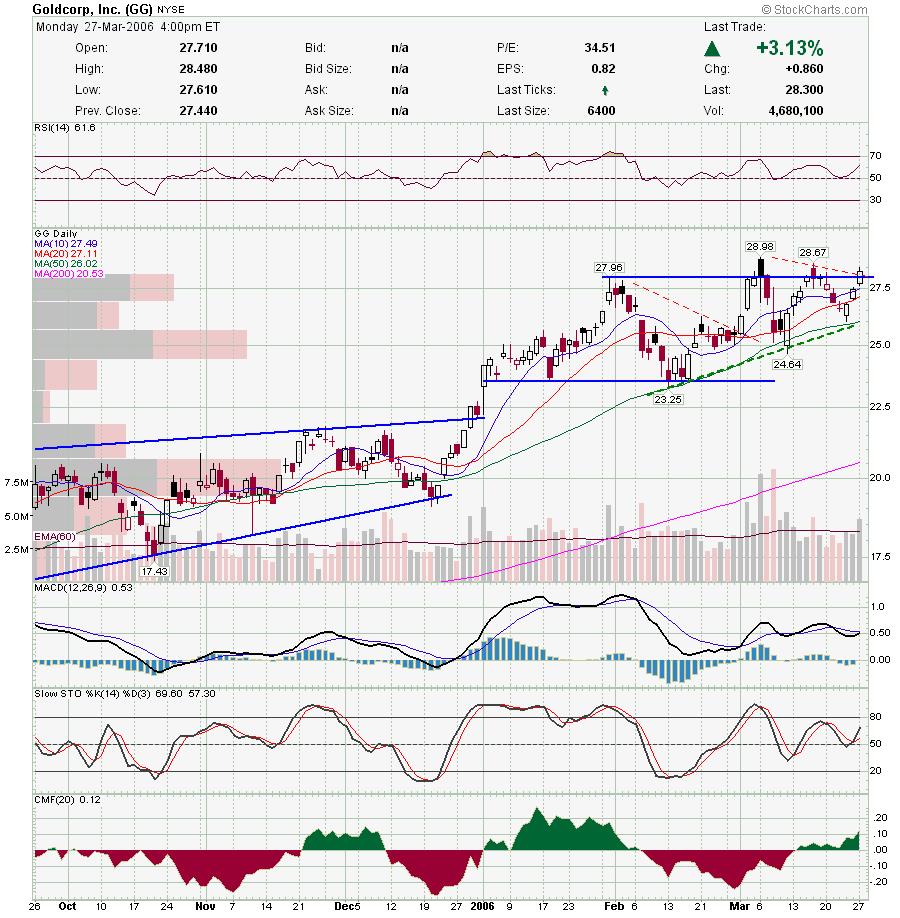
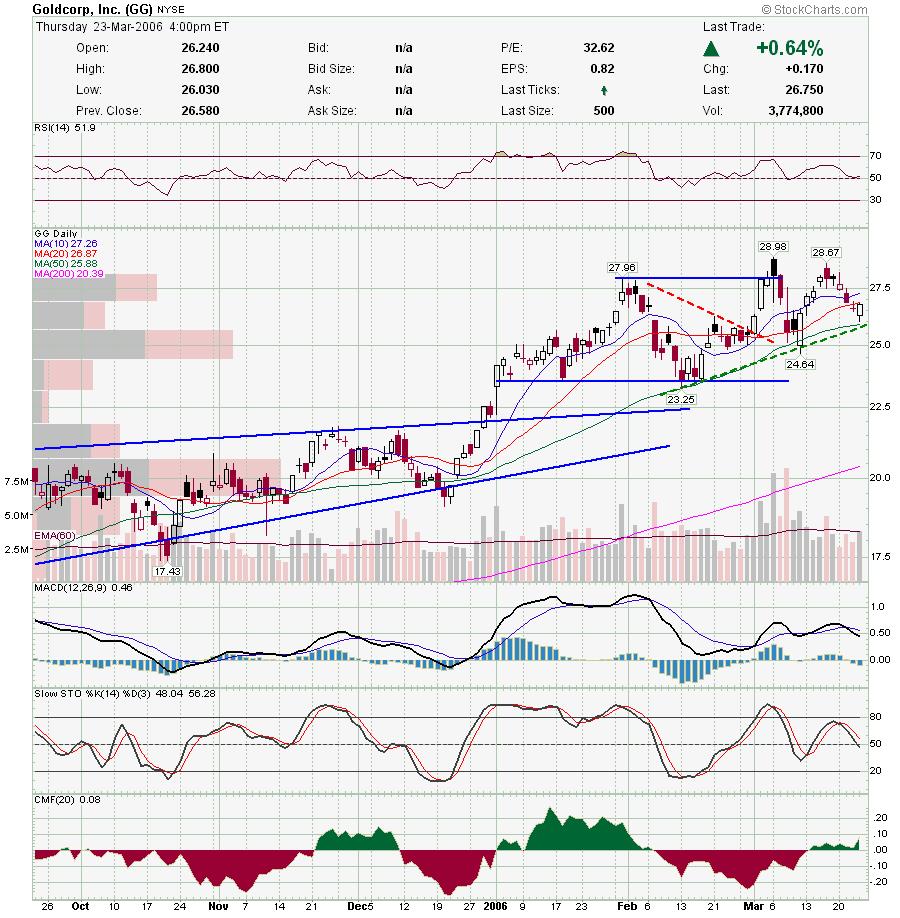
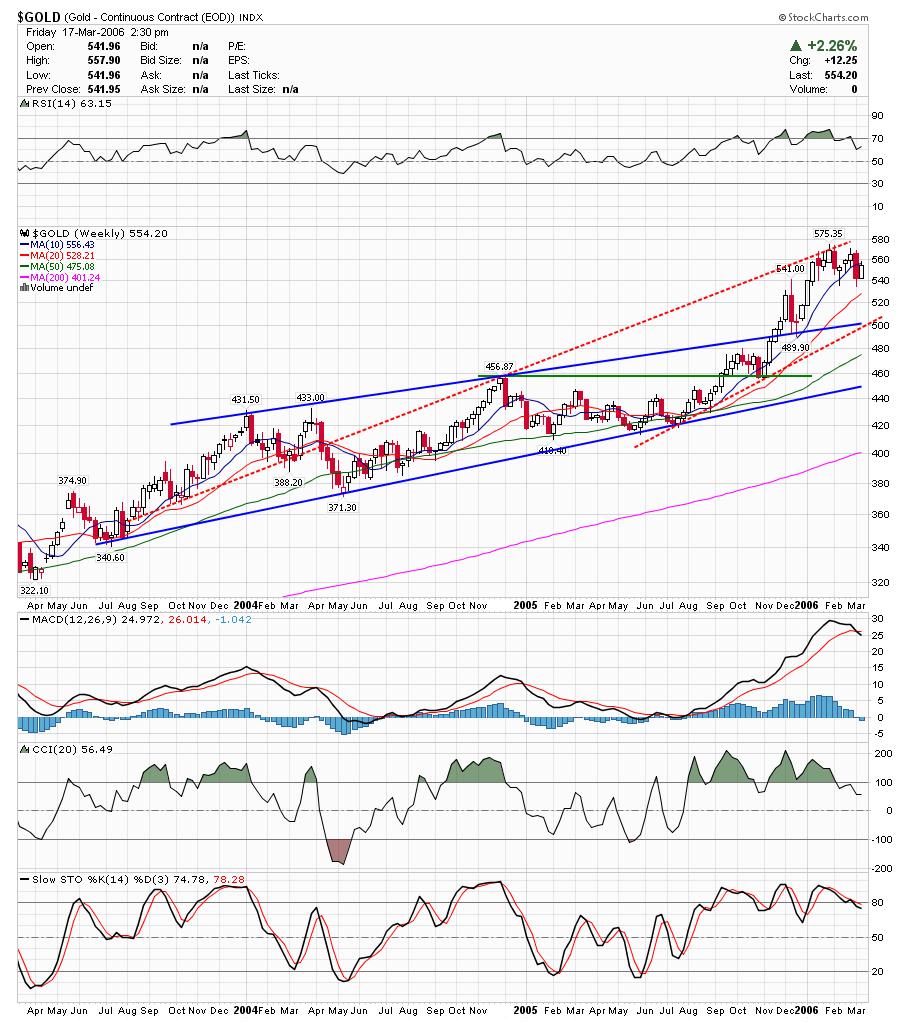
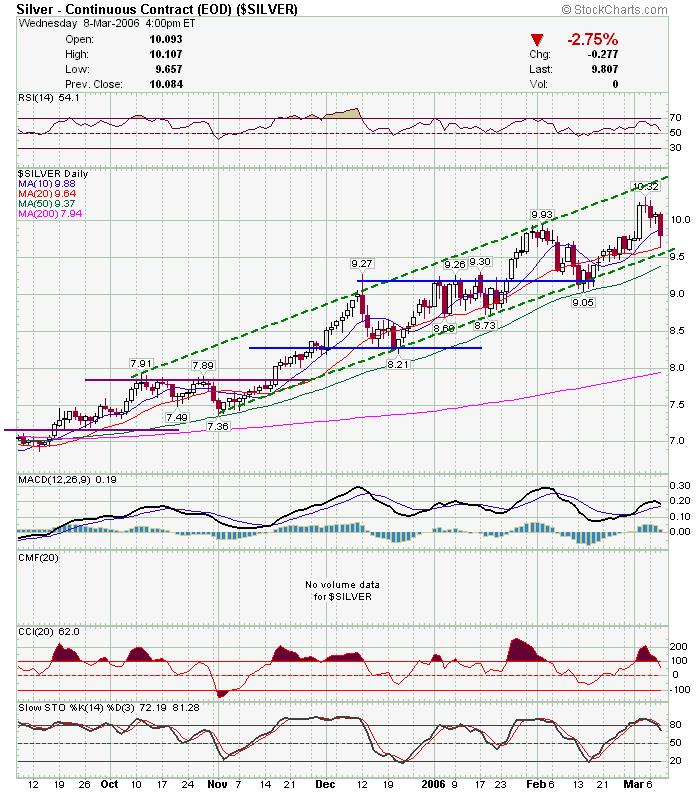
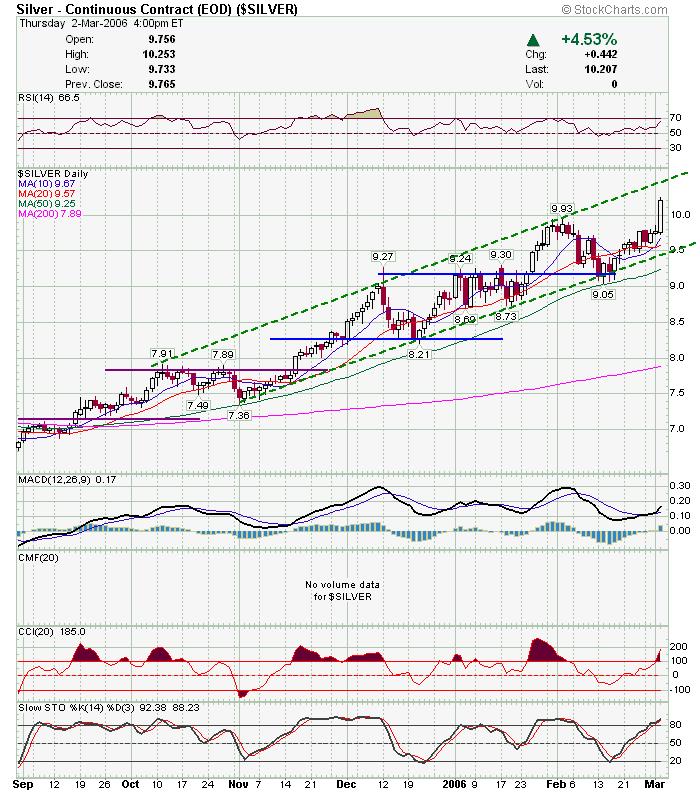
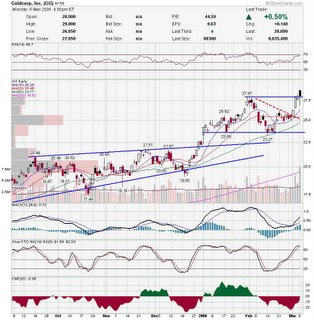
As I posted earlier, the divergence between GLD and gold stocks shouldn't last too long. I was expecting Gold stocks to turn up, and the did for a couple days, and now they all turned down in unison. There is a chance that we have made a near term top in gold, but we have to wait for confirmation. Here is a chart of GLD. GLD is an ETF that trades gold bullion. The gold index chart is similar to this one. It has been trading this channel nicely and bounced recently off the trendlline and 50sma. It started to trend higher before todays sharp pullback. Watch the trendline and 50sma over the next couple of days to see how GLD reacts.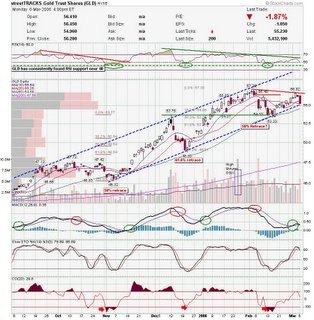 GG has been the strongest gold stock. They gapped higher on earnings news, and then pulled back most of the day until a little run in the afternoon. GG has been the strongest gold stock. They gapped higher on earnings news, and then pulled back most of the day until a little run in the afternoon.
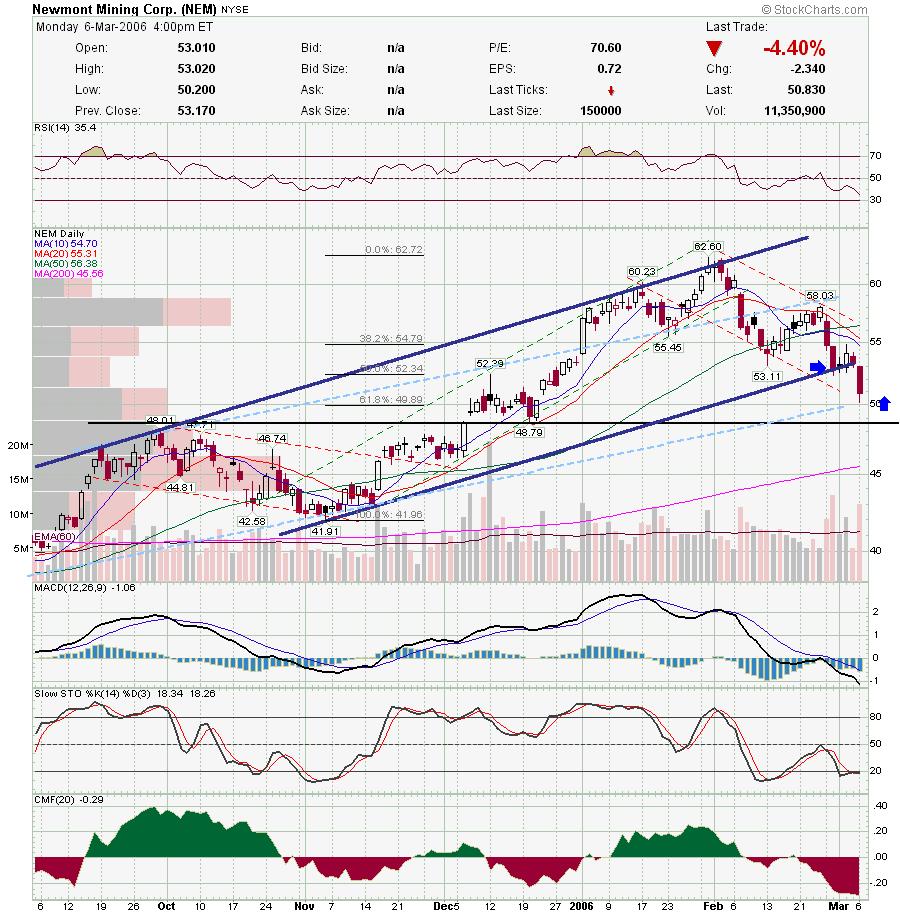
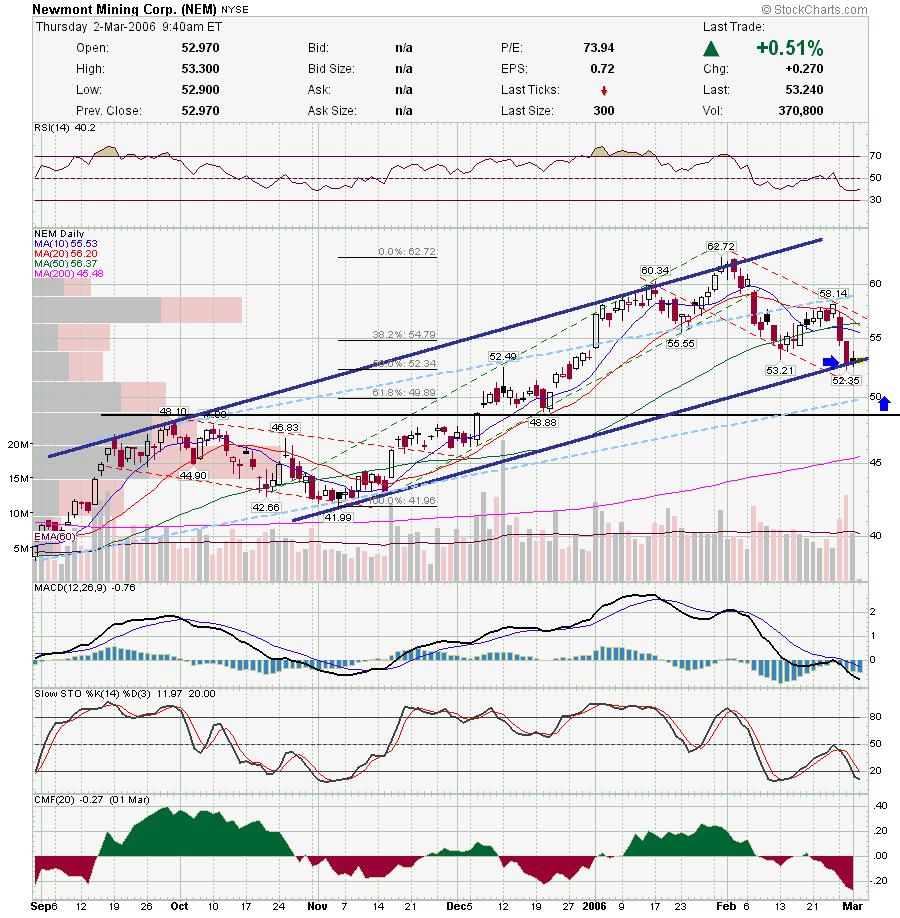
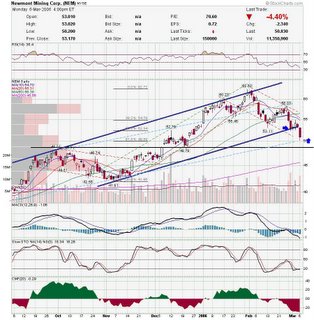
 NEM broke out of the primary channel, and may get a bounce in the previous channel. NEM broke out of the primary channel, and may get a bounce in the previous channel.
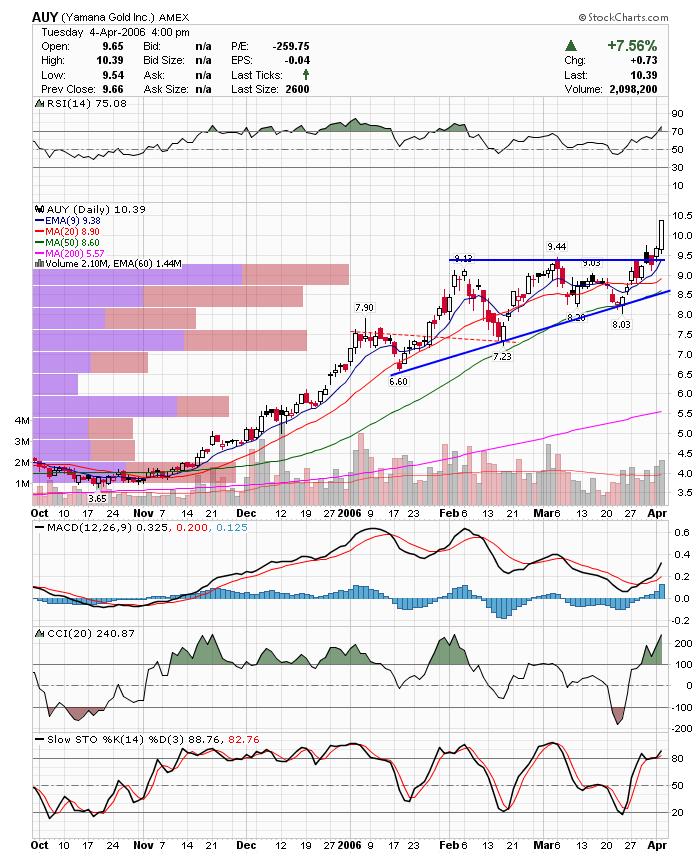
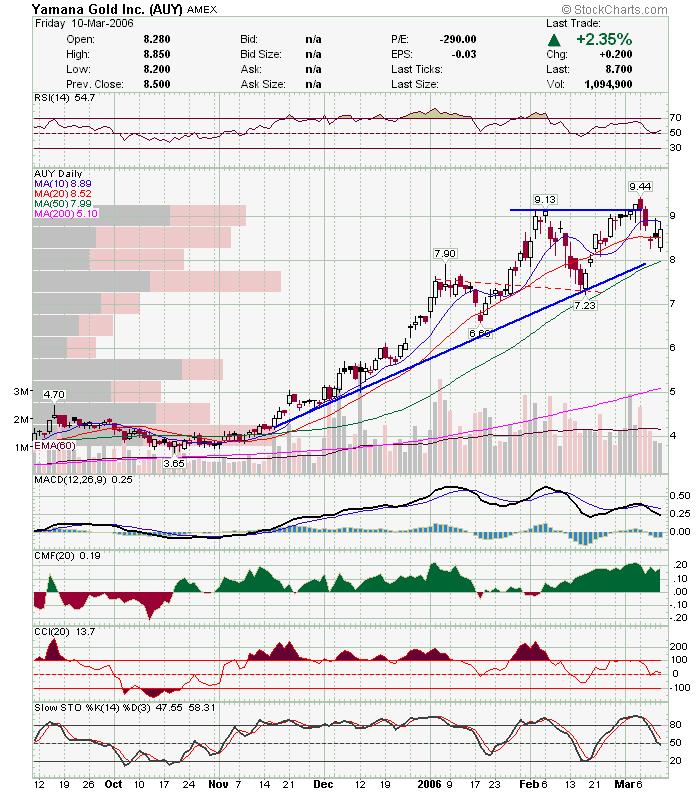
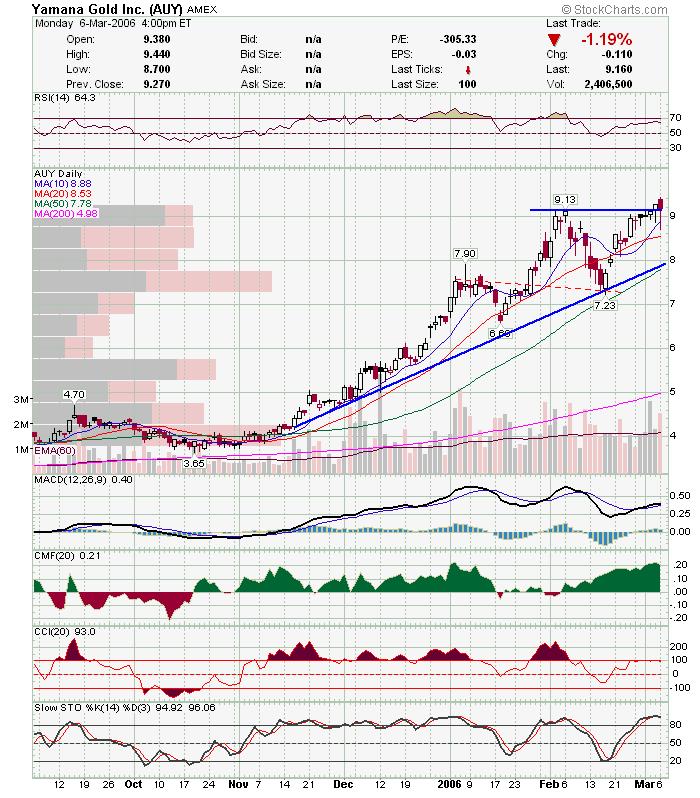
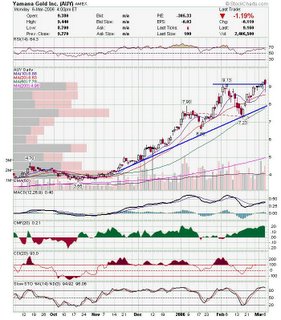
 AUY fought back today and closed above support. AUY fought back today and closed above support.
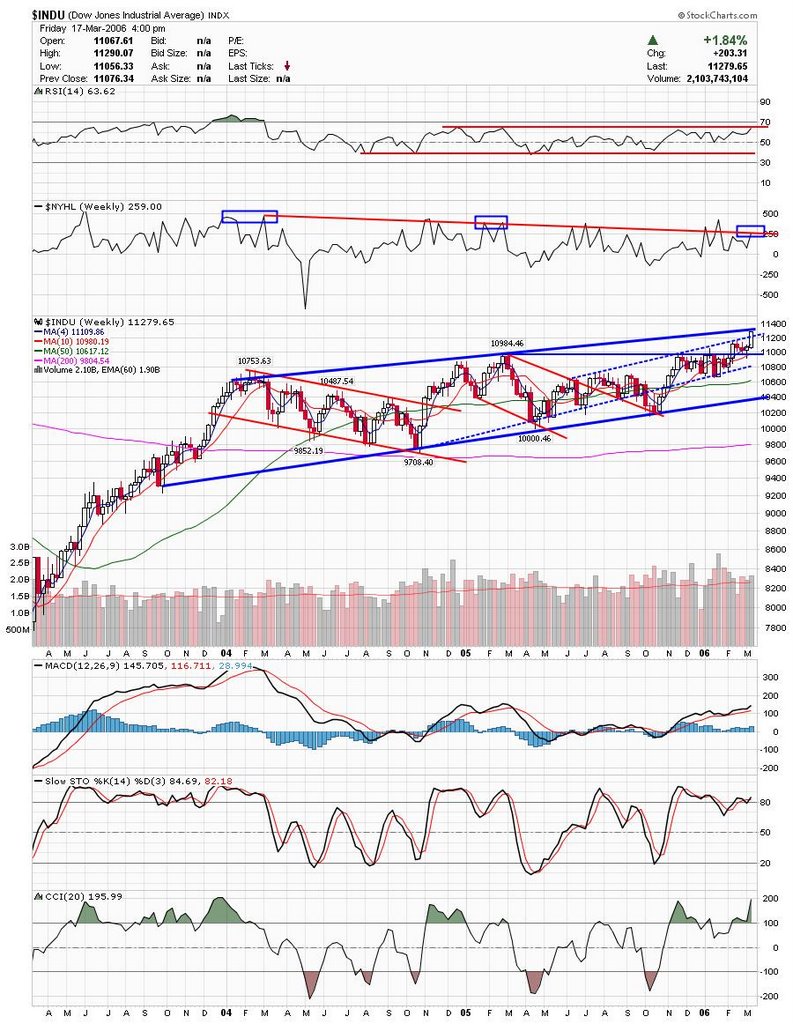
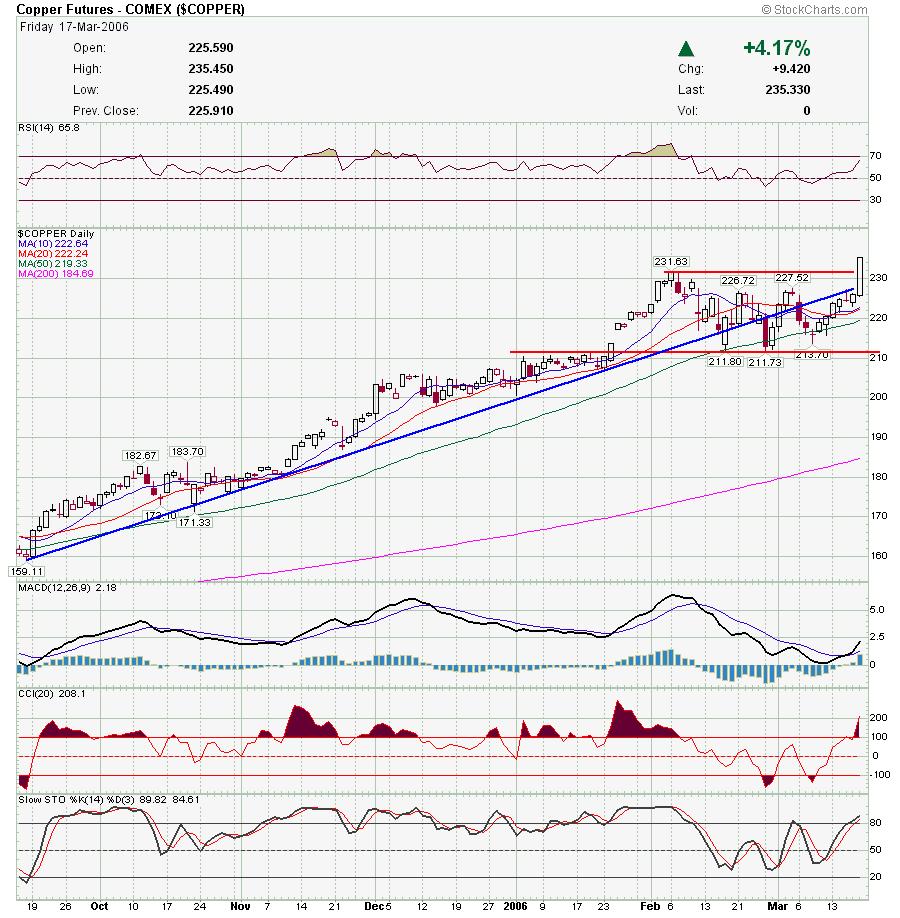
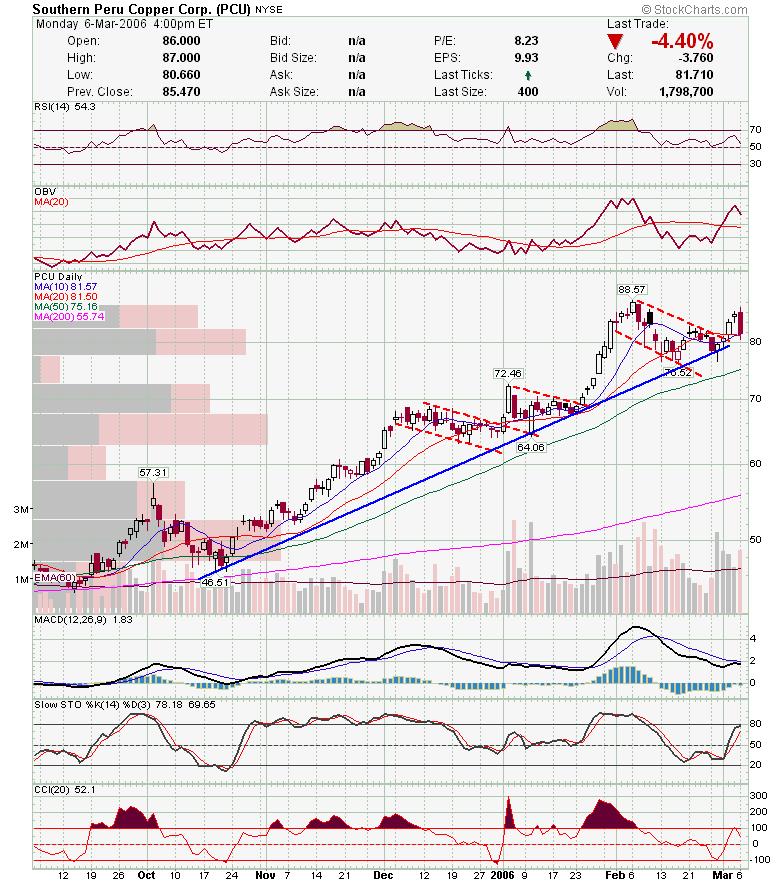
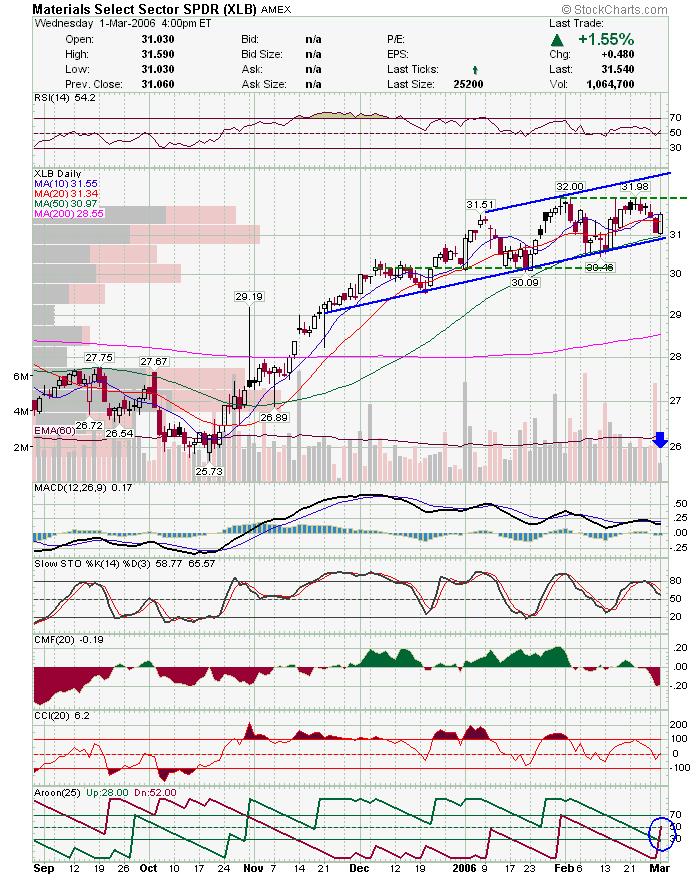
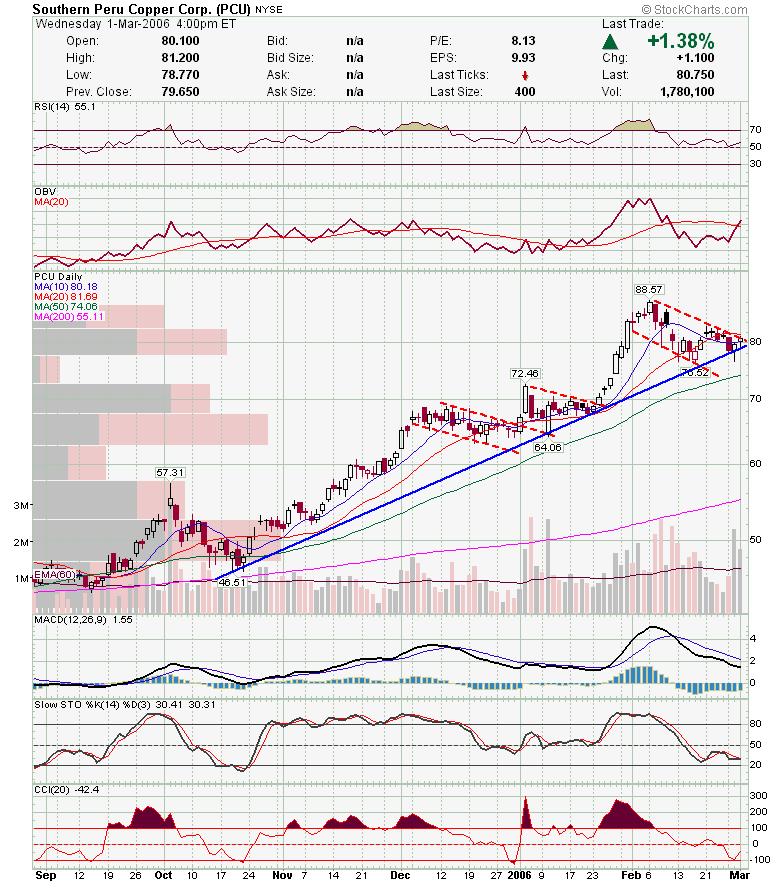
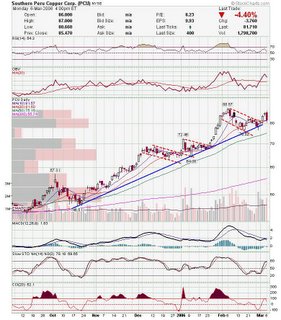
 PCU is not a gold stock, but I think it's worth mentioning that most metals trade together. PCU is near a trendline, and if we get a bounce in precious metals. I would expect PCU to follow suit. PCU is not a gold stock, but I think it's worth mentioning that most metals trade together. PCU is near a trendline, and if we get a bounce in precious metals. I would expect PCU to follow suit.
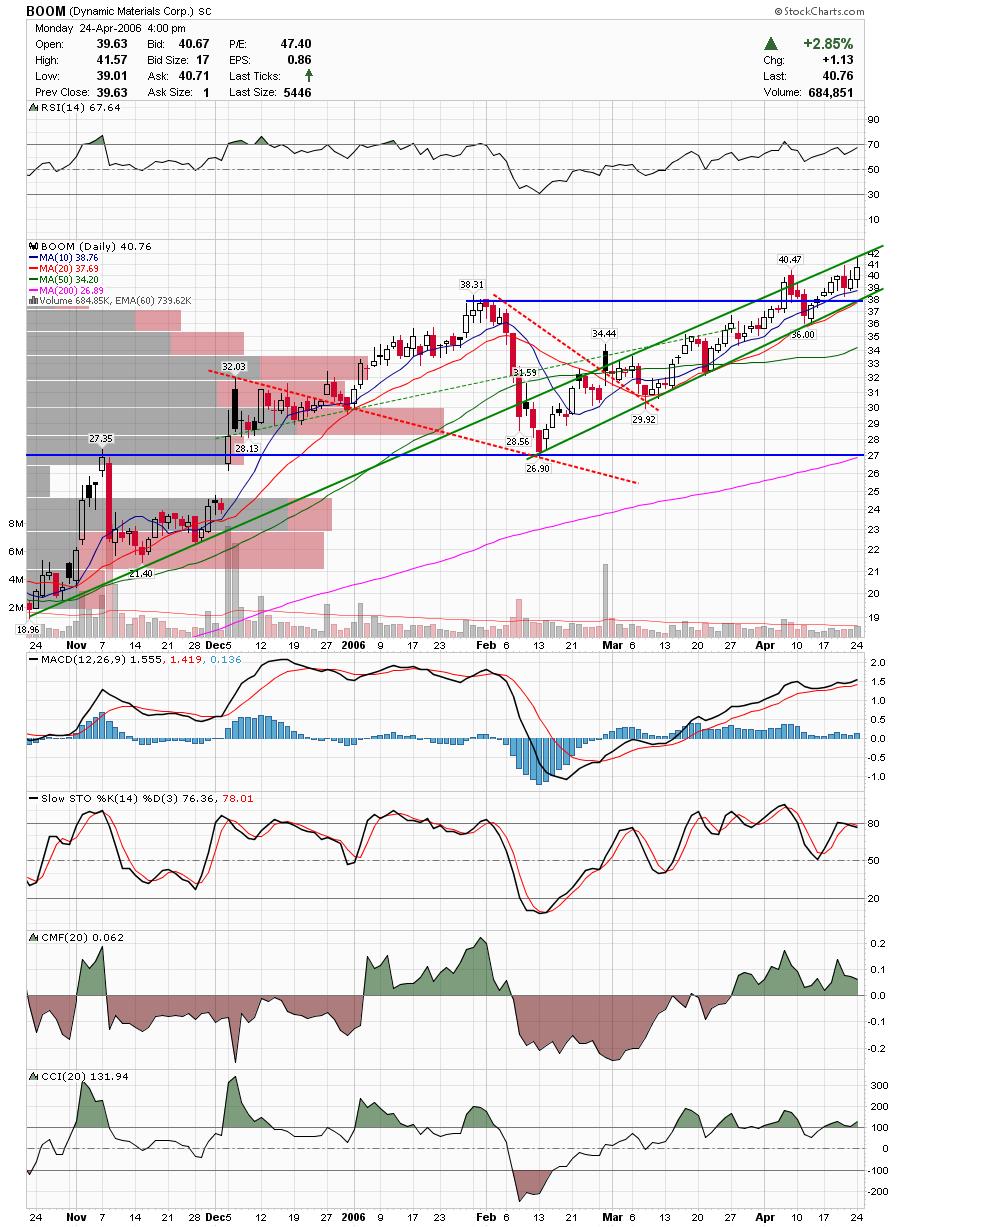
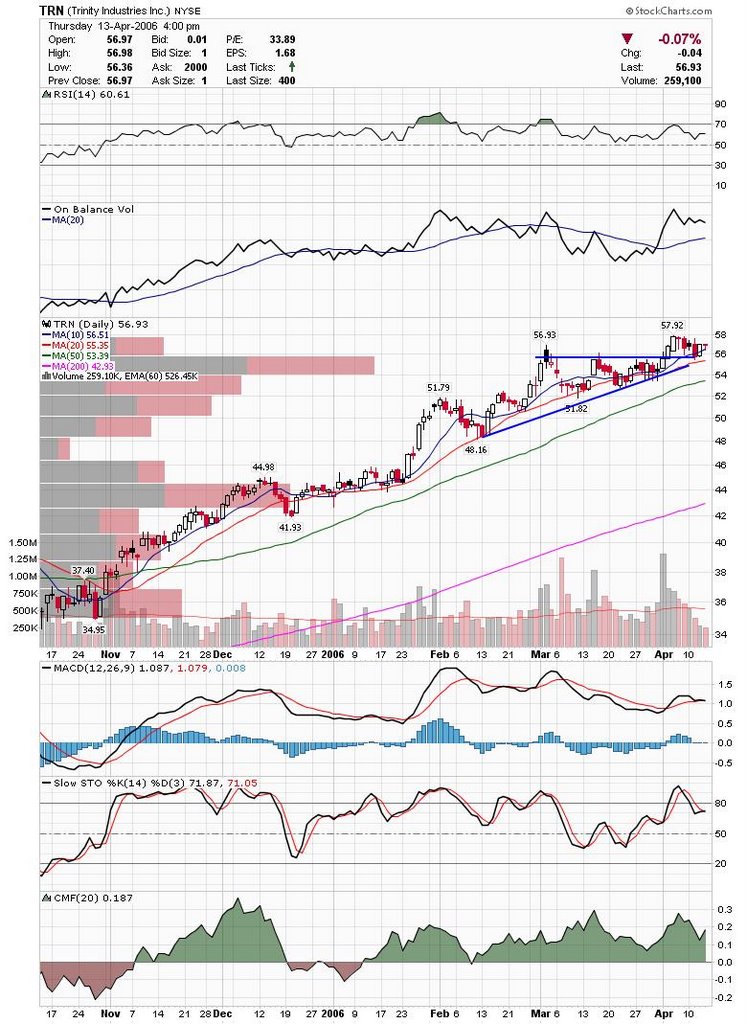
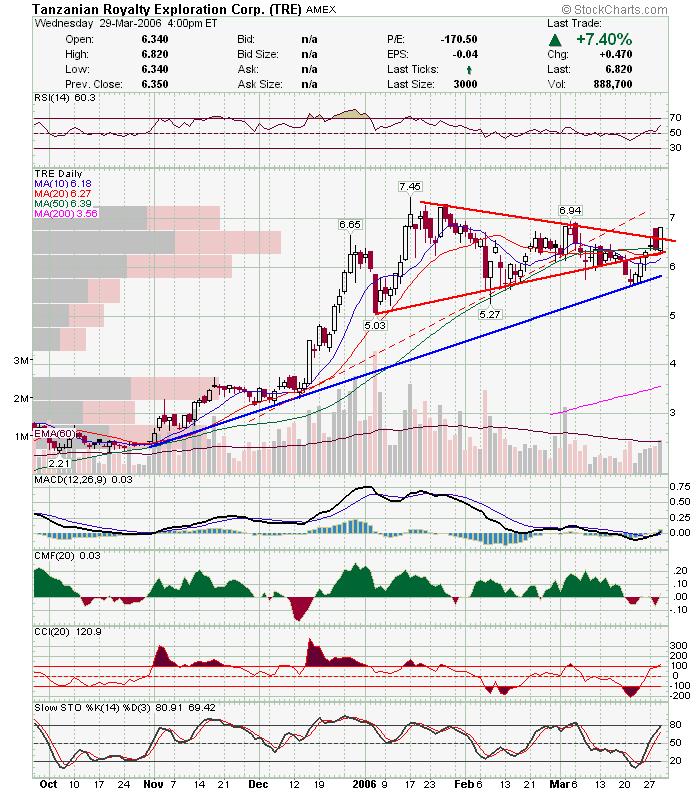
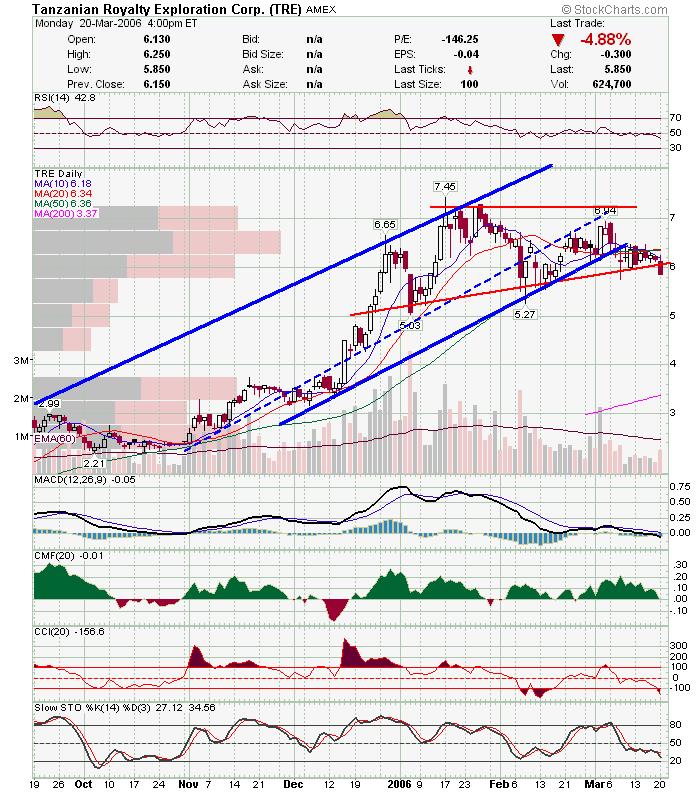
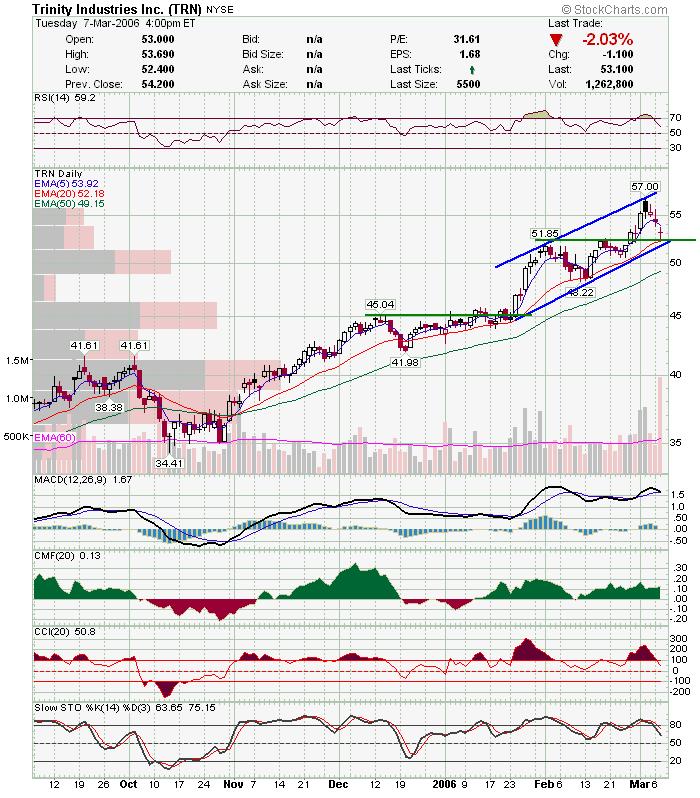
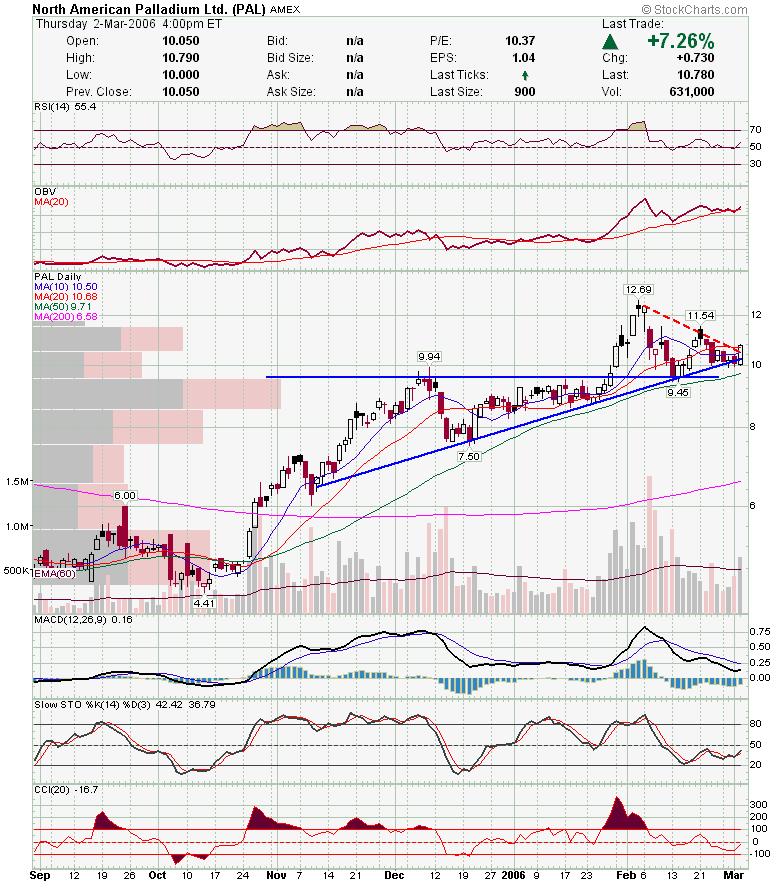
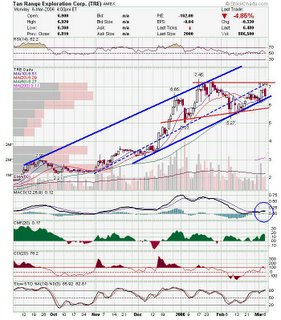
 TRE is has had support on this trendline before and is also trading in an ascending triangle base. TRE is has had support on this trendline before and is also trading in an ascending triangle base.
 Be sure to read my posts from last night below. Be sure to read my posts from last night below.
Good Luck,
DT
Monday Night Update Posted by downtowntrader | 3/06/2006 10:02:00 PM | 0 comments »
Here are some charts for tomorrow.
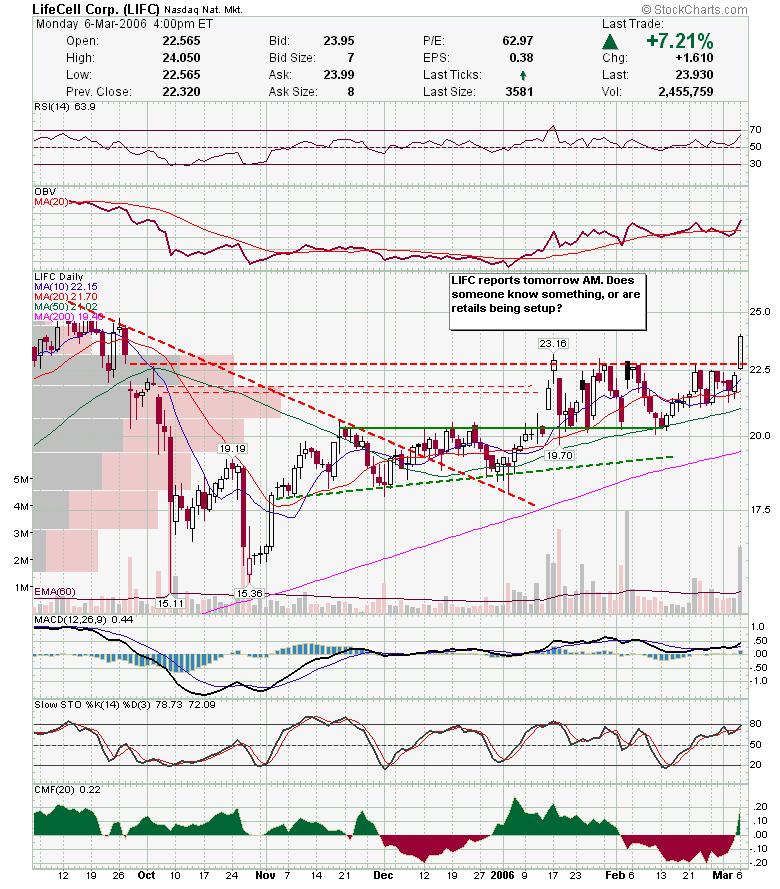
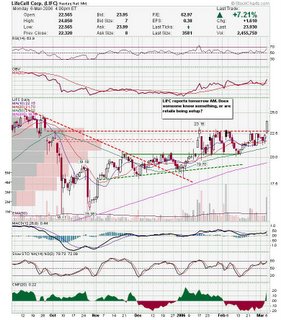
LIFC had a strong move prior to earnings release tomorrow. Let's see if someone knew something, or if retail's are getting screwed.
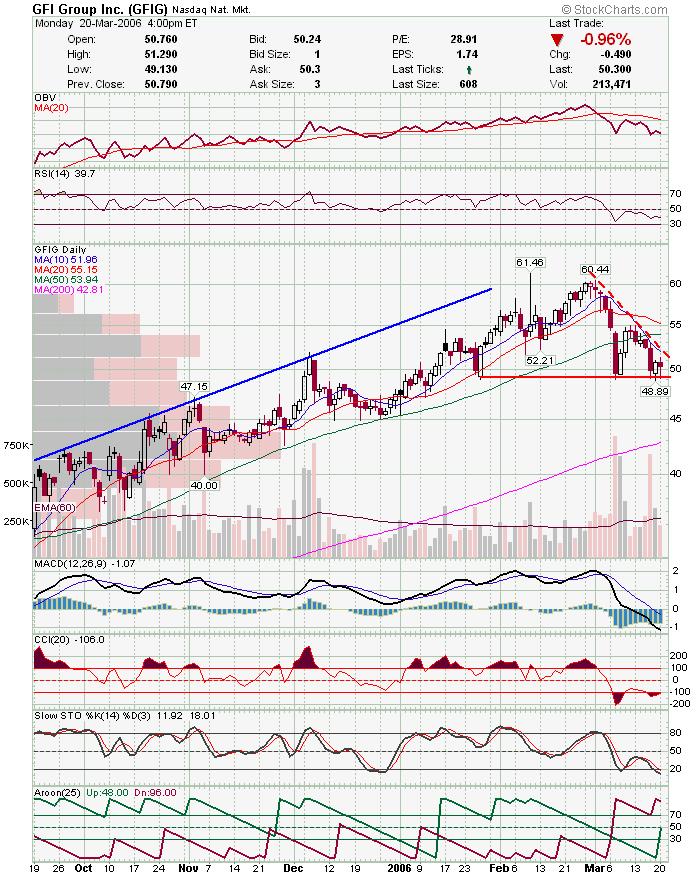
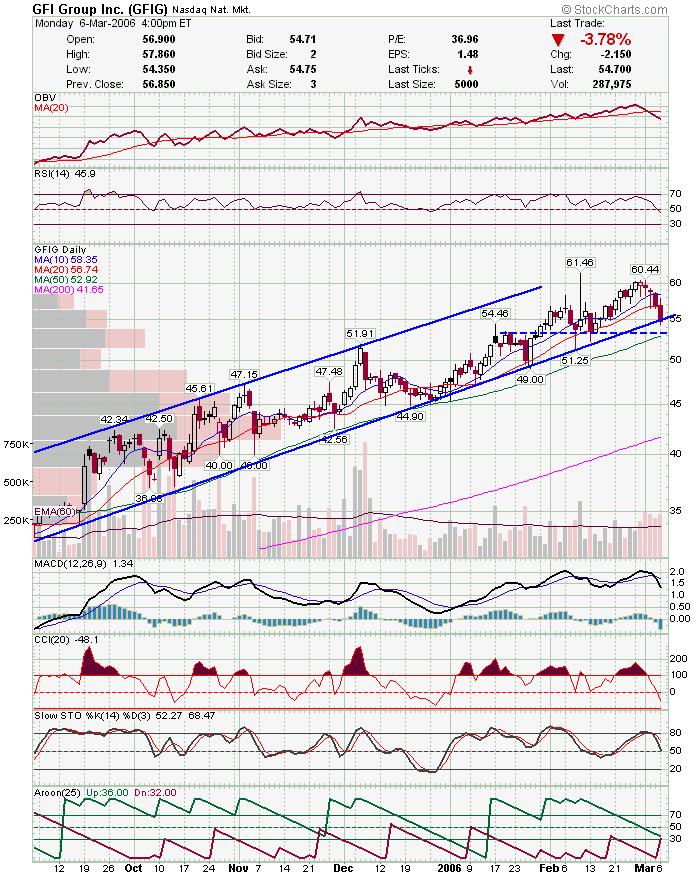
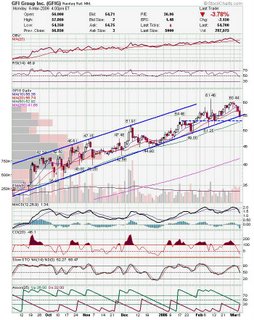
 GFIG is in danger of falling below channel. GFIG is in danger of falling below channel.
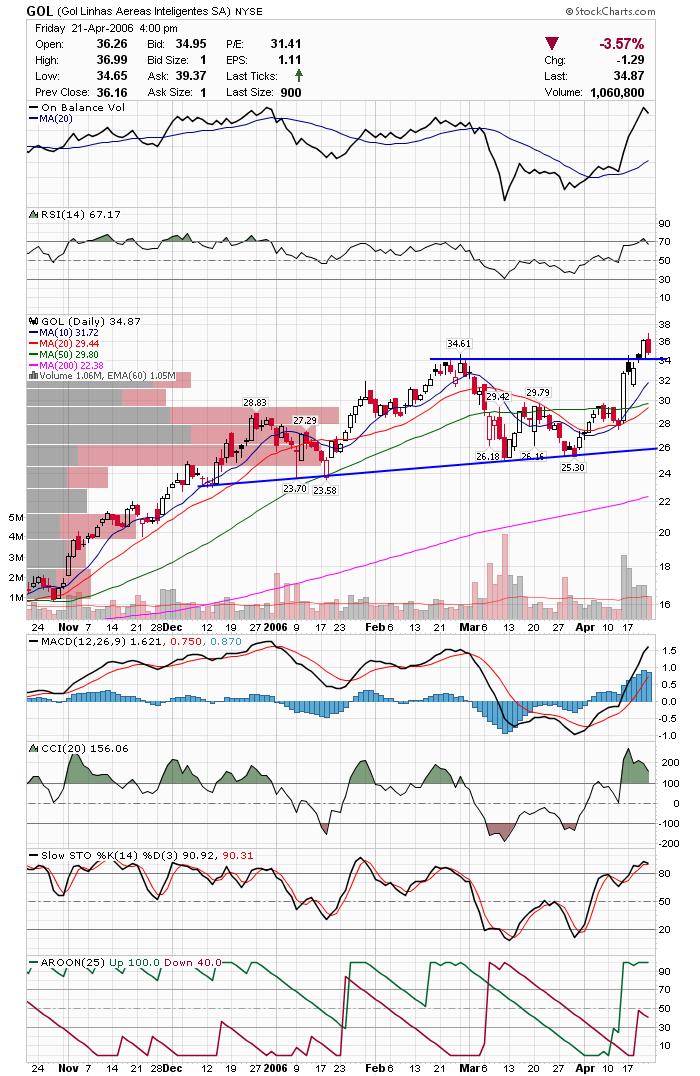
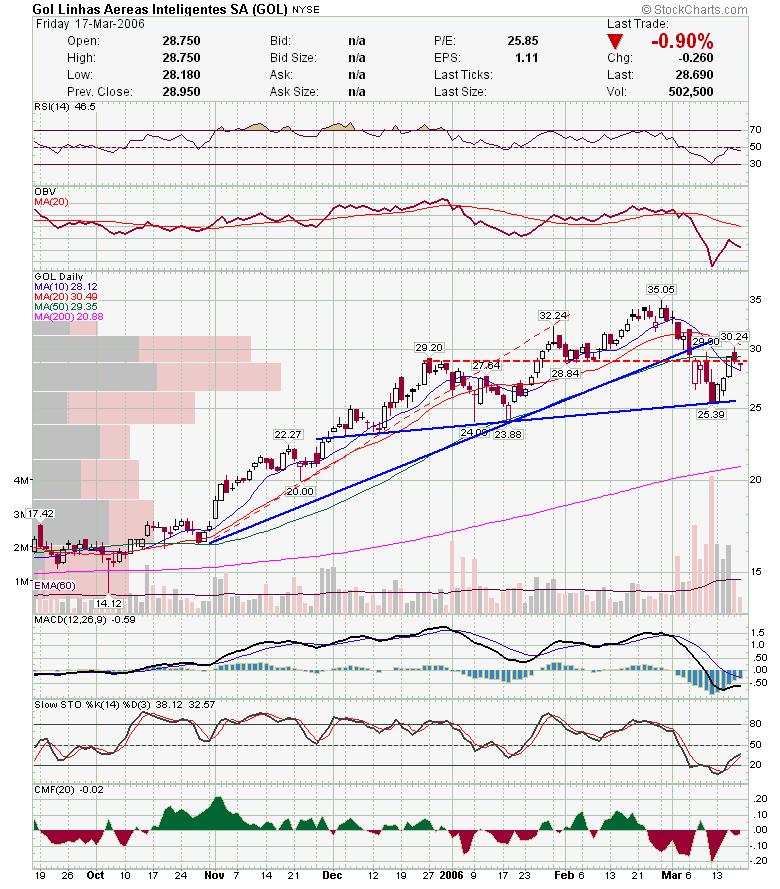
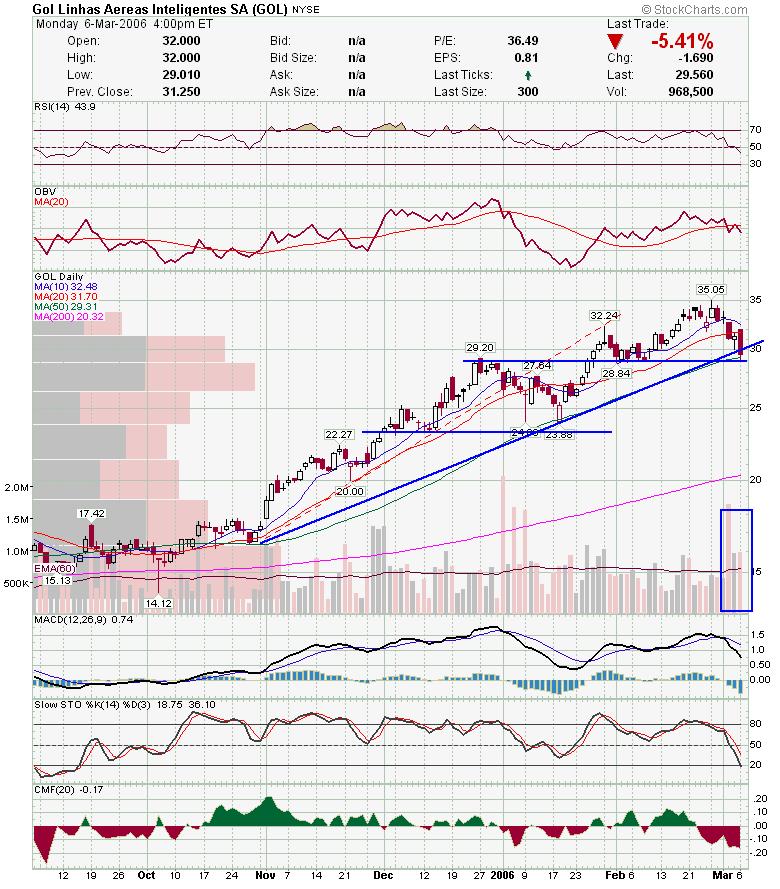
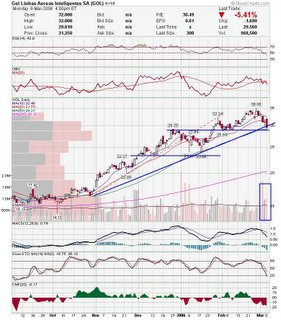
 GOL may break below support here. GOL may break below support here.
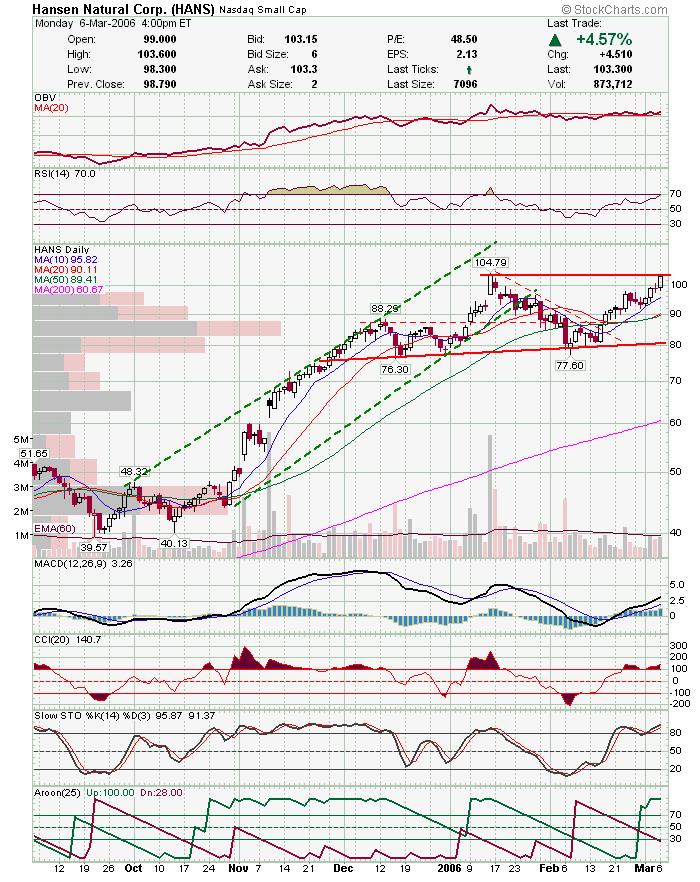
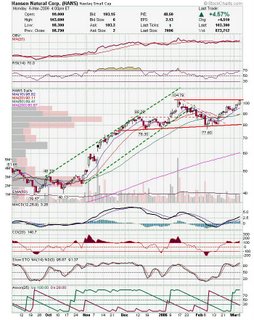
 HANS is acting like a leader again, and showed nice strength in a down market today. HANS is acting like a leader again, and showed nice strength in a down market today.
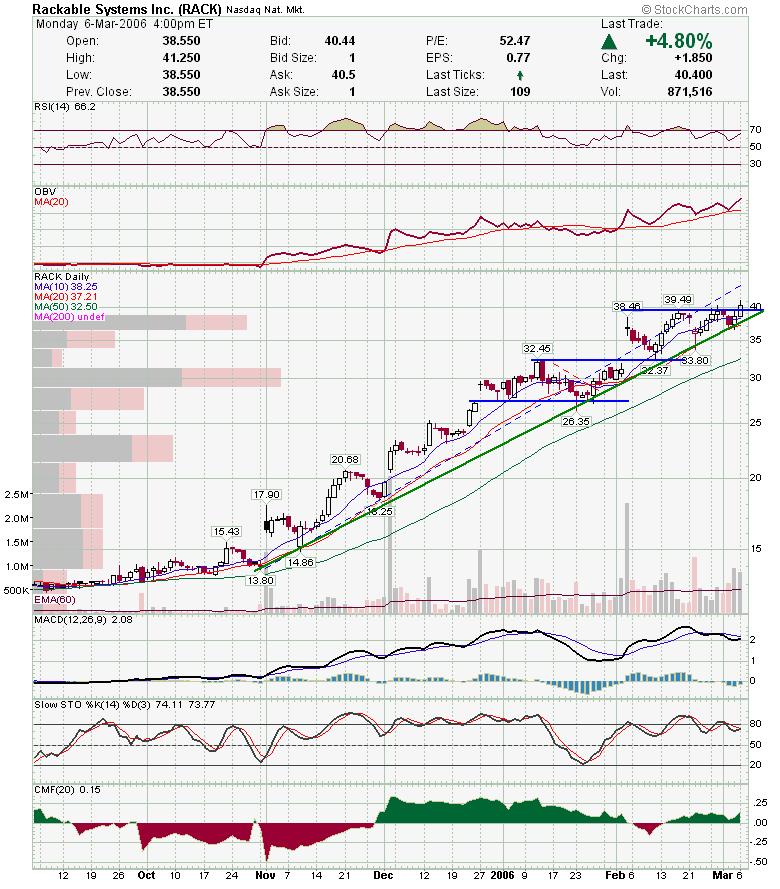
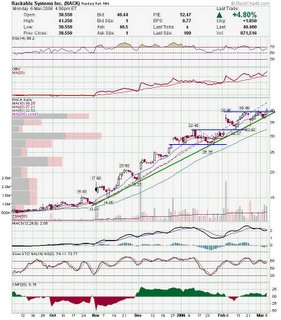
 RACK also showed strength and is trading near high. RACK also showed strength and is trading near high.
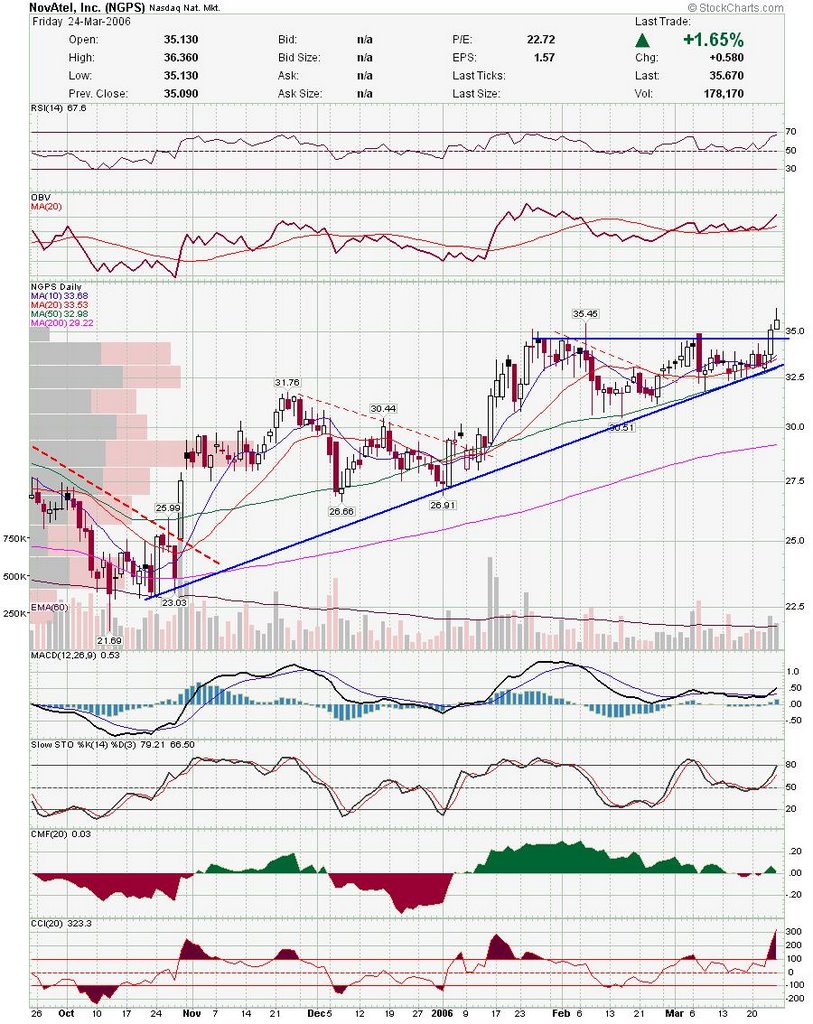
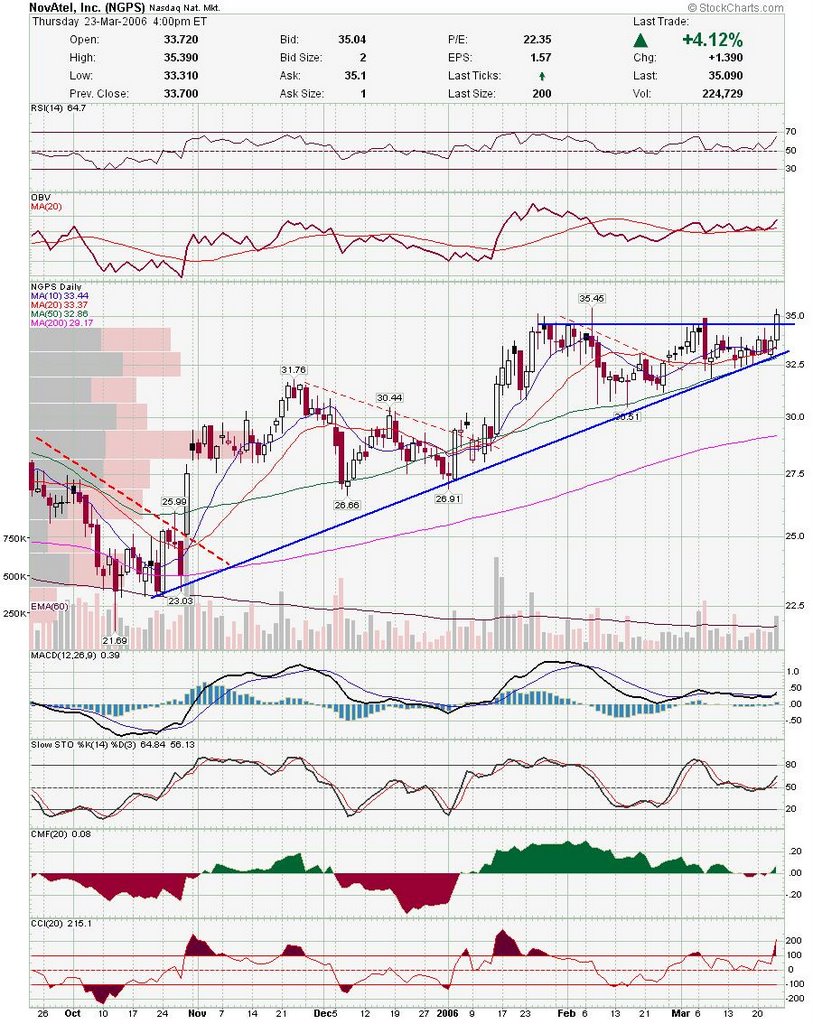
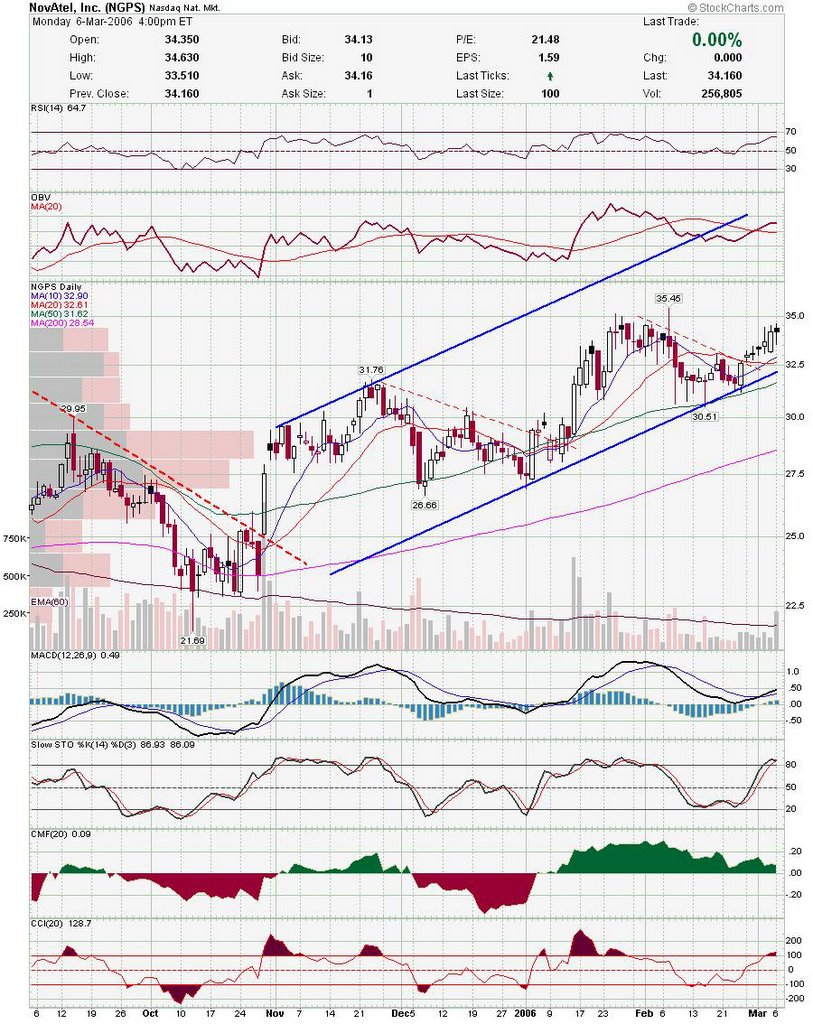
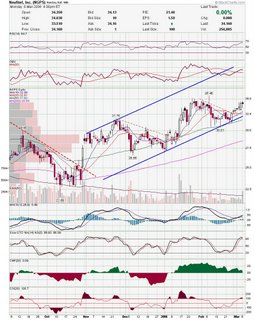
 NGPS has broken downtrend and is now in a nice little uptrend. They released after hours are were trading higher. NGPS has broken downtrend and is now in a nice little uptrend. They released after hours are were trading higher.
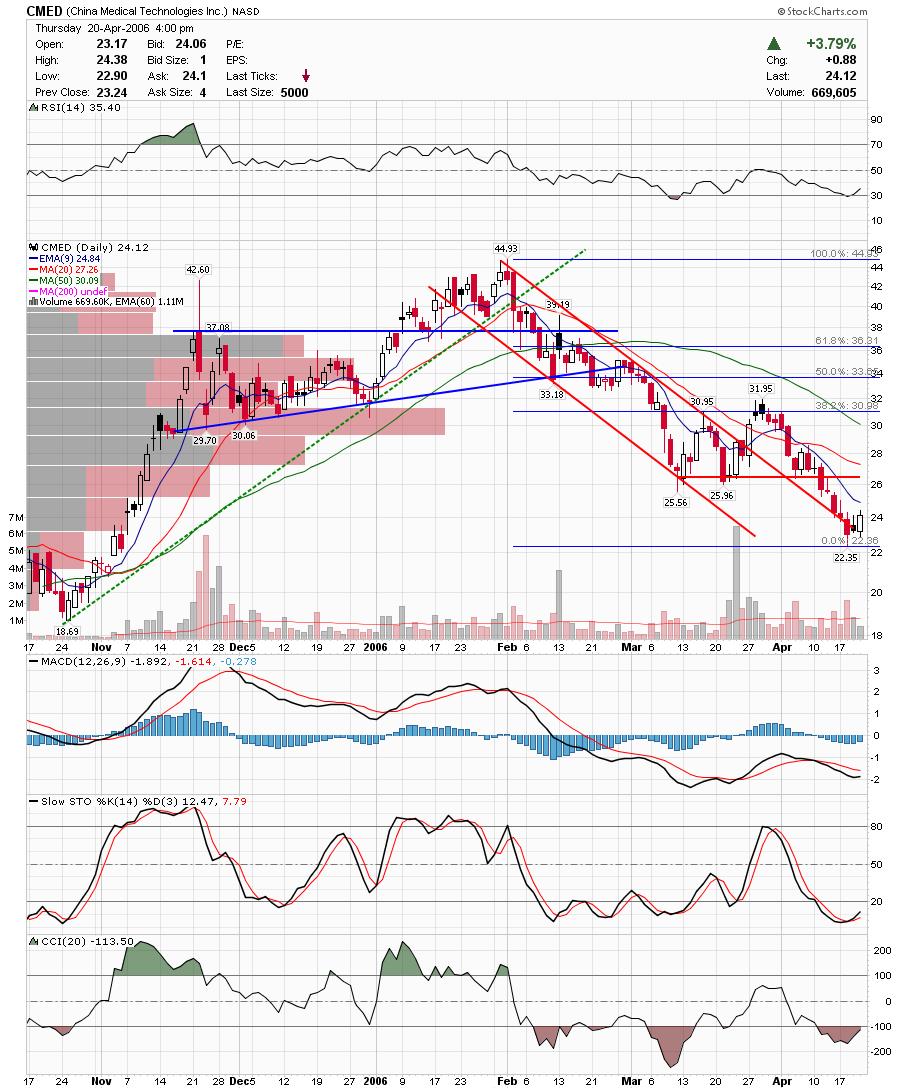
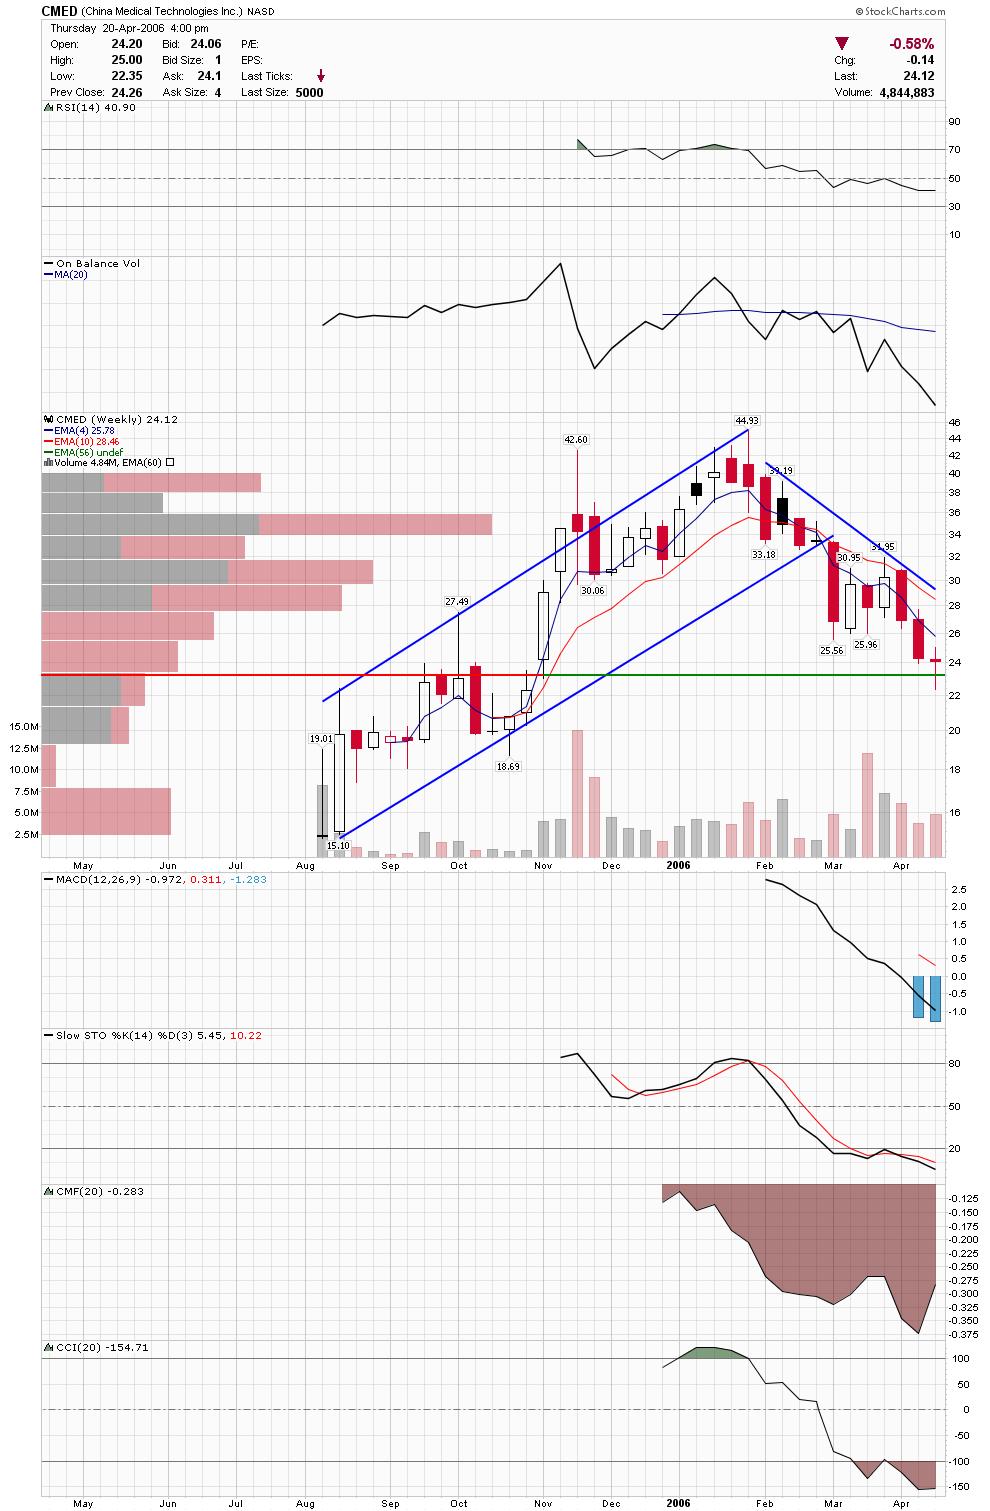
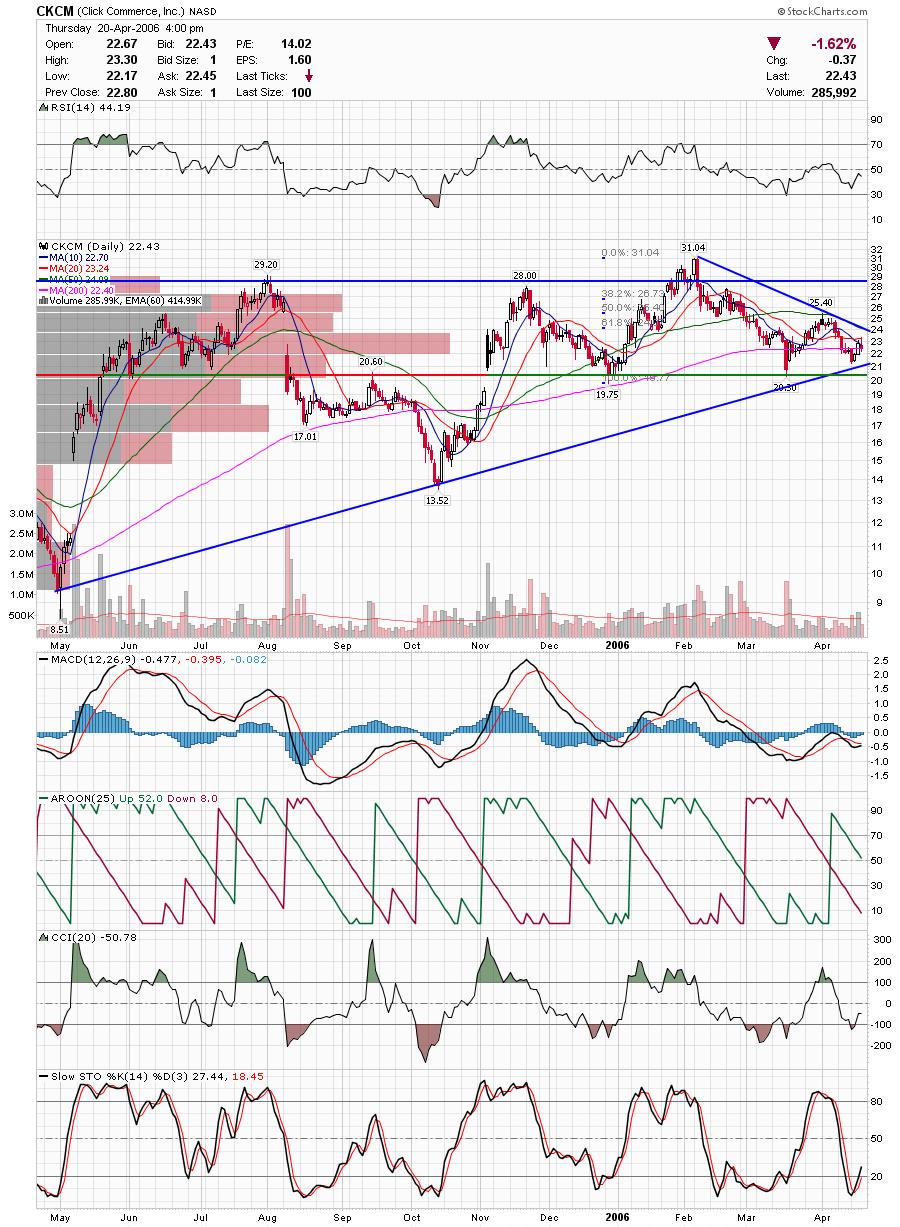
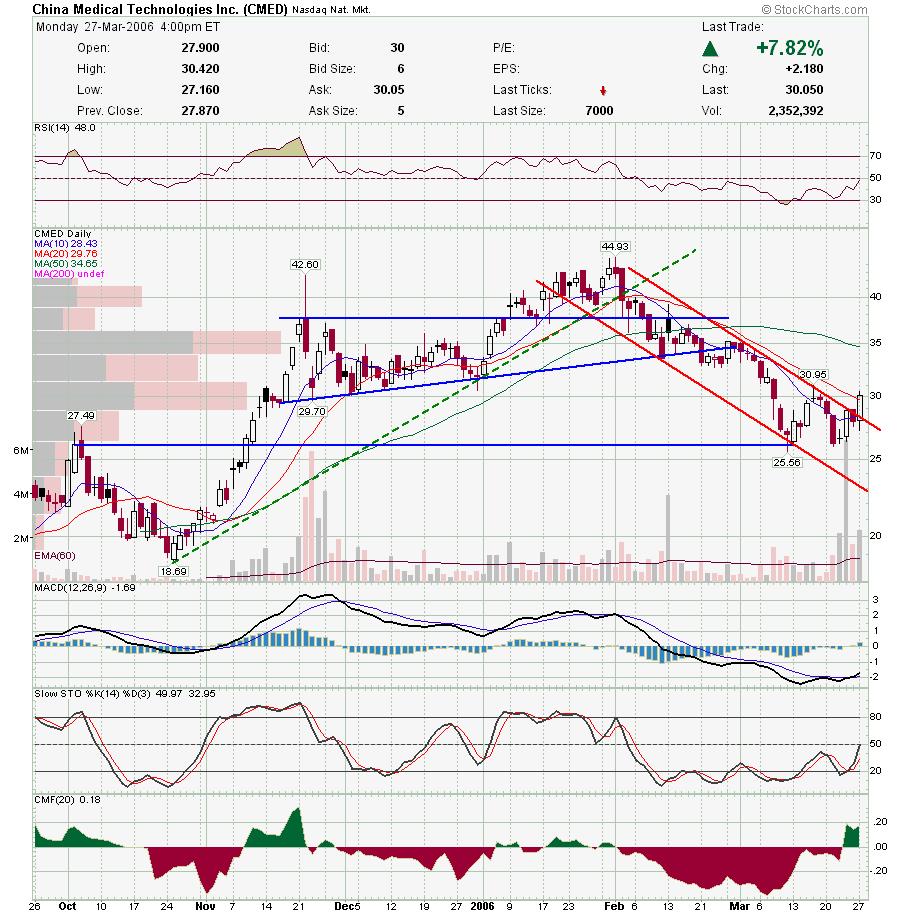
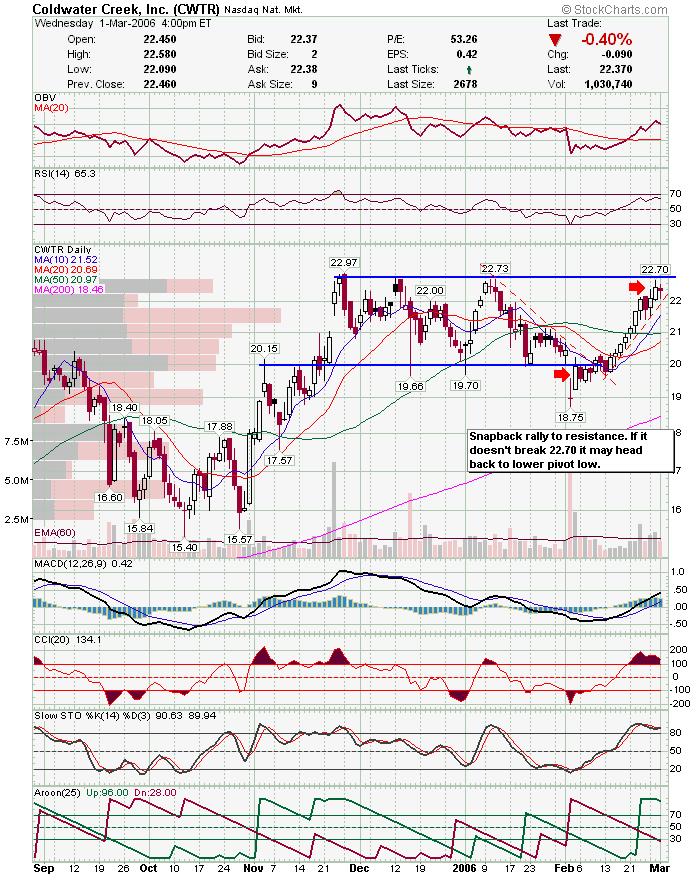
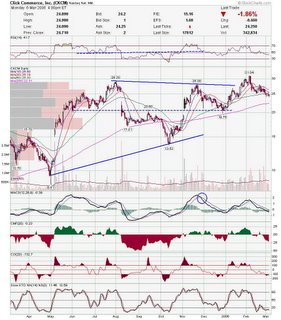
 A reader asked for an update on CKCM. CKCM fell below support and is trading under 50 sma. It is wavering at support on the weekly chart. I wouldn't short for several reasons one being that any news will send CKCM gapping higher because earnings were actually pretty good. Another is that CKCM may be at support from the 61.8% retrace of the last leg up. I am flat on CKCM and waiting to re-enter. A reader asked for an update on CKCM. CKCM fell below support and is trading under 50 sma. It is wavering at support on the weekly chart. I wouldn't short for several reasons one being that any news will send CKCM gapping higher because earnings were actually pretty good. Another is that CKCM may be at support from the 61.8% retrace of the last leg up. I am flat on CKCM and waiting to re-enter.
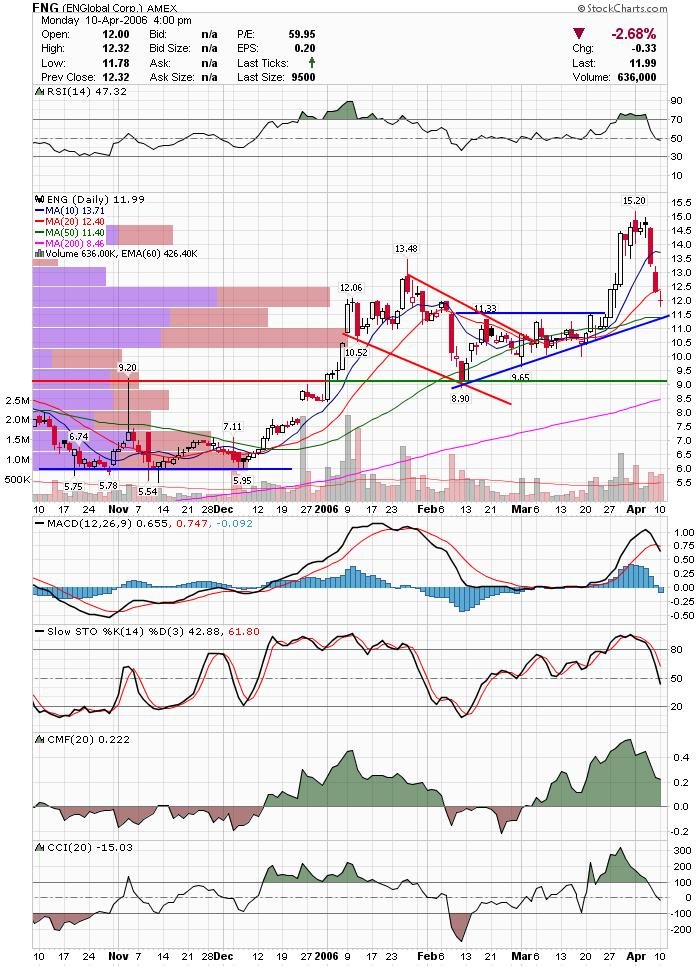
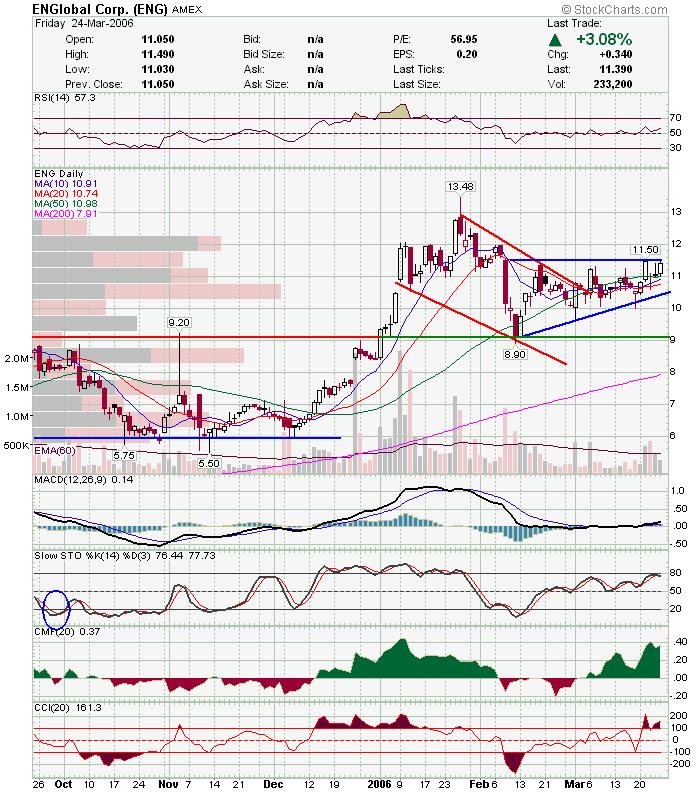
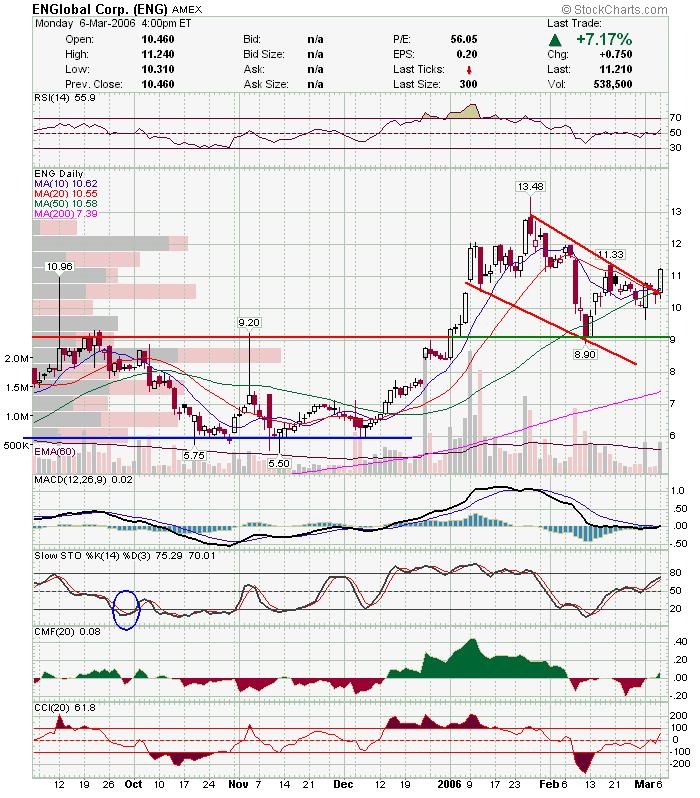
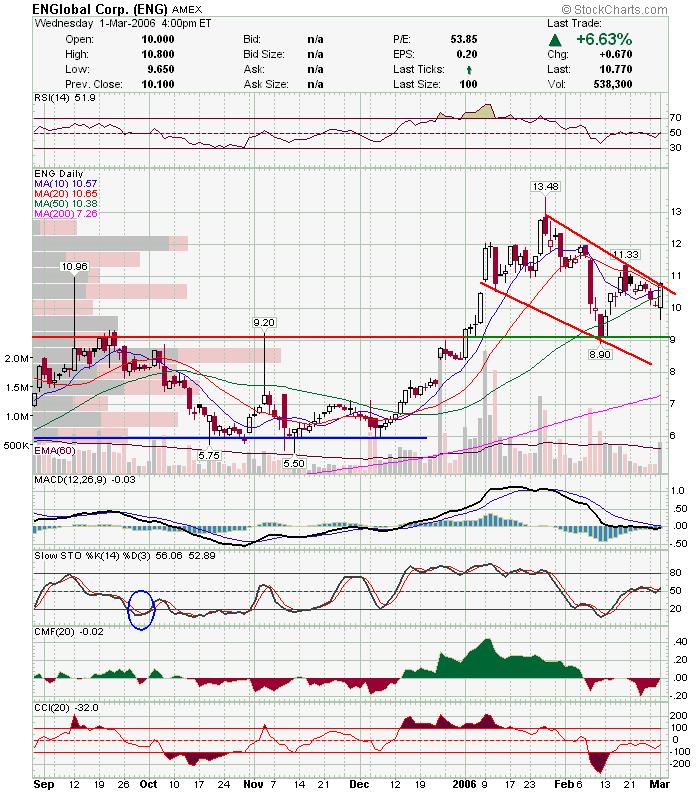
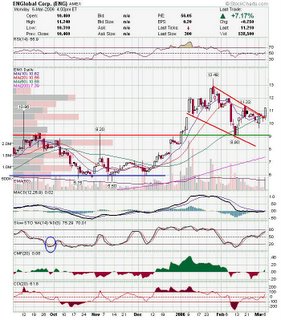
 ENG had a nice break of the pennant type consolidation. ENG had a nice break of the pennant type consolidation.
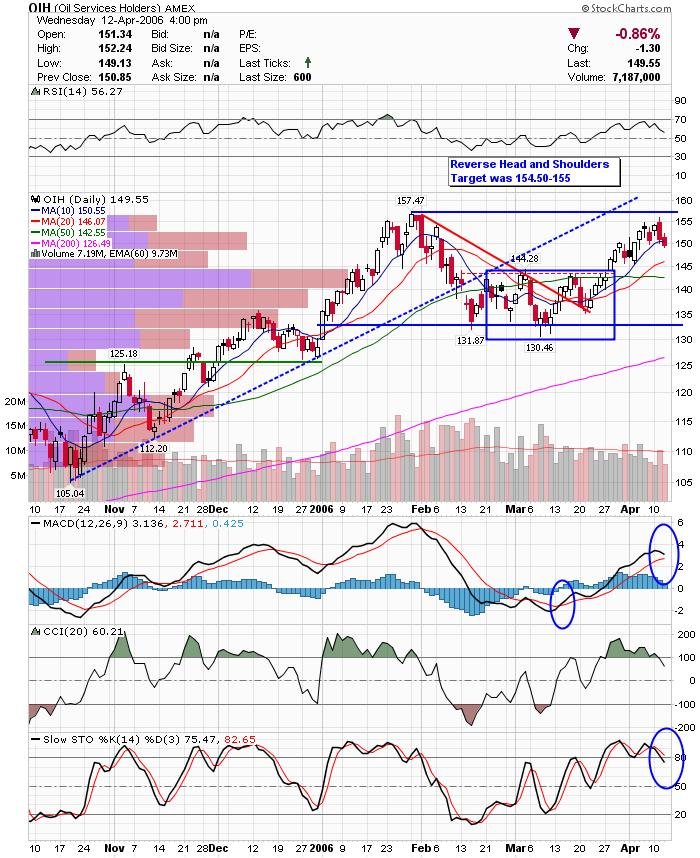
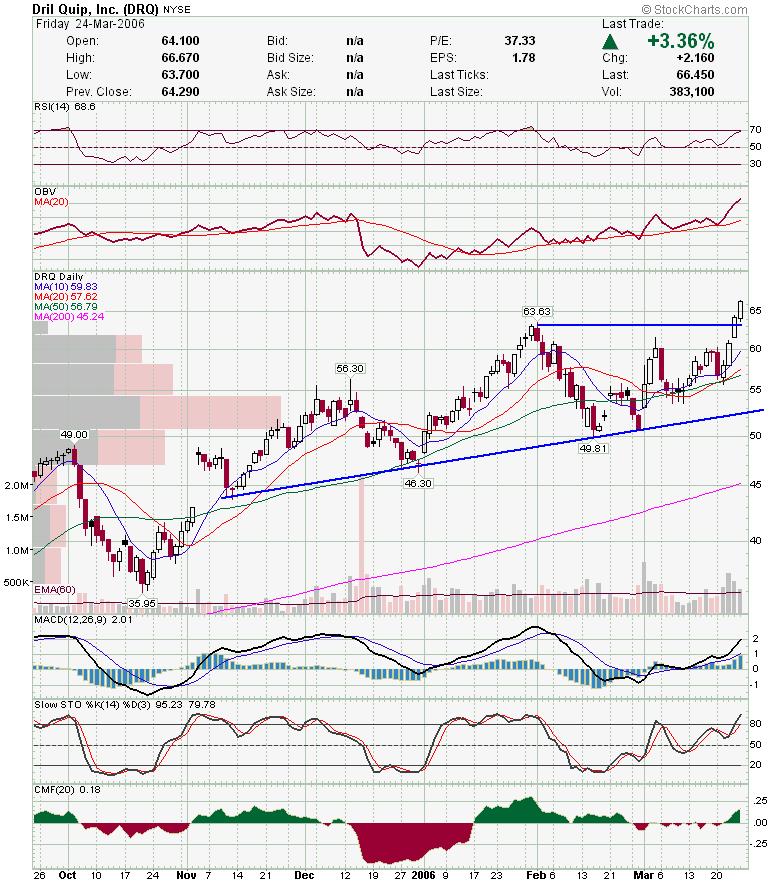
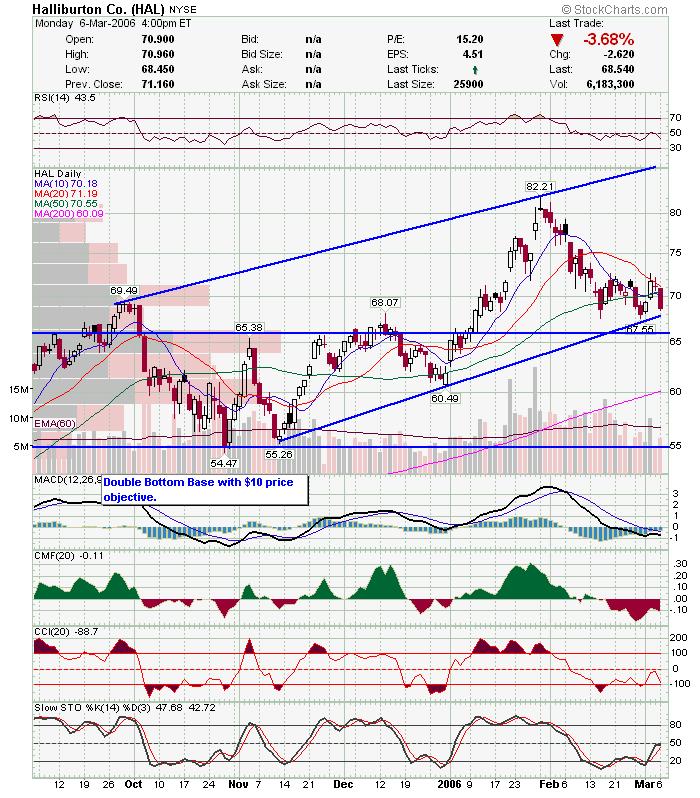
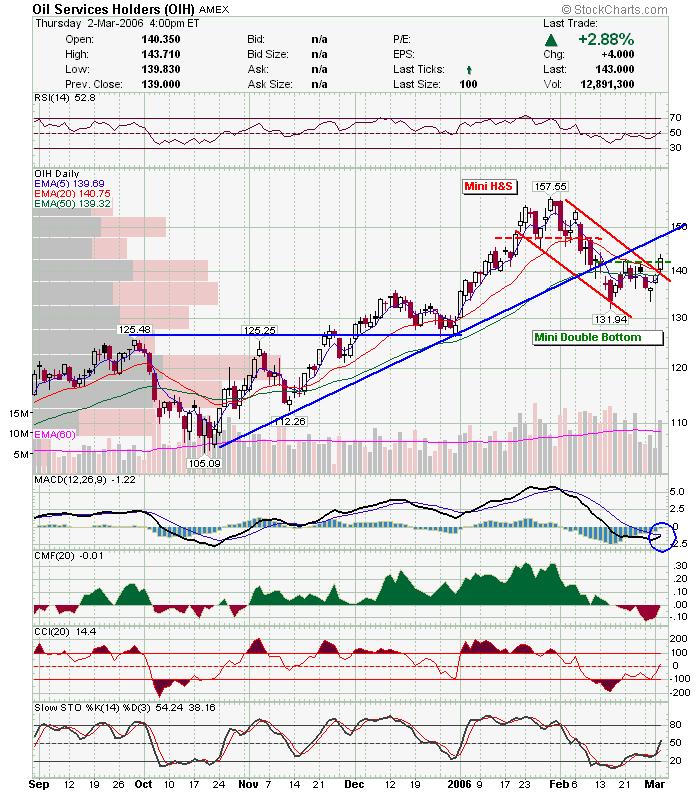
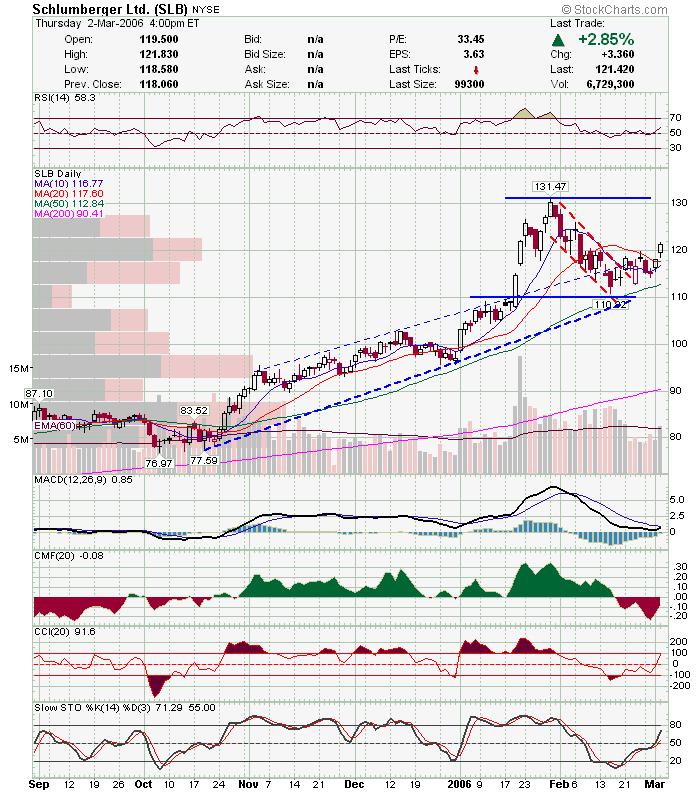
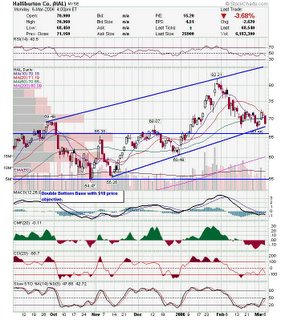
 HAL will be a good play if OIH gets a bounce in the next couple of days. HAL will be a good play if OIH gets a bounce in the next couple of days.
Thats it for tonight. I will be posting my gold charts tomorrow. GLD is back at trendline and may of double topped. I also have a few gold stocks to watch in case of a bounce.
Good Luck,
DT
Nasdaq Picture Posted by downtowntrader | 3/06/2006 08:29:00 PM | 0 comments »
My apologies for not getting this out sooner. I was having problems uploading earlier today, and I was swamped all afternoon. Here are some of my charts on the Nasdaq. In trying to gauge where we are we need to take a step back and look at the bigger picture.
Looking at the monthly chart, you can see that the Nasdaq has been trading sideways (or drifting up) for the past two years after the first move up from the .net crash. In the grand scheme of things we are near 4 year highs.
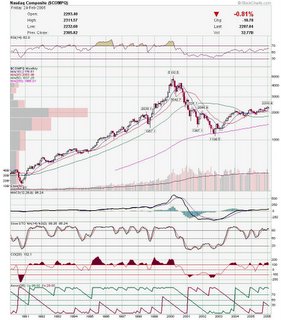
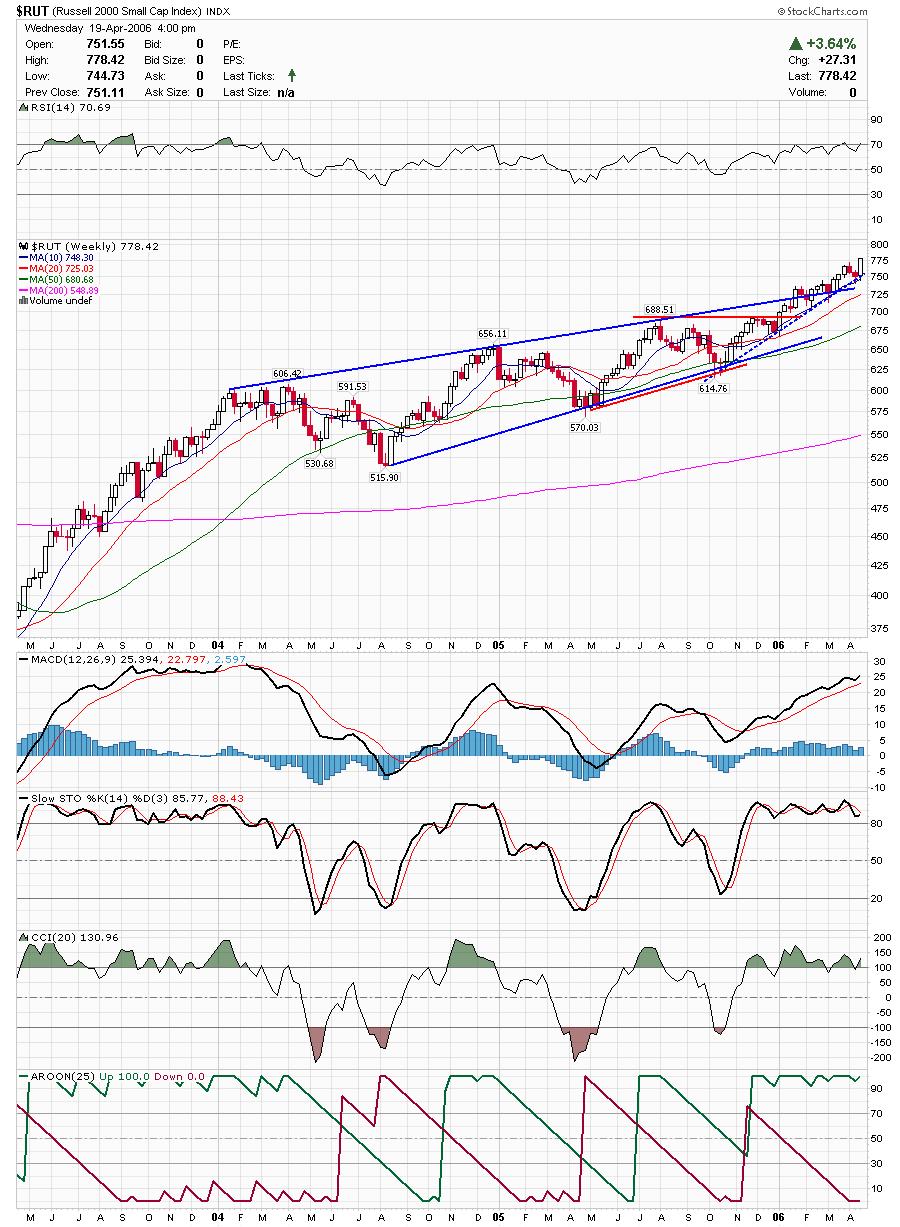
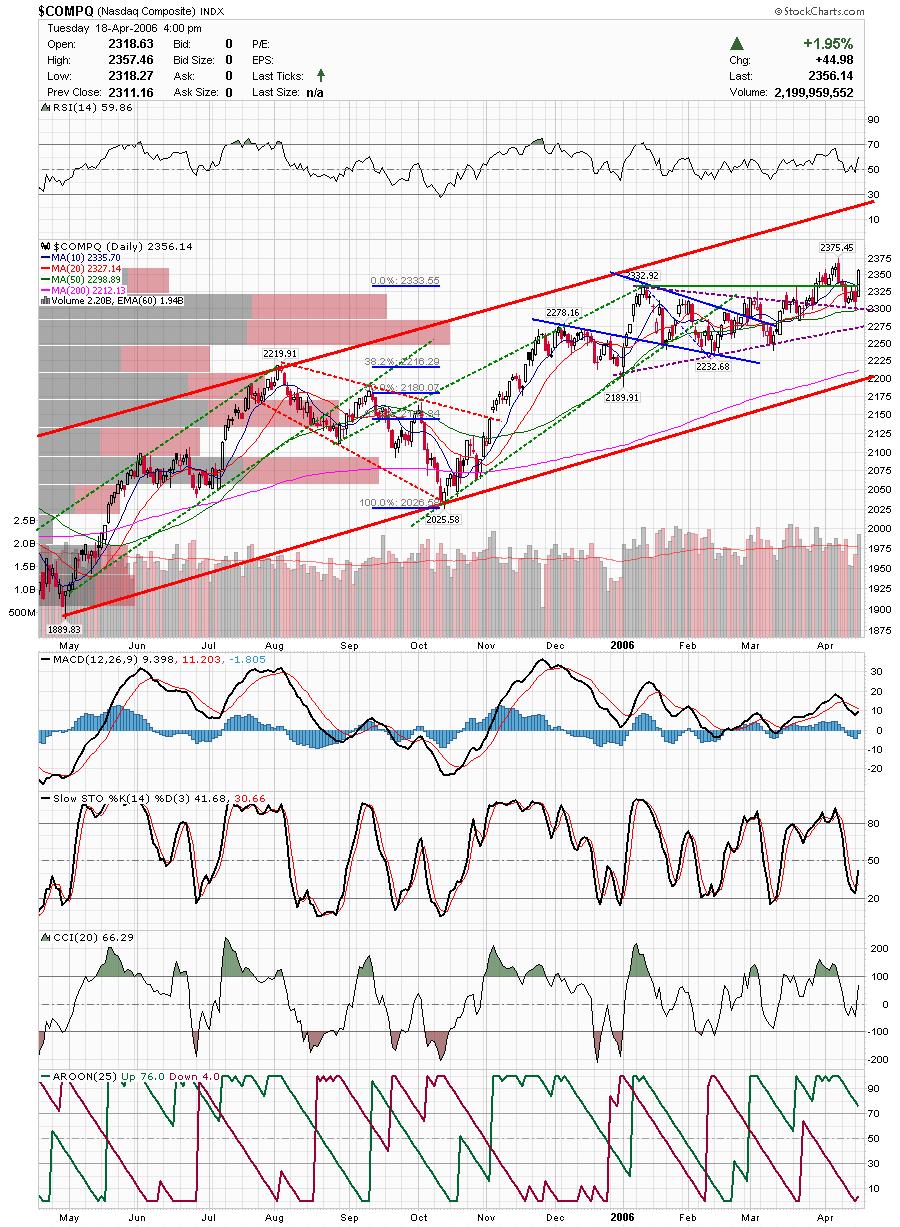
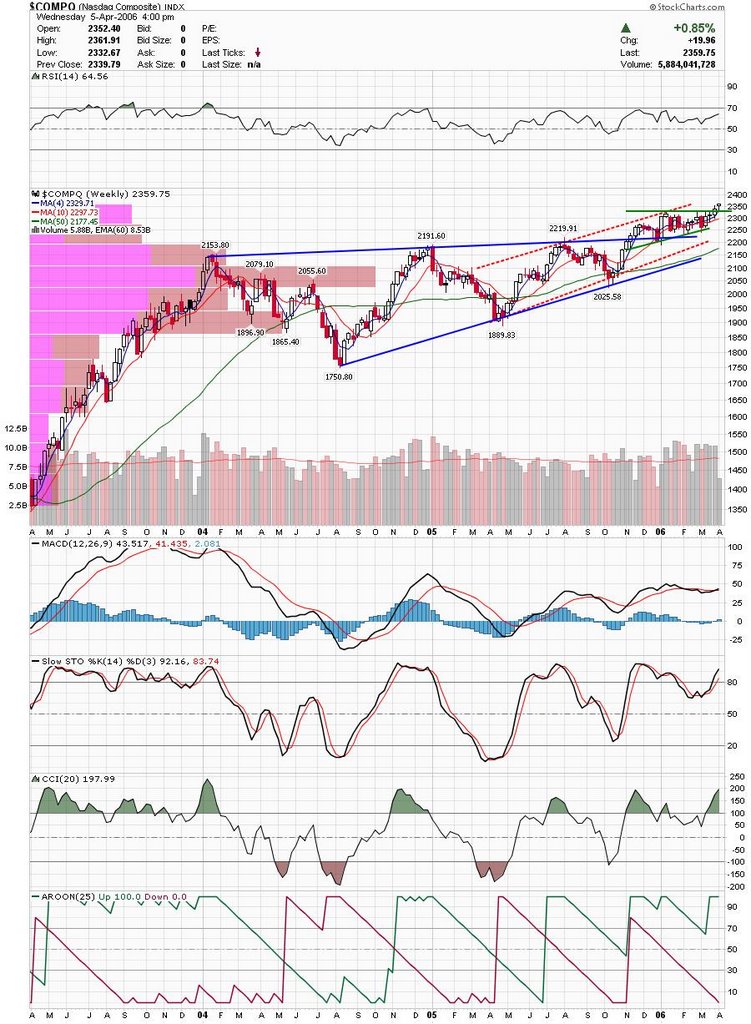
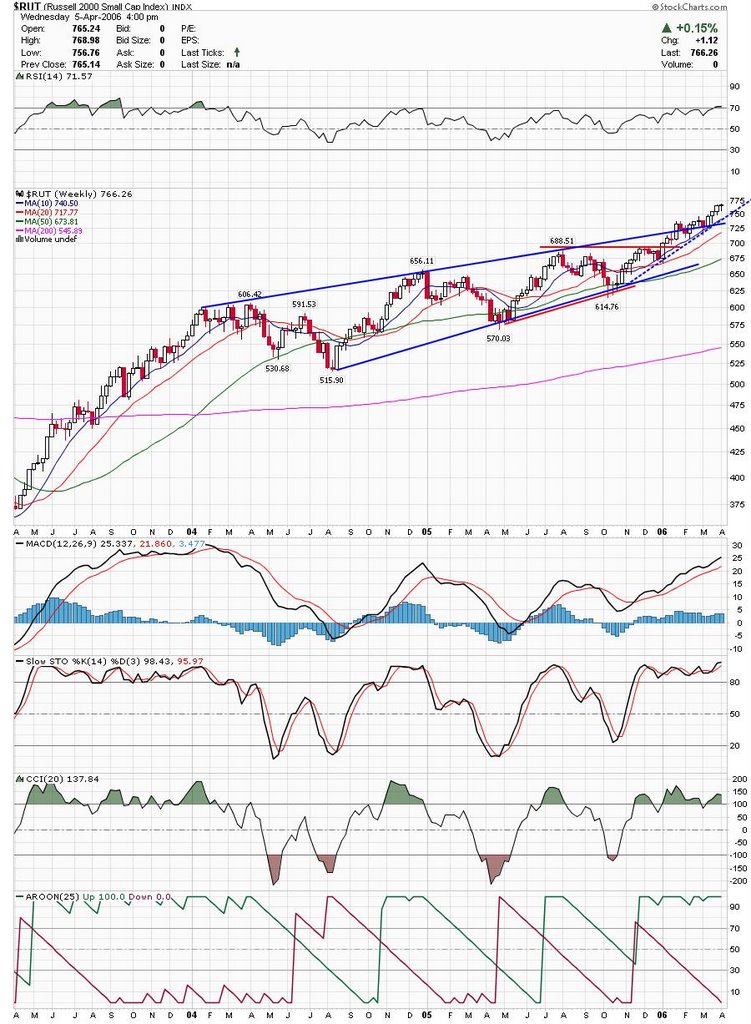
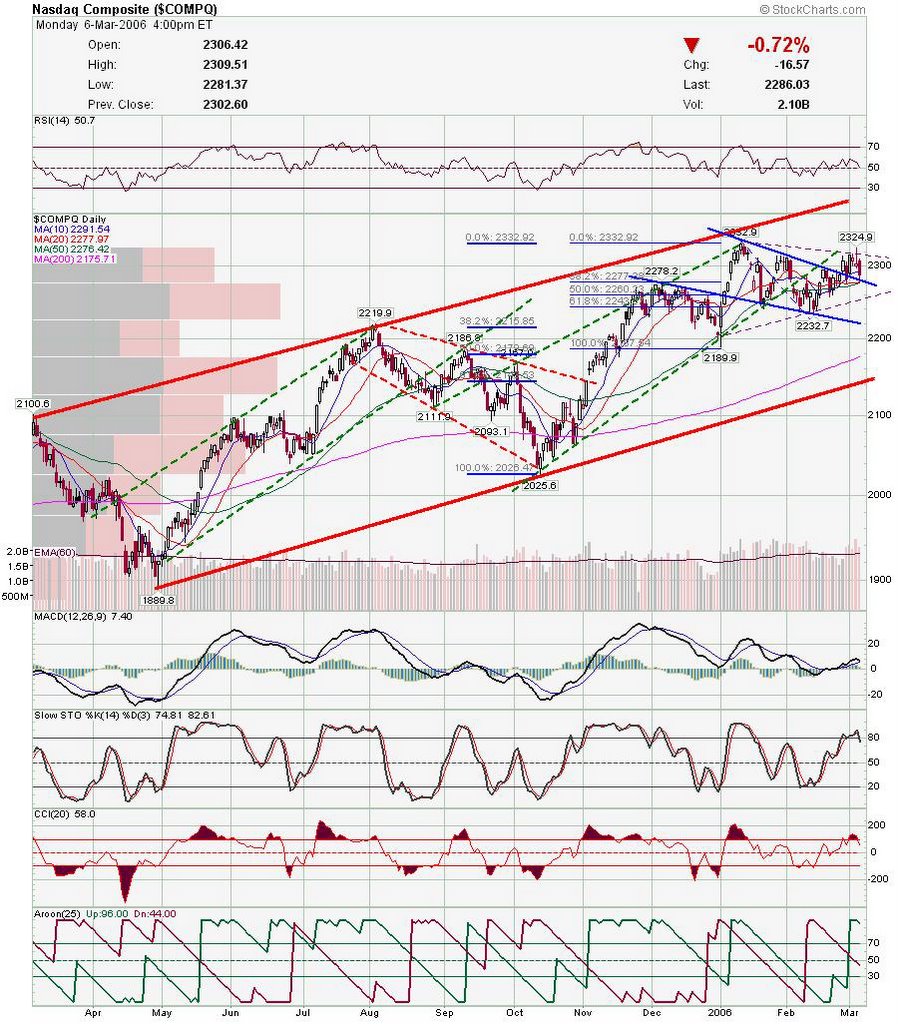
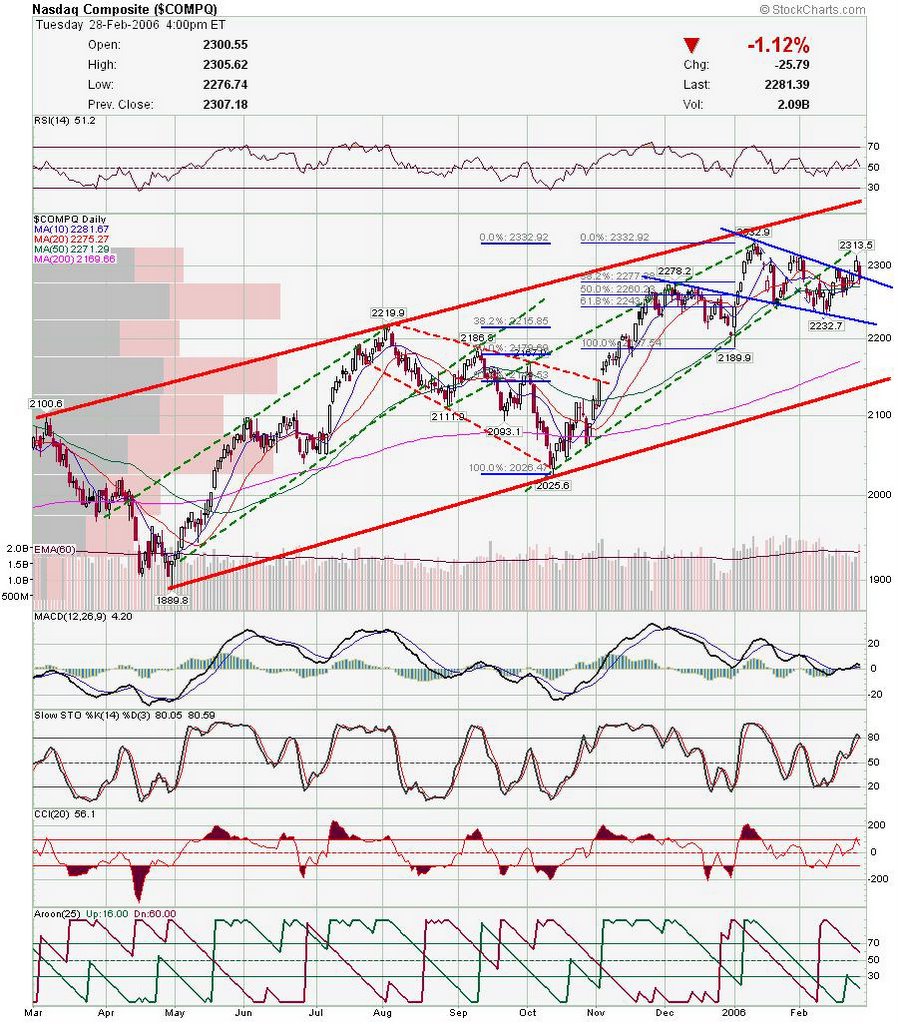
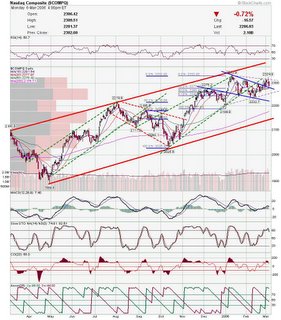
Here is the weekly chart for the past three years. The nasdaq has clearly broken a rising wedge which can only be classified as bullish. However, the red channel depicts a possible new trading range as the uptrend accelerates. The nasdaq is currently in the upper range of the channel and the MACD crossed down today which may be near term bearish. The Nas can drop over 100 points from here an still be in the rising channel.
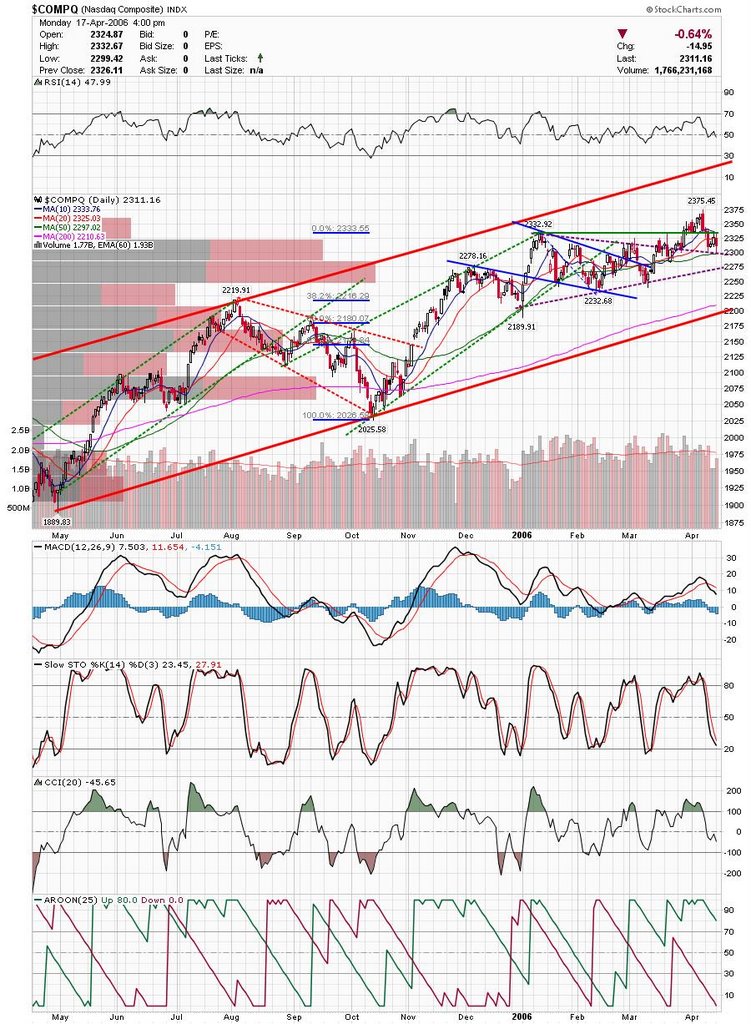
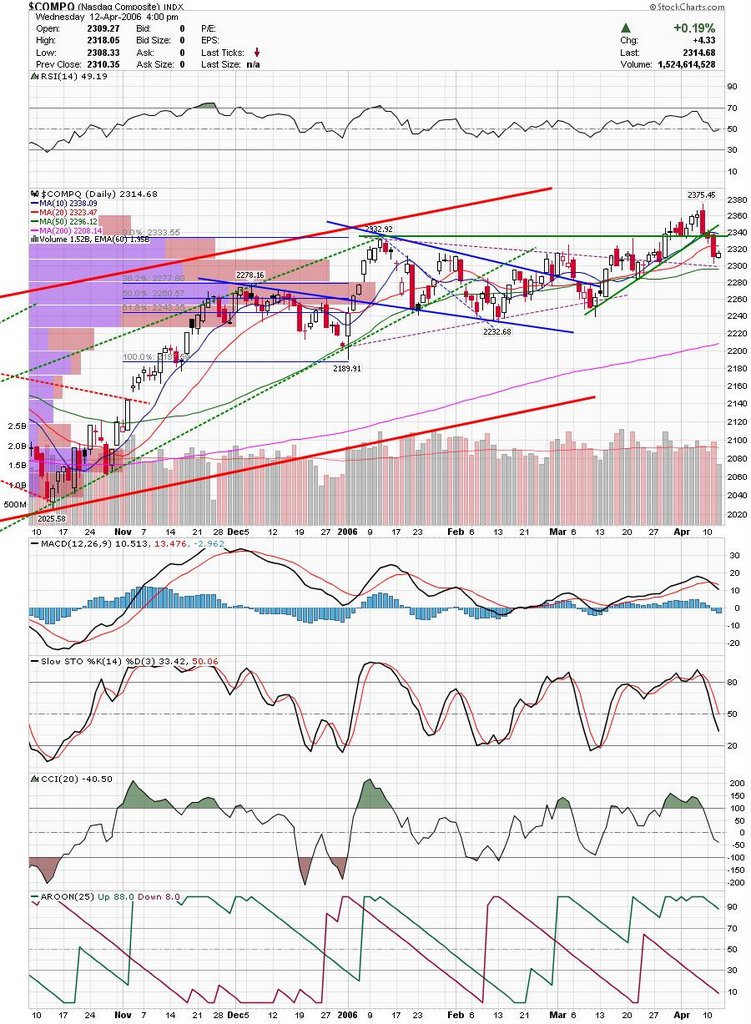
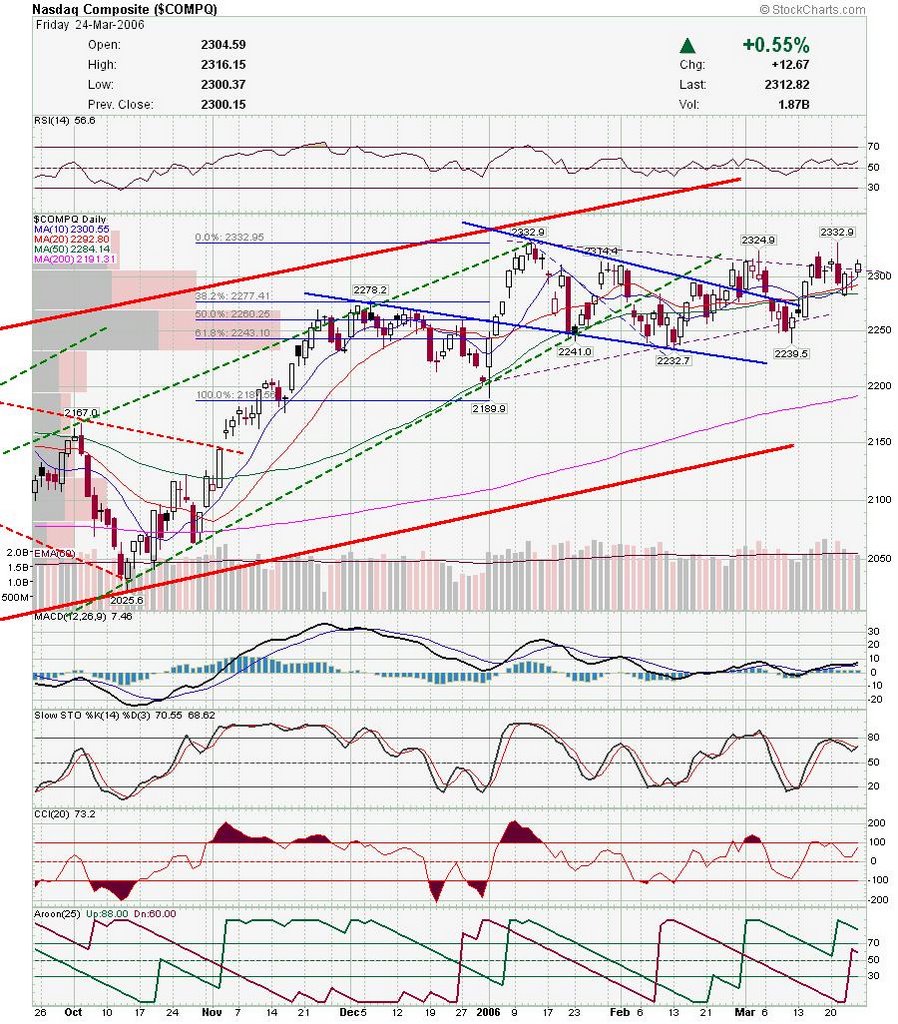
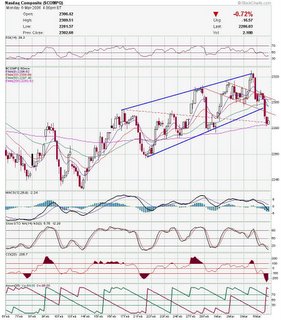
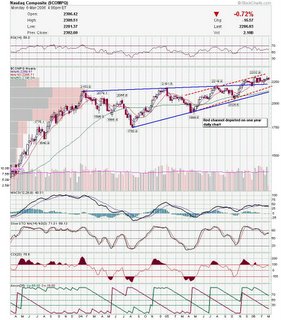 Here is my daily chart. This takes a closer look at the red channel in the weekly chart. There are clear channels within the overall trend, however, things get a little messy towards the end. The nasdaq was pulling back in a bullish pennant recently and broke above it, however, it is currently testing that pennant. In doing so, it may of formed a double top, or may be resolving into a triangle (shown in dotted purple). I can't predict what will happen as much as I wish I could, but market internals have been a little bearish and indicators are diverging. There is a chance we bounce between the blue and purple lines until the direction is decided. Here is my daily chart. This takes a closer look at the red channel in the weekly chart. There are clear channels within the overall trend, however, things get a little messy towards the end. The nasdaq was pulling back in a bullish pennant recently and broke above it, however, it is currently testing that pennant. In doing so, it may of formed a double top, or may be resolving into a triangle (shown in dotted purple). I can't predict what will happen as much as I wish I could, but market internals have been a little bearish and indicators are diverging. There is a chance we bounce between the blue and purple lines until the direction is decided.
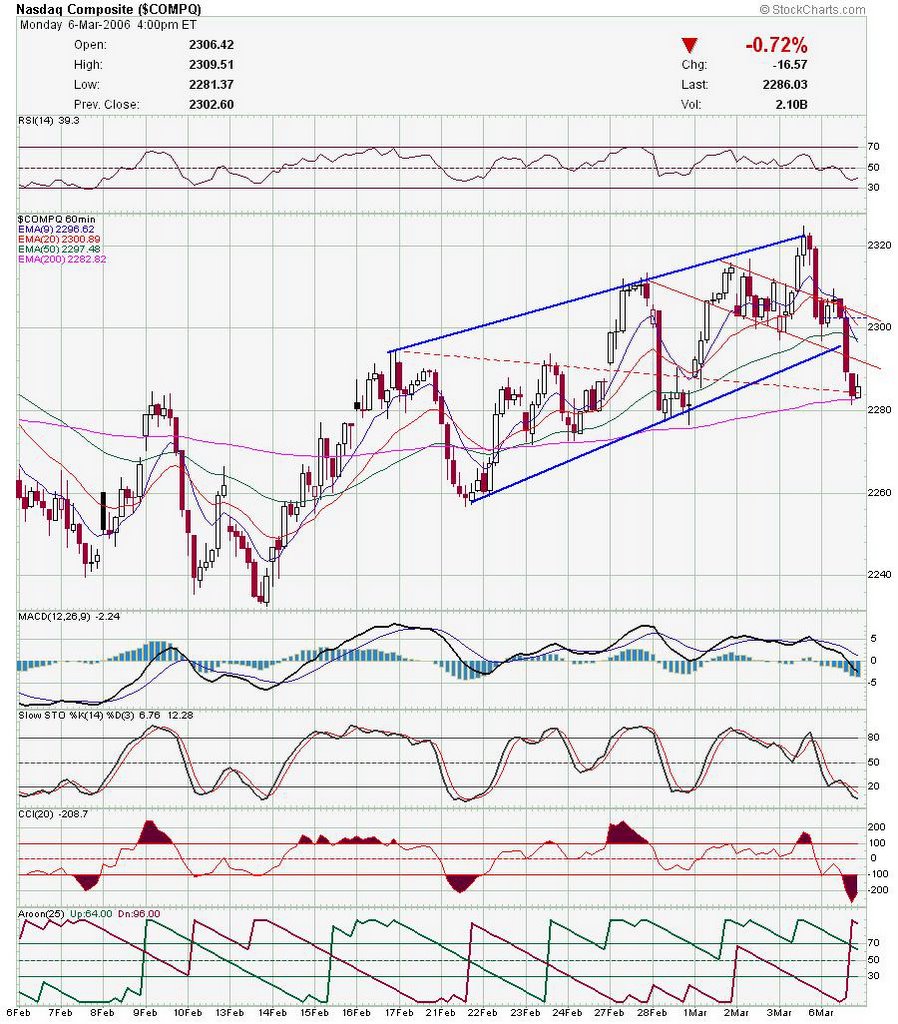
 Here is the hourly chart. Rising channel is broken and Nas stopped at 200ema. Indicators are oversold, so it looks like Nas will get a technical bounce tomorrow. Here is the hourly chart. Rising channel is broken and Nas stopped at 200ema. Indicators are oversold, so it looks like Nas will get a technical bounce tomorrow.
 So, as Austin Powers would say "but what does it all mean?". I can't predict which way we are going, but there are clues to the near term direction. The weekly MACD crossover, signals a possible downtrend over the next few weeks. The daily is showing possible support, but plenty of resistance overhead, and the hourly is showing oversold conditions. My guess, and this is only a guess, is that we get a technical bounce soon, followed by more choppy action. I wish I could provide a more clear picture, but if it was that easy, I would be on a golf course in Hawai. Good Luck and I will post a few charts later. So, as Austin Powers would say "but what does it all mean?". I can't predict which way we are going, but there are clues to the near term direction. The weekly MACD crossover, signals a possible downtrend over the next few weeks. The daily is showing possible support, but plenty of resistance overhead, and the hourly is showing oversold conditions. My guess, and this is only a guess, is that we get a technical bounce soon, followed by more choppy action. I wish I could provide a more clear picture, but if it was that easy, I would be on a golf course in Hawai. Good Luck and I will post a few charts later.
DT
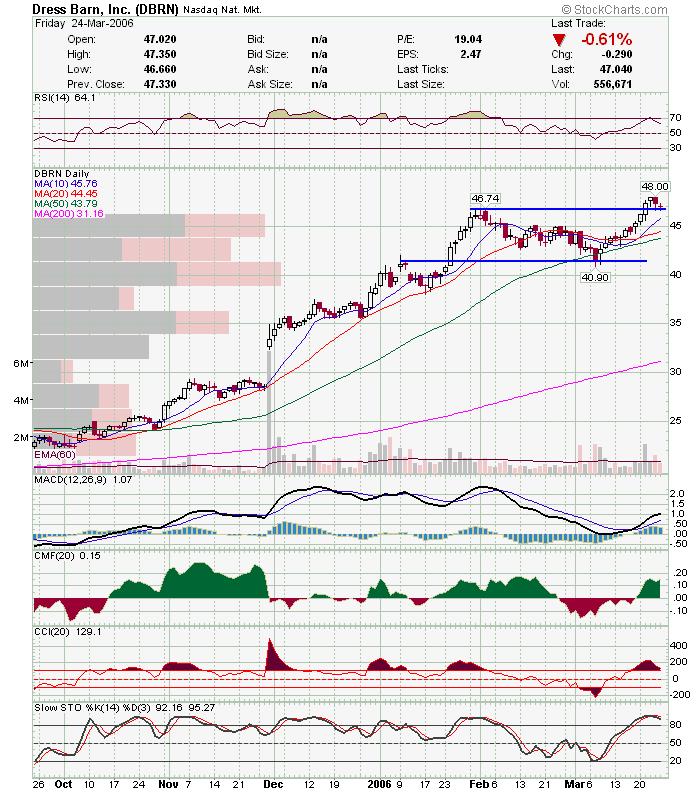
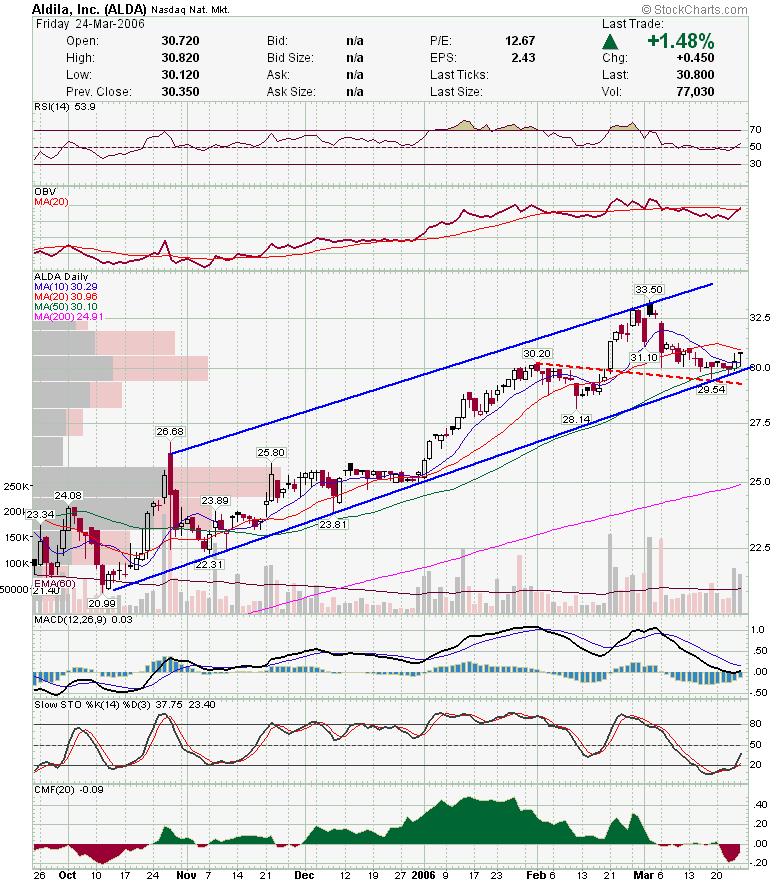
Charts to watch |
|
|
 [复制链接]