搜索
楼主: hefeiddd

一个笨蛋的股指交易记录-------地狱级炒手

  [复制链接]
 楼主| 发表于 2009-3-19 18:27 | 显示全部楼层
The trend remains up for now Posted by downtowntrader | 5/02/2006 10:03:00 PM | 0 comments »

So we are mostly back to where we were yesterday before the Bernake misunderstanding drop. While we have deteriorating technicals we must respect that the indices are mostly at or near significant highs. The one thing that keeps puzzling me is how the Nasdaq is staying out of synch with the SP500 and DJIA. The Nasdaq was pathetic today while SP500 had a decent day.

Here is a chart of the SP500 showing a possible triangle (shown in red). A break higher would surely squeeze some early bears.
Here is a chart of SINA which I picked up for the Squawk portfolio today on a trade ideas alert. This stock can really move and I wouldn't be surprised wit a run over 30 in the next couple days.
TDW is another Squawk pick off a trade ideas alert. Looks like a cup and handle breakout although it is not rounded.
PDE looks like a deep cup and handle breakout and was another addition to the squawk portfolio.
NBL looks like it is clearing a huge ascending triangle much like the TGE chart I highlighted recently.
After UBB's move today I decided to check out BBD. Looks like it might head up to test the 52 week high.

Good Luck,

DT


Newer Posts Older Posts Home
金币:
奖励:
热心:
注册时间:
2006-7-3

回复 使用道具 举报

 楼主| 发表于 2009-3-19 18:28 | 显示全部楼层
Still some decent charts out there Posted by downtowntrader | 5/01/2006 10:00:00 PM | 0 comments »

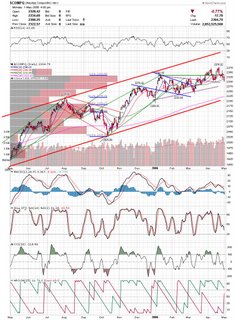
I had to look pretty hard, but I did find a few charts that still look decent on the long side. Todays late day reversal may be the nail in the coffin for this bull rally, but there is a chance we still get a bounce here, particularly on the nasdaq. If we are topping out as many believe, then I can envision the nasdaq forming a Head and Shoulders or Triple top. Here is an updated Nasdaq chart. You can see a possible double top or left shoulder and head. As the nasdaq pulls back to the trendline it could get a bounce.SCSS whethered mediocre earnings and is drifting to a trendline.
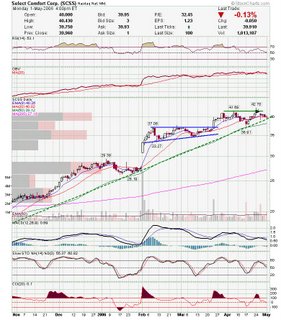
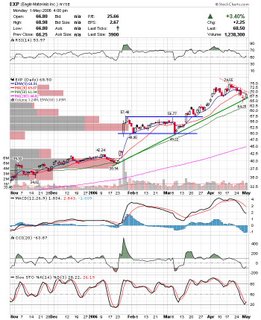
EXP looks to have finished the recent pullback and has support on the trendline.
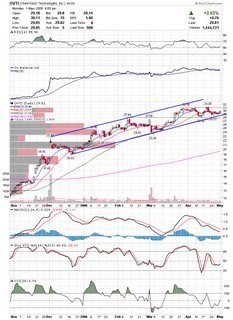
OVTI is one of the more promising charts I turned up. Nice consolidation here and indicators are perking up.
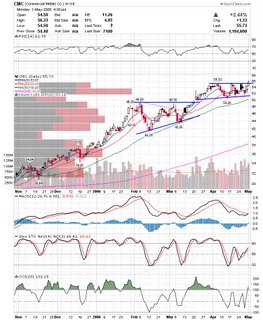
CMC managed to hold on to gains today and finished with a close over the previous 52 week high.
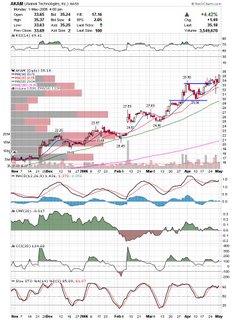
AKAM also hit a new 52 week high and held up very well when the nasdaq was tanking.
Here are a few charts to watch in case the markets are red tomorrow.

ISE has fellow exchane stock ICE reporting tomorrow. If ICE disappoints, then ISE could break out of the triangle to the downside.
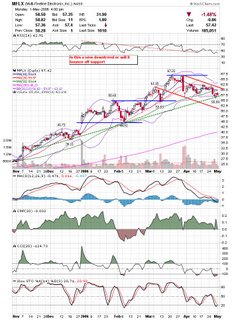
Has MFLX started a downtrend or is this still part of a normal pullback. Keep an eye on the trendlines.
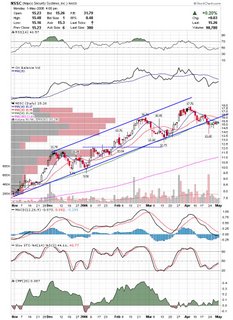
NSSC looks like it broke out of the existing channel and is testing previous support as resistance. Could break down any day now.
Thats it for tonight. Good Luck,

DT


Moving Time Posted by downtowntrader | 5/01/2006 09:35:00 AM | 0 comments »

I want to apologize for not posting any updates the past few days. I was moving over the weekend and the DSL was not ready. I hope to be at least settled in to the point where I can resume keeping up with the market over the next couple days. I do plan on posting some charts tonight. Good Luck,

DT


NO POSTS TONIGHT Posted by downtowntrader | 4/30/2006 10:18:00 PM | 0 comments »

Downtowntrader will not be posting tonight!


No Update Again Posted by downtowntrader | 4/27/2006 08:25:00 PM | 0 comments »

I won't be trading again tomorrow as I am still trying to resolve some other business. I don't want to post anything without being totally committed to it so I will wait till this weekend. Good Luck,

DT


No Charts tonight Posted by downtowntrader | 4/26/2006 09:19:00 PM | 0 comments »

I apologize but there won't be any update tonight. I won't be trading tomorrow as I have some business to take care. Good Luck,

DT


Trade Alerts Review Posted by downtowntrader | 4/25/2006 10:14:00 PM | 4 comments »

I have been using Trade Ideas for about a month now and all I can say is WOW. This is a great product and easily pays for itself if you know how to take advantage of it. First and foremost, I don't want to mislead anyone and tell them they will become supertraders overnight because the reality is that although this product may give you many potential trades, the bottom line is that you need proper trade management to take advantage of it. Think of this as a tool to add to your trading arsenal. More on that later.

I had tested the Pristine scanner before this one and I found it useful, but lacking in many areas and they have most of the alerts setup for their proprietary terminology. What is great about Trade Ideas is how customizable it is. You can have several different types of alerts depending on what you are trying to do and load just what you want at any given time. I am mostly a breakout and breakdown trader, so I focus on stocks making new highs and lows scans. If you are a value investor you may look for stocks near 50 or 200 smas. The options are virtually limitless.

This is an example of what an alert window looks like. The alerts appear on top as they occur and scroll down as they are replaced. The columns are customizable, however I just left them as is. You can also load multiple windows at a time with different scans. I normally have a breakout, breakdown, and generic high/low window up. A side benefit to using a real time scanner is that you get a good feel for the trading sentiment by watching which scans are getting more alerts. While this window is showing a decent amount of alerts there are times when I don't see anything show up for almost an hour while my breakdown window is showing plenty of potential shorts.
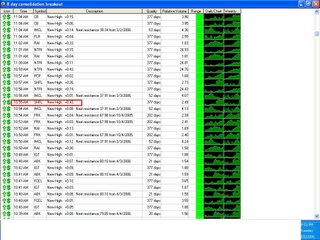
Here are the samples that are bundled with Trade Ideas. I haven't really tested most of these because what I started using has been working so well. The 3 day breakout on high volume is a great place to start for breakout traders. Some feel the high low ticker shows too many trades, however, I like to keep an eye on it to get a general idea of the sentiment at any given time.

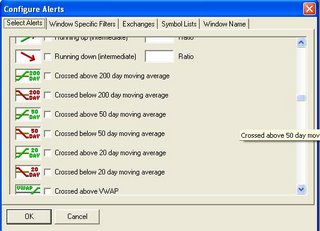
Here is an example of some available alerts. The list is huge including candle based alerts, triangles, head and shoulders, and many others. This is where you would start to customize an Alert window. If you take any of the sample alerts above, and then go into the configure window, you could add or subtract certain criteria to the alert and then save it as a custom alert. For instance, you could change the 3 day breakout to 10 days, etc.
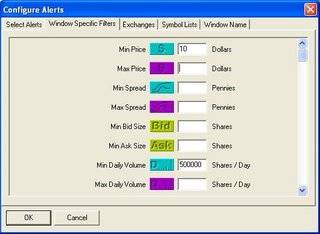
After modifying and creating an alert, you can drill down deeper with window specific filters. This is where you can really customize the alerts to fit your trading profile. The more precise you have your trading methodology defined, the easier it will be for you to modify the alert. Below is an an example I use for daytrade alerts. I prefer stocks with a minimum price of 10 dollars and average daily volume of 500,000 shares.
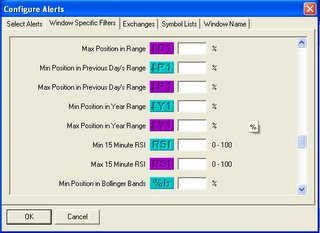
After the basic criteria, you can input a myriad of other options including bollinger band position, RSI, position in trading range, etc. These are very valuable parameters and they allow you to come up with some very high quality scans.
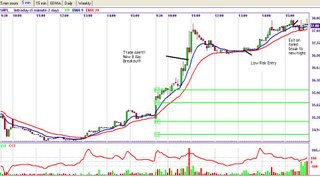
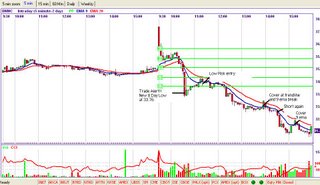
As I mentioned before, a real time scanner is a great tool to have especially when nothing is happening with your watchlist. However, it is important to note that proper entry and exit is still very important. What I find myself doing each morning and afternoon is watching the scanner for possible trades. As they scroll by I check the 5 and 15 minute charts and very important, the daily chart. If it looks good on the daily chart but I have missed a good entry I add the stock to a ticker and then watch the stocks that make it to the ticker for good entries. The fact that they are on my ticker means that they have already broken out or broken down based on my scan and therefore, if a decent entry is available, then the trade should be taken (of course taking overall market conditions into account). Here are two examples of trades I took today based on a Trade Ideas scan.

I didn't take this trade till after lunch even though the alert came through at 10:55 for various reasons (See Alert Window at beginning of this post). I added it to my ticker and after lunch I noticed it make a higher candle high after and ABC pullback and decided that it was a safe entry with a decent chance at testing prior highs. This trade had roughly a 7:1 risk reward ratio. As you can see if worked out very nicely.
BMHC alerted mid morning today. By the time it alerted (based on an 8 day low), it was too late to enter. However, after forming a nice bear flag into resistance, it afforded a very nice entry. I covered when it looked like it would break a trendline I had and after it took out the 9 ema. A few bars later, it broke down again for another decent short.
The important thing to note here, is that just cause it came up on the scan, doesn't mean it is an automatic trade. Even with a high quality scan, most alerts are not tradeable immediately.

Also, this product is not just for daytraders. I have been testing it out for swing trades by using it for picks in the CNBC Squawk Box trading contest. While I'm not anywhere near the lead, I didn't expect to be as you need to take foolish risks and use no diversification to win one of these things. However, I am up and have not experienced any significant drawdown.

Another benefit to using a product like this is that it allows me to focus purely on the technicals specific to a trade removing any bias I may have. Sometimes we see the perfect swing setting up and we are tempted to enter early on our expectations. With the scanner, if you see an alert, that means the conditions have already been met. The less emotions involved the better you will trade.


To summarize, I love this product. It provides me with hundreds of potential trades daily.

If you are interested in Trade Ideas, please sign up through my

Feel free to email me for the details on my custom scans if you sign up through my link and need help.

Sorry but there are no charts tonight due to the length of this post.
Good night,

DT
金币:
奖励:
热心:
注册时间:
2006-7-3

回复 使用道具 举报

 楼主| 发表于 2009-3-19 18:29 | 显示全部楼层
Sideways action Posted by downtowntrader | 4/24/2006 08:35:00 PM | 0 comments »

The markets came back off their lows today, although in a muted fashion. It still looks like there is more upside here, especially in tech related issues. I also think the selling in gold and silver isn't complete yet, however, I don't expect a major correction.

Here is a chart of the gold contract. Thats a lot of volatility to end up in the same spot as four days ago. There are a lot of conflicting forces at work here with the dollar falling, Japanese market possibly pulling back, commodities being overbought, and global inflation a real threat.
Here is a post from last Thursday caling a possible bottom in CMED. Today's strong move signals that the bottom is probably in. I expected a move to at least the 32.8% retrace and that is looking almost certain.
BOOM continues to chug along this rising channel and has succesfully broken out of the larger Blue consolidation base. The target for breaking out of the larger consolidation is near 50.
TGE broke out of a huge triangle on after reporting stellar earnings. Volume was strong today signaling that this move should hold.
IIP got the bounce off the trendline I was expecting and is attempting to test it's 52 week high. It may resolve into a triangle at that point or just clear the whole pattern altogether.
NFLX broke out a very nice triangle last week and reported earnings tonight that had the stock trading higher about 5% higher after hours. The target for this breakout is near 38-40.

Thats it for tonight. Good Luck,

DT


IBD 100 Charts Posted by downtowntrader | 4/23/2006 10:08:00 PM | 0 comments »

Not sure what to make of the nasdaq weakness on Friday due to the games that are played on options expiration, but there are a lot of semiconductor stocks that reversed pretty hard. The indices are still holding support so the path of least resistance remains higher, however, the environment is still pretty dangerous being that most of the indices are at the top of their channels.

Here are a few IBD 100 charts that offer devent risk / reward trades.

ABAX looks good if they can clear the overhead resistance.
ANDE bounced back pretty quickly after dipping a few days ago. Watch for a break to new highs.
BER looks good here too after clearing this rectangle base.
CWTR broke the rectangle base and now may come back for a test of support.
ET looks good breaking out of this triangle. MACD is crossing over as well.
**correction: I labeled DW as GW below earlier.

DW held above the breakout point on Friday and looks good if they can make a higher high on the daily chart.
GOL cleared a pretty large triangle, but they need to hold the breakout area.
INFA sold off after earnings, but came back by the end of the day to cut their losses by a pretty good margin. If they can clear 17 they may look good.
SCSS looks like they may take out upper resistance.
THO has been consolidating fairly quietly, but if they can clear this triangle on volume, it should make for a pretty decent trade.

Thats it for tonight. Good Luck,

DT
金币:
奖励:
热心:
注册时间:
2006-7-3

回复 使用道具 举报

 楼主| 发表于 2009-3-19 18:29 | 显示全部楼层
Sloppy Day Posted by downtowntrader | 4/20/2006 08:42:00 PM | 0 comments »

These are the kind of days where you should really just shut it down and go do something outside. Not much to say other then the pullback was very light and didn't break any support. Tomorrow is expirations day and as such I won't be actively trading. I am posting just a few charts tonight.

SHFL is what I took for the Squawk Box contest today and I did initiate a position as well. Had a new high close on the year today and may take out the high tomorrow.

Is there a case for CMED bottoming out here? Cmed broke out of the downtrend a few weeks ago and has been riding down the topside of the trendline since then. Yesterday it had a narrow range bar after a high volume "almost hammer", then today it broke higher, although on weak volume. If it is the bottom then I would expect a 38.2% retrace to 30's.
Here is the weekly chart showing possible support where it is getting the bounce.
A reader requested CKCM so I am posting my yearly chart for it. CKCM is pretty close to the lower end of a huge triangle. It had a failed breakout earlier this year and could make another run at it at some point. I don't play earnings so at this point it looks to me like the safest play is to wait for something to develop.

Good Luck and have a good weekend,

DT


Houston, do we have lift off? Posted by downtowntrader | 4/19/2006 09:00:00 PM | 1 comments »

While some are waiting for confirmation from the Nasdaq and Dow, Russell confirmed this rally today. Russell is the leading index and they made multi year highs today. The Nasdaq closed near a new high as well. The next two days may get tricky with options expiration on Friday, but it appears that the path of least resistance remains up. Things were mixed in the after hours session today as AAPL and CTXS were up but EBAY and RMBS were down.

In looking at the Nasdaq chart a couple nights ago, I came up with a target of 2475.9 based on a triangle breakout. This would take it to the upper trendline on my chart. If this breakout holds, I expect semiconductors to lead the way. Chips are looking much like Energy stocks did a month and a half ago.

Here is a weekly chart of the Russell. Notice it broke out of the rising wedge and successfully tested the breakout area.
Here is a chart if the $sox. I expect a test of the trendline and then maybe some consolidation. But bottom line is that if Nasdaq rallies then Sox will make a new high.
NSM is a semi with my favorite pattern. Nice volume on the break of the triangle.
TRID stopped short of a breakout, but it was a strong move from the bottom of the triangle.
NFLX looks like they are breaking out of a very large triangle. If it follows through it could be an explosive move.
AKAM looks like they will make a new 52 week high here. Volume came on today after declining during the consolidation.

Thats it for tonight as I already have tons of charts I am watching this week.
Good Luck,

DT


Wow! Posted by downtowntrader | 4/18/2006 09:52:00 PM | 0 comments »

That was a heck of rally today. I showed the Dow and Nas bouncing off support last night, but I had no idea the bounce would be this strong.

Here is an updated Nasdaq chart.
And Dow Chart.
Both appear to have marked a bottom. My only concern with the near term is that now everyone expects a rally and the markets don't like when everyone is on the same page. However, todays rally was too strong to dismiss as any type of headfake IMO.
It was nice to see semiconductors lead the rally today and I believe if this rally has legs then we will see some profits being taken out of commodities and being put to work in the semiconductors.

With that in mind, here is a chart of MRVL. They have had a healthy correction and appear to have found support and may be breaking the downtrend line.
POWI is another chip stock that appears to be breaking a downtrend.
SNDK looks to be breaking out of a loose reverse head and shoulders pattern.
NETL hit a new 52 week high clearing lots of resistance.
XRTX dipped into the gap and may of filled all it's gonna fill.
IIP is consolidating into another bull flag.
CBG is one of those stocks in a nice boring uptrend. Looks like it is starting another leg up.
NSC may clear it's current base here.
SCHK appears to have cleared a triangle base.

Good Luck,

DT
金币:
奖励:
热心:
注册时间:
2006-7-3

回复 使用道具 举报

 楼主| 发表于 2009-3-19 18:30 | 显示全部楼层
Looks like it will be a fun week Posted by downtowntrader | 4/17/2006 09:59:00 PM | 0 comments »

Well the week started off with a sharp reversal down and then a decent close. Things will undoubtedly get even more fun with a ton of earnings on the slate and options expiration to boot. I am only posting a few charts as I am still watching most of the charts I posted last night. With the day being so negative, 9 of the 11 longs I posted last night managed to close positive, so if the markets get any traction, those would be a good place to start.

Here is an updated Nasdaq chart. It has been respecting the dotted trendline as support, so watch out if it breaks under it.
DJIA bounced off the rising trendline today. Keep an eye on that trendline.
IBCA is a very thinly traded stock with a nice chart pattern.
ITRI had a nice move today and cleared all resistance.
MVK also cleared resistance and closed very strongly today.
I am watching some possible short setups such as ESRX and FFIV, but I also get some with my real time scans. Here is a sample of some of the shorts that came up today. Most of these look like they will fall further.

Shorts that triggered today

I took OSIP and RIMM today out of that list and covered for profits.

Good Luck tomorrow.

DT


Mostly IBD 100 charts Posted by downtowntrader | 4/16/2006 09:27:00 PM | 0 comments »

I have mostly IBD 100 charts tonight. I am mostly posting charts of stocks that are near a valid entry point with a decent risk to reward ratio. This is not the appropriate time to chase stocks and may not even be an appropriate time to enter swings to the long side. However, there is always a chance that the markets continue to go up and the only way to take advantage of it is to put some trades on that won't hurt you if they fail. I haven't entered any swing shorts of more then 2 days lately and probably won't until the indices break decisively below the 50 smas. I have been using trade ideas for short setups which is why you haven't seen too many short charts lately. If anyone is really interested in the short setups, let me know and I will include more.

CLDN failed the breakout but has been declining on very light volume. Also, there has been strong support in the 24's illustrated by the long tails three days in a row.
CWTR has been trading a tight flag formation while the rest of the retailers have been pulling back. When the sector is ready, it looks like CWTR will lead.
FCFS has been a little sloppy, but remain close to a 52 week high.
GWR has held the breakout area and offers a pretty good risk reward setup here.
OVTI has come back to test support and has a lot of upside room left.
MFLX had a pretty steep loss followed by a weak bear pennant, however, it is very oversold and coming to support.
THO is coming back for a retest of the triangle breakout. Another solid risk/reward play.
WAB may come back to test the breakout and the target is near 39.
CHK is the first non IBD100 stock and doesn't really look like it's headed anywhere quick. BUT, it is worth watching as CHK has been consolidating a huge runup for the past 6 months and if natural gas finally gets a bounce, CHK will be a great ride.
Another triangle retest. MORN looks very solid here.
And another triangle retest. I'm sure everyone is getting the idea that I love ascending triangle bases.

That's it for tonight. I also posted five charts of my current holdings on my Squawk contest blog. Be sure to check them out.
Good Luck,

DT


Vacation Posted by downtowntrader | 4/13/2006 05:41:00 PM | 0 comments »

No post tonight as I am heading out early today for a weekend vacation. I will post on Sunday night.


DT


Gold vs the Dollar Posted by downtowntrader | 4/12/2006 09:41:00 PM | 0 comments »

There is a school of thought out there that correlates rising commodity prices to the increased supply of global paper currencies. As the world keeps printing paper, the underlying currency is devalued. There is no way to print more gold of course, therefore the only true currency (gold,etc) is being scooped up. The issue right now, is the world is just starting to increase their own rates as the US is supposedly wrapping up it's own rate hikes. So, if Japan begins a string of rate increases and China decided to strengthen their currency, then the US will have an issue. The dollar will weaken unless the Fed keeps raising rates. But if the Fed raises too much, then it could derail the economy. So, the real issue for the fed, is not fighting inflation, but keeping the falling dollar propped for political reasons without bringing down too many things. If you look at the dollar as it related to gold, you will see that gold rises when the dollar falls. So what is the rise in gold telling us? That is the million dollar question.

Here is a chart showing the dollar. The dollar is at a crossroads here needing to hold the blue trendline in order to maek another attempt at the red horizontal trendline.
Here is a chart of the ten year. Clearly, it has broken out.
Here is a chart showing the relationship between the dollar and gold over the past three years. It's pretty clear that gold and the dollar have an inverse relationship and the dollar is currently falling.

Here is a chart of the SP500. It looks like it is headed lower, but already stochastics and cci are oversold.

Here is the Nasdaq chart. Finding support near here but MACD just crossed over.

I have been thinking oil would pull back around here, and the OIH etf looks like it is expecting the same thing. OIH reached it's near term target and looks like it will pull back a little. I would expect that the next pivot point will be a great entry leading up to hurricane season.

No individual stocks tonight. Good Luck,

DT
金币:
奖励:
热心:
注册时间:
2006-7-3

回复 使用道具 举报

 楼主| 发表于 2009-3-19 18:31 | 显示全部楼层
Weakness out there Posted by downtowntrader | 4/10/2006 09:15:00 PM | 0 comments »

I saw a lot of weakness today in some pretty good stocks. Some of the shorts I posted yesterday worked out real nice such as WSO,FFIV, and BBD. There is a chance we get a bounce tomorrow off Alcoa's nice start to the earnings season. Also, some of the indices are oversold on the hourly charts and are at support. Of course, people could take this as an opportunity to take profits on their materials holdings, so be careful tomorrow.

There was a divergence on gold and silver stocks from the actual commodity as happened a few weeks ago. Gold and Silver finished higher while the underlying stocks finished lower. When this last happened we had a quick bounce in the stocks and then they dragged the commodity lower. I will be watching to see what happens this time.
Here are a few charts that look interesting for tomorrow.
MVK is trading a tight consolidation. Watch for a break over the recent highs.
TRN has held above the breakout area and may find support here.
AKS may do well if basic materials runs tomorrow.
AL was running higher after hours and looks like they will gap over resistance.
ENG formed a doji near support although the drop was pretty steep.
EGY briefly cleared resistance and closed right at horizontal resistance. I think it will breakout soon.

I am also still watching everything I posted last night for long and short setups as some are still in a good spot.
Good Luck tomorrow,

DT


Missing Charts Posted by downtowntrader | 4/10/2006 08:02:00 AM | 1 comments »

Here are the missing charts from last nights post. The analysis remains in last nights post.


I forgot this one last night. A reader asked for an update on SMSI. This stock looks bullish, but looks like it will consolidate some of these ains here. I would expect it to drift back to the ascending trendline while the indicators work off some of the overbought readings.

Good Luck,

DT
金币:
奖励:
热心:
注册时间:
2006-7-3

回复 使用道具 举报

 楼主| 发表于 2009-3-19 18:35 | 显示全部楼层
Charts to Watch Posted by downtowntrader | 4/06/2006 10:56:00 PM | 0 comments »

I don't have much time tonight so I will just post some charts.

Bulls defended a gap down today by completing a bullish engulfing pattern in IIP. Long wick may show some resistance above, but IIP is technically over the significant resistance in this range. IIP is up about 38% since first recommended here.
XTRX has consolidated a little bit here and looks ready to roll.
PLXS is out of the triangle already.
RMBS had a nice move today as was one of my better daytrades today. It looks like it will follow through after a strong close.
EGY looks ready to make a new 52 week high.
CMC may be ready to resume the uptrend.
GG hit an all time high today and if Gold can close over 600 watch out.
PAL may be ready to clear this base and break to new highs.
JDSU had a strong close today and held support in the high 3's.
If CMED can push back over 30 then I think the bottom will be put in here with a triple bottom.
BOOM kept chuggin along the trendline and finally cleared it while making an all time high.
SBUX was looking like it may provide an entry here, but was trading near the 52 week high AH. Keep it on watch tomorrow.

That's it for tonight,

DT


Charts of some IBD 100 stocks Posted by downtowntrader | 4/05/2006 10:38:00 PM | 0 comments »

We had some good moves in some of my blog picks from last night including SLW,LEN,FTEK,AUY and LVS. There were a lot of good chart setups today and it seems like there will be follow through tomorrow. Keep on your toes though as when things look nice and sunny is usually when it starts to rain (or snow in Massachuset).

CWTR was profiled on IBD tonight and have been consolidating earnings rally.

FORM held the gap and are testing resistance here.
GDI came back to test the breakout area and had a light volume candle on support.
GYMB dipped down to 20 and got support. They are up to the breakout area again.
ITRI is consolidating in a nice ascending triangle and has held gap support.
THO was also profiled on IBD and chart looks very good.

Be sure to read my look at the indices here from earlier tonight.
Good Luck,

DT


Rally Begininning or Market Top? Posted by downtowntrader | 4/05/2006 10:05:00 PM | 0 comments »

There has been a lot of talk lately about weak internals and whether we are in the processs of topping out and ending the current bull market. I won't bother trying to make a call but I think it's a good time to check out the weekly charts on the major indices.

Nasdaq broke out of a rising wedge and managed to hold above the previous resistance trendline. It just recently broke out of a small triangle consolidation. This all looks bullish to me, but there are divergences on most indicators. You can argue that the past two years were a consolidation and that the move is just beginning.

Dow has been gingerly moving sideways and has not broken out of the current channel. It actually reversed after touching the top last week and may be trying to get back up and test it again. I would say this chart looks more bearish to me unless the trendline is broken.
Russell has been a market leader with the Nasdaq. They broke a rising wedge and appear to be on an accelarating trendline. Looks bullish to me. Indicators don't look bad here either.
SP500 is sort of similar to Dow in that it is still in confines of channel. Unless it breaks the channel I see this as bearish, because a failure to break should lead to a trip to the lower end of the channel.
SP600 looks more like a trend the a consolidation channel. There is still some room to the upside here and indicators look healthy.

The purpose of these charts is not to guess where we are going tomorrow, but to keep the overall perspective in mind. Hopefully these charts help you as they help me.

DT

I will post some stock charts later tonight.


Newer Posts Older Posts Home
金币:
奖励:
热心:
注册时间:
2006-7-3

回复 使用道具 举报

 楼主| 发表于 2009-3-19 18:36 | 显示全部楼层
Watch List Posted by downtowntrader | 4/04/2006 11:06:00 PM | 0 comments »

Indices rose in a lackluster fashion today and didn't do much to the near term technical outlook. I have pretty much tightened my stops as much as I want to on my current positions and continue to mostly daytrade. For what it's worth, I've been more positive swing trading small caps and daytrading short lately. Here are a few charts I will be watching tomorrow.

GILD is breaking out of a nice base here. I added them to my squawk portfolio, but may put some real cash to work here.

LVS is one that is looking pretty good too. Didn't catch it today due to just average volume.
THO chart is looking nice with a little triangle breakout.

TMI also has a nice triangle base. This is a thinly traded stock, but the base is sound.
LEN never confirmed the reverse H&S but may yet come back to break that neckline. I am watching to see if it holds the trendline here.
SLW formed a hammer type candle at two trendline support areas. I don't like the MACD crossover here but it may not really matter if silver keeps trading at multi year highs.
DES is a gold stock that made it on my radar. Nice break of resistance and notice it held the gap as support.
AUY is another good looking gold stock. I believe this is a motley fool hidden or tiny gem pick as well. A little late for an entry, but if it is anywhere near the breakout area I will probably take a shot.
FTEK is coming back to test the previous channel and may get a bounce here.

Thats it for tonight.
Good Luck,

DT


Squawk Contest Posted by downtowntrader | 4/04/2006 04:24:00 PM | 0 comments »

I made my first picks for the Squawk contest this afternoon. I also added a link to that blog on the upper right hand side of this blog that will stay there through the end of the contest. I think this is an interesting experiment to test out how the different Trade-Ideas scans can be used. I have been using a custom short scan the past few days and it has been working very well. QSII, CHS and IDIX were some of the trades I took. I will have my regular post later tonight.

DT


Reversal Again Posted by downtowntrader | 4/03/2006 09:53:00 PM | 0 comments »

It was another reversal day today and once again. Short of time again with MLB full slate, 24 and tax preparation taking as much time as possible from me. I won't be initiating any new swing trades tomorrow, so I am posting a few charts of some current holdings that I feel are close to moving.


ALDA may pull back a little here, but there is a chance that they break out of this consolidation base.
SLW is having a hard go of it here, but buying at this trendline has been rewarded recently.
As I have been expecting, JOYG broke out today. The sector is looking good so follow through looks likely.
MNST looks like they are close to breaking out of this triangle.
I hope some of you were able to get a piece of IIP after I posted the update this morning. They had a nice move today and look like they will clear 1.10 tomorrow.

Also, I am gonna try something new starting tomorrow. I entered the Squawk Box stock contest and will be trading solely using alerts from my Trade-Ideas setup. The tricky part is that the contest doesn't reward daytraders or momentum traders as it uses the closing price from the day you bought the stock. I think my strategy will be to scan for breakouts at 3:30pm and take stocks closing strongly. Either way, you can see all of my picks here.

Good Luck,

DT


IIP Charts Posted by downtowntrader | 4/03/2006 10:24:00 AM | 1 comments »

Since I had saved it as a draft, the IIP post is below the current posts. Click here for it.

Good Luck, and be sure to read my updated posts below.

DT


Missing Charts Posted by downtowntrader | 4/03/2006 12:25:00 AM | 0 comments »

Here are the rest of the charts from last nights post.


STRL is an ethanol play with a decent looking chart.CPO is another ethanol type play which could have a nice move if it clears resistance.
CCJ was looking like a short to me, but is starting to look better. Watch for a break to either side.
CIB cleared resistance, but volume is pretty weak. I would watch to see if volume comes in here.
DRIV came back to test support and held pretty well. This may be the start of a big run.
GDI had a nice triangle break and held support.
HITT cleared resistance and may breakout here.
NWRE is testing resistance and has been strong lately.
RS rejected the pullback friday. I will be watching to see if it can make a higher daily high.
VTIV looks nice breaking out of a bull flag.
If you missed last nights post, check it out here. I will post my IIP charts later this morning, but the short story is I think they are breaking out.
Good Luck,

DT
金币:
奖励:
热心:
注册时间:
2006-7-3

回复 使用道具 举报

 楼主| 发表于 2009-3-19 18:37 | 显示全部楼层
tale of two indices Posted by downtowntrader | 4/03/2006 12:01:00 AM | 1 comments »
Sorry to get this post up so late, and it is incomplete at that. It seems that the Dow and Nasdaq can't move in the same direction. The DJIA is starting to break down as the Nasdaq firms up.

Here is a weekly chart of the DJIA. Notice the deteriorating participation in the rally.
Here is the weekly for the nasdaq. Looks a lot better then it did a couple of weeks ago.

Here are some charts that I came up with tonight.

CLB has been a strong stock and may breakout here.
FDG tried to bounce back but may be failing at 200sma here.
GIL fell out of the IBD100 and looks like it may be failing at the 50.
GRP has met up with stiff resistance. Looks like it will head down a little from here.
IHS is an interesting chart. If it doesn't try and fill gap it will be extremely bullish.
PAAS has come back down to test breakout area.
Most Gold stocks are looking good and TRE is close to a breakout.
CMED made the IBD 100 again and looks to be testing the double bottom pivot point. If it holds, it should go up to test 50sma.
AMD has fallen pretty hard and is testing support. I would think institutions would support it here, but if it falls below the line.......
GRMN has been moving nicely and looks like it may get a bounce here.
IIJI looks to be failing at the 200 sma and 50 may give it the death crossover.
Sorry to make my post so brief tonight, but it has been a long day and it's late here on the East Coast. I have a bunch of chart I will try and post tomorrow morning before the market opens including IBD100 stocks and penny stock special IIP.

Also, A reader posted the following:
"Could you comment on SMSI and its 2 yr chart, it looks like a healthy breakout and key buy pt. Thanks!"

Scott K

Well, Scott, sorry I didn't have time to work up a chart, but I checked it out and SMSI looks good. I wouldn't be buyer here because it is a little extended, but I would expect it to hold 11.60ish from previous top if it pulls back.

Good Luck,

DT


IIP Posted by downtowntrader | 3/31/2006 05:14:00 PM | 0 comments »

Short on time again, so I'm just posting the charts. Here are my IIP charts. Short story is they fell with the internet crash from 111 to .12 cents. They have been trading sideways for some time, and it looks like there is building interest in them. I am personally familiar with some of their products, and I like them. Not sure if it will translate to stock performance but the chart is looking good.
Here is the weekly chart.


Monthly chart showing the big fall.

Here is the daily as of Friday.


As always, please do your own DD.

Good Luck,

DT


Trade Ideas Scan Posted by downtowntrader | 3/30/2006 08:57:00 PM | 3 comments »

As I had mentioned a few days ago, I am testing out the trade-ideas real time scanner. I will post a more thorough review after I have used it longer and learn more of the in's and outs, but let me say that I love this product. Once you learn how to filter out the noise you can get some very high quality setups. While I have been using it primarily for daytrading ideas, I tried tweaking it tonight to scan for swing trade candidates (special thanks to Dan Mirkin at Trade-Ideas for helping me get started). The following four picks are some of the ones that turned up on the custom scan. If you're interested in Trade-Ideas sign up here for a free trial. Let them know downtowntrader sent you.

NETL was the first to turn up and after checking it out, it is number one in the electronic semiconductor manufacturing group over NVDA.ETN was another strong looking stock.
AMLN showed up on an intraday scan for me today and then turned back up on my scan tonight. Strong move today to clear resistance.
MVK was the last one and has been moving steadily since clearing the triangle base.
I wrote about PNRA a few times as it has bounced off the trendline. Took out the high today and had decent volume.
PVH has been pulling back in a pennant. Looks like they may bounce here.

AEM gapped over resistance today.
JOYG looks like they may finally bounce off the trendline. Watch for a break to either side.


Good Luck,

DT
金币:
奖励:
热心:
注册时间:
2006-7-3

回复 使用道具 举报

 楼主| 发表于 2009-3-19 18:38 | 显示全部楼层
Nasdaq and Gold Breakout Posted by downtowntrader | 3/29/2006 10:52:00 PM | 1 comments »

Nasdaq had a strong move today and semis actually participated. It remains to be seen if we will get follow through. Dow showed weakness today and it's funny how the indices appear to have swapped places. GOOG filed to sell 5 million more shares and was hit again after hours. They then finalized the AOL deal, so it will be interesting to see how they impact the Nasdaq tomorrow. AAPL however closed strong and look like they will follow through a little.

Here is chart of Nasdaq. Nice move to 52 week high today on strong volume.
Russell has been leading again and while breakouts out of rising channels are not ideal, you can't argue with the strength here.
Silver has been strong and broke over the year long trading channel.
While silver has been outperforming gold, silver remains a overextended while gold has corrected enough to keep the trend sustainable. Here is a chart of gold breaking the downtrend channel.
GG just broke out of the triangle but still has some resistance to clear.
TRE is another interesting gold play.MACD is just crossing.
MDG just cleared a choppy triangle.
NG is another gold play.
Oil stocks are on the rebound and EGY looks like they are ready to bust out here.
FAST never gave up any of the bullish candle from a couple weeks ago.
NTAP cleared resistance today before pulling back a little. Sector has been hot lately.
CLDN is my only short chart for tonight. This looks shortable if it makes a lower low on the daily.
NSSC broke out on strong volume and tested support already.
SCHK is up to the rising trendline and should move one way or the other soon. I would guess higher.
NBIX has drifted back to breakout area. If they are gonna get support, it should be here.
TRID is pulling back to breakout area.
AAPL had a very strong move today on great volume. I would expect this to be the bottom, but it should get retested in the coming days. I would expect a push to near 50sma before it pulls back to test for support.
SBUX hit another 52 week high and looks to be giving another entry.

Good Luck,

DT


Dow Reversal Posted by downtowntrader | 3/28/2006 10:59:00 PM | 0 comments »

I wasn't around today, but it appears the markets didn't like what the Fed had to say. Most things pulled back but there was some pockets of strength out there. What will be interesting to see is that everyone expects a pullback now, so will the markets trap some bears and go up instead? I started off the night searching for shorts and was surprised to see strength where I least expected it..... home builders. Keep reading for charts.

Here is the DJIA daily chart. Cleary failed to hold support.
Russell held up and is still above support.
Same for Nasdaq who showed more strength then DJIA.
Gold looks like it may fail at the trendline, but it looks like it will pull back to near 20sma and then pop back up.
BBD has a nice head and shoulders forming with neckline shown in red.
Here is the first home builder chart. This chart still looks weak with trendline resistance still holding the stock down, however, todays news should of killed the home builders and DHI got some support late in the day.
Here is the LEN chart. Looks like a reverse head and shoulders to me. Failed to hold the neckline though.
Here is another reverse head and shoulders pattern, also still below the neckline for BZH.
CHK cleared the little triangle it as forming.
CCJ is a possible short setup. Looks like downtrend may be accelerating.
Watch FDG for another break of the previous trendline.
ISIL may be forming a bear flag.
LMS showed some strength today, but would be a short if it fails at this trendline.
PBR is testing the lower end of a base and is looking weak.
RIO has all sorts of resistance above.
UPL also has a little reverse head and shoulders here, not too unlike the one OIH just broke out of.

Good Luck tommorrow,

DT
金币:
奖励:
热心:
注册时间:
2006-7-3

回复 使用道具 举报

 楼主| 发表于 2009-3-19 18:39 | 显示全部楼层
FOMC tomorrow Posted by downtowntrader | 3/27/2006 09:07:00 PM | 0 comments »

I plan on taking most of tomorrow off from trading with FOMC meeting taking place. I will only manage my open positions. I find that most meeting days are lifeless in the morning followed by choppiness after the statement is released. I have noticed that the markets are acting like the rate hikes may be drawing down. Smallcaps and commodities would stand to gain the most from a stop to rate increases and they are outperfoming lately. Smallcaps thrive in low interest rate environments as they tend to borrow money to fund growth. Commodities benefit from a falling dollar and if the fed is done and Japan is starting rate increases, then the dollar will probably weaken some. It will be interesting to see what actually happens. Here are a few charts that are worth watching.

NOIZ has been getting strong support as seen by the long lower shadows and closes near upper range. May be ready to run up here.
GG bounced off the 50sma and has made it to a new closing high.
BOOM has yet to take out the rising trendline resistance but has managed to make consecutive higher pivot lows.
CMED may complete a double bottom here and just broke the falling trend channel.
MNST is gently easing to a support trendline.
NICH just cleared some resistance and is close to taking out all the tall wicks.

Thats it for tonight. Good Luck,

DT


Trendline Retest Posted by downtowntrader | 3/26/2006 10:03:00 PM | 0 comments »

One concept shows up in several of the charts tonight. Usually when a stock breaks a resistance trendline, it comes back to test the trendline as support. It doesn't always happen, but I would say it happens more often then not. This is one good reason why it doesn't pay to get anxious and chase up a stock. Also, when you have this opportunity, it usually is the safer entry, because it is near a logical stop loss area. Well, I have lot's of charts tonight, so let's just dive in.

Russell is technically trading a bearish rising flag, but looks like it has penetrated resistance.
Nasdaq has been pretty choppy but looks like it has turned back up a little.
OIH looks like it has formed a little reverse head and shoulders pattern.
Japan iShares (EWJ) looks like it has tested support and held.
Gold and other precious metals have been turning back up. Here is an updated chart on GLD. It would be a bullish breakout if it can clear the upper resistance.
CLDN looks like it is holding support.
DRQ followed through on the breakout. Usually there is pullback to test support, so I will be watching them.
INFA looks like it will resolve into and ascending triangle.
I mentioned NGPS and they had a decent day. This weekend, they were added to IBD100 so there may be some more interest next week.
PTRY is above resistance, so it may just be a matter of time here.
I am seeing some nice moves in steel stocks and RS is one of them.
SCHK came back to test support and bounced.
SCSS may rest a couple days and then turn higher.
TSCO has a little more room to the upside here.
TWGP is another stock that pulled back to test support.
USG may be ready to finish testing top of base.
More of the same with WCC testing the breakout area.
INT has been really strong and cleared all resistance.
ENG looks like a lot of the oil service stocks with a little ascending triangle after a pullback.
TRID had a nice breakout Friday.
NTAP is holding above support and networking has been hot lately.

AKS is another steel stock that has been looking good.
JOYG is also holding above support.
PAAS just cleared resistance and looks the least overbought of the silver stocks.
DBRN is another support retest play.
PVH is holding strong not giving up much of the breakout while it consolidates.
NVDA broke a triangle to get to a new 52 week high.
ALDA is a thin low float stock of a great company. May be a decent buy at bottom of channel, plus I really like their NV shaft.
PRLS has fought back from a steep pullback and just hit a new 52 week high.
Last chart is an intersting view of SUF. Here is the weekly chart showing...... you guessed it, a retest of support.

I haven't posted any short charts tonight because I already have a nice list to watch in case the markets reverse here. Most of the shorts I have mentioned over the last week are still in play Hope these charts help in your trading. Good Luck,

DT
金币:
奖励:
热心:
注册时间:
2006-7-3

回复 使用道具 举报

 楼主| 发表于 2009-3-19 18:41 | 显示全部楼层
Watch List Posted by downtowntrader | 3/23/2006 10:15:00 PM | 2 comments »

Not much to say about market action today, other then smallcaps showed a little strength. GOOG was up afterhours on news that they are gonna be added to SP500. It will be interesting to see how Nasdaq performs tomorrow. Here are some charts that will be on my watch list.

NGPS chart is looking very pretty. Looks like triangle is broken.

I am watching MNST to see if it will pullback to trendline. I am waiting for the next higher high.
AKS looks like it is ready to move here.
GG had a nice move off the 50sma and is still the healthiest of the gold stocks. Most gold stocks were nicely today despite gold finishing a little lower.
Silver is the hot metal, and SLW is still my favorite play in the sector.
PAL is another metals play in the less followed paladium market.
PSYS gave back yesterdays gain and failed at the 50sma.
PWR may be a little extended, but I will be watching it for a move.
CLB is back for a test of the trendline.
EGY has held up reasonably well in the energy pullback, and looks like it will challenge the trendline.
AEOS found support and may be good for a quick trade.
Here is an updated chart on HD. I mentioned a couple days ago that HD should break resistance and it has on decent volume.
I'm hoping for a shot at PNRA near the trendline.

Good Luck,

DT


IBD 100 Stocks Posted by downtowntrader | 3/22/2006 09:42:00 PM | 3 comments »

Here are a few stocks in the IBD 100 that are near their breakout areas.

CAT tested support and bounced higher today.
CHE looks like it wants to hold above the previous channel.
HITT is pretty volatile but has held above my previous resistance line. Still some overhead supply though.
ERS has been getting good support near the breakout area.
WCC pulled back and looks like it may get a bounce here.
PTRY has been trading a very tight range the past few weeks. Starting to move up a little, so I am keeping an eye on it.
DRQ is technically a former IBD 100 stock and the chart is not as healthy as the ones above. Still, it looks like it may break out of this contracting triangle.

Thats it for tonight as I am celebrating my birthday. Good Luck,

DT
金币:
奖励:
热心:
注册时间:
2006-7-3

回复 使用道具 举报

 楼主| 发表于 2009-3-20 06:59 | 显示全部楼层
Top Reversal day Posted by downtowntrader | 3/21/2006 09:11:00 PM | 0 comments »

All the indices reversed from breakout moves after Nasdaq couldn't follow through. While this may not be the nail in the coffin, it looks like there will be some near term weakness or nervousness. Small caps have been hammered in the past two pullbacks, so I have trimmed back substantially on my swing holdings. It's much easier to jump on a breakout rally then to try and salvage gains in a sharp pullback. Most of my money was made on the short side today, save for a Home Depot long trade and I feel that the easier money may be on the short side the next few days. If still like some longs, specifically in the retail sector. HD cleared resistance today, but closed back in their base. There are some interesting retail charts below that could move nicely if HD or WMT can spark a retail rally.

Here is my Russell Index chart. Not much to say that the chart doesn't show.
IWM is the ETF if you wish to play the Russell directly. Near mirror image of course.
CMC broke an ascending triangle base on very nice volume.
I try to keep an eye on stocks that have been removed from the IBD 100 for breakdowns. This is one that has fallen apart. It looks like FDG has fallen pretty far, but look at the previous pullbacks as examples that there may still be downside here.
ISIL is another IBD removal that broke down and is retesting support.
LVS is slipping under support and the 50 sma. Keep an eye for a breakdown.
RTP has a clearly defined channel here. This should be a swing trade as it is pretty hard to trade $100 plus low float stocks.

TRAD looks similar to GROW chart from last night, which worked out as a decent short. Watch for key support here.

Here is the first of the interesting retailers. Very strong move for PVH and closed at high of day in a weak market.
DBRN had a milder breakout, but closed at a new high.
TJX is another retailer that broke out of a solid base.

I still maintain that this environment is better suited for short timeframes.
Good Luck,

DT


Tech and Construction Rally? Posted by downtowntrader | 3/20/2006 09:42:00 PM | 0 comments »

More sideways action today. I've been half expecting the markets to turn down, but there may be a chance that the Nasdaq plays catchup first. Chips are pretty oversold and some tech names are looking downright bullish. CSCO has been leading a networking run, and MSFT and IBM have looked pretty decent. There is also a chance the GOOG may be holding gap support (chart below). As always, I am waiting for the market to tell me which way to go, and I continue to keep ample cash in reserves.

There are also some contruction related charts that are looking good and basic materials continues to act well.

Let's start with HD. They are trading an expanding wedge, and there is a chance that they break it on this test of the upper trendline.

FAST broke out of a similar expanding wedge and looks like they are moving higher.
STRL had a nice move today and is currently testing gap resistance. The gap will be resistance until they can close above it.
NOIZ had a nice move today on huge volume for them. This is a pretty choppy stock so trade carefully.
RIO broke down and is testing resistance.
BOT is resolving into a deep cup and handle base. Watch for a move over the pivot point.
ERS is the number 1 stock in the IBD 100 and just broke out of an ascending triangle. They need to clear the previous high and there are indicator divergences, but this chart looks bullish.
HITT is clearing a choppy triangle base here.
NTES is another volatile stock that just cleared resistance.
TWGP is yet another choppy base that has broken out.
JOYG has been a very solid stock and just made a new 52 week high today.
GFIG may fall apart here, but keep an eye on it as it may also find support.
HELX looks like a decent low risk short opportunity.
GROW is testing major support here.
TRE looks like it broke support here.
Here is the GOOG chart. Notice the candle patterns confirming gap support and it closed almost on the 200 sma.
Should be an interesting week. Good Luck,

DT
金币:
奖励:
热心:
注册时间:
2006-7-3

回复 使用道具 举报

 楼主| 发表于 2009-3-20 07:00 | 显示全部楼层
Charts - Long and Short Posted by downtowntrader | 3/19/2006 09:36:00 PM | 0 comments »

Lots of charts tonight. I am seeing opportunities for both longs and shorts, but as I ave been doing, I am keeping my trades on a short leash until I feel comfortable with the market direction.

PWEI coming back for another test of resistance.
PEIX could break out of this triangle soon.
QCOM looks very good here.
MNST hit a new 52 week high and closed above resistance.
WMT looks like it has broken the downtrend here. While I don't normally trade big caps, it makes sense to watch a stock that can move the entire sector. I would expect a little pullback off the 200sma and a retest of support.
CHE looks like it broke out of the recent channel.
PLAY is struggling here and 50 has curved down noticably.
CAT looks pretty healthy.
CRDN looks like it may fail to hold support here. Watch for the break first.

CTRN may trade down this channel.
I will be watching DRIV to see if it can take out formidable resistance. Pretty volatile moves on this stock over the past year.
EXP may be breaking out here.
CCJ is looking a little weak. Keep an eye for a failure at the 50sma.

CLDN is another possible short, although there is a chance it get some support around here.
GOL took a pretty good hit on high volume and is struggling. Looks like it will pull back and test support again.
GYMB is trying to break out here.
PETS has had a hard time breaking out of this tight range, but may of done it.
TSU is one I am keeping an eye on for this week.
ARD broke out of the downtrend and then tested support. Looks like it may get a move up here.
DNA had a pretty strong move friday and stopped right at 200. Watch to see if it can break out.
MTXX is trading near the bottom of a triangle here. Watch for a move either way.
TTI has been holding above it's recent break of consolidation and should be poised to move higher.

By the way, I posted a market update earlier tonight (see below).
Good Luck,

DT
金币:
奖励:
热心:
注册时间:
2006-7-3

回复 使用道具 举报

 楼主| 发表于 2009-3-20 07:00 | 显示全部楼层
Dow and Sector Charts Posted by downtowntrader | 3/19/2006 08:20:00 PM | 0 comments »

The DOW is at new recovery highs and CNC keeps reminding us about it. Is this a bullish breakout? I will be the first to admit that I don't know where we are headed. However, there are some things that are troubling with this breakout and most technical analysts are noting it, regardless of what the mainstream media machine is pumping. Here is a chart of the DJIA. We have some divergences, however, price action is pretty good.
However, look at it from this view (weekly). We are sitting at the top of the channel and market internals are hinting that we may not have the strength to break out. Look at declining high lows at the three peaks. Unless Nasdaq and Russell confirm this move, I feel the DJIA breakout will fail.

Here is another weekly chart that is very interesting. The gold index looks pretty toppy and MACD just crossed over.
If you look at the daily chart, you can see the gold index struggling with the previous support trendline.
Here is the street Tracks gold ETF (gld). Looks like a corrective channel to me.
Silver still looks pretty healthy, if not a little toppy. I'm not sure how silver will react if gold takes a hit, most indicators are confirming this move and not diverging.
Here is the daily chart on the silver contract.
Here is another sector that I am finding to be more and more interesting. I've highlighted this chart recently along with some retail plays. As I was reviewing the IBD 100 this weekend, I noticed that a lot of retailers are creeping in to the list. I also have noticed over the past few weeks that energy stocks have been falling out. If you look at the retail holders chart you can see why.

Here is the retail index chart which also looks pretty bullish. Now, I not saying rush in and get your retail stocks as we may have a little pull back in some of them. But I would definitely keep an eye on the sector.
Copper also had a very nice move last week.
Here is the basic materials spdr and although I was worried about volume action on it earlier, it has broken resistance and this is one of the sectors helping the djia advance.
Stay tuned for stock specific charts later tonight.

DT


DSL problems Posted by downtowntrader | 3/16/2006 05:09:00 PM | 0 comments »

Still having all sorts of DSL problems at home, so there will not be an update tonight again. I was going to take tomorrow off due to options expiration anyways. Here are updated Nasdaq and Rus charts. Good Luck to those trading tomorrow.


Just one Chart Posted by downtowntrader | 3/16/2006 09:25:00 AM | 0 comments »

I will be tied up most of the morning so I will only post one chart. LVS is bouncing off the trendline and 50 sma. Huge down volume , but if it can hold up, you could get a couple points on a swing.

Good Luck,

DT


No update tonight Posted by downtowntrader | 3/15/2006 10:57:00 PM | 0 comments »

Strong day today with SP500 and Dow making new highs. Nasdaq and smallcaps are lagging overall, although price action was solid today. I am having DSL problems, so there will not be an update tonight. I will try and post an update tomorrow morning. Be careful tomorrow, particularly in the afternoon with options expiration on friday.
Good Luck,

DT


Missing Charts Posted by downtowntrader | 3/15/2006 09:38:00 AM | 0 comments »

Here are the missing charts from last night.


Newer Posts Older Posts Home
金币:
奖励:
热心:
注册时间:
2006-7-3

回复 使用道具 举报

 楼主| 发表于 2009-3-20 07:01 | 显示全部楼层
Breakout Charts Posted by downtowntrader | 3/14/2006 11:38:00 PM | 0 comments »

Sorry about being brief today, but I am short on time. To add to the problems, blogspot is having problems uploading graphics. I will post the following charts tomorrow.

WCC - triangle breakout
SCHK - triangle breakout
MFLX - testing upper resistance
FCFS - breakout
CRDN - possible breakdown
IBM - New rally
VLO - testing resistance at 57ish
SBUX - resumption of uptrend?
MNST - headed towards upper end of channel
AAPL - Testing downtrend line resistance with positive divergences

Good Luck,

DT


Trade Ideas Posted by downtowntrader | 3/14/2006 12:31:00 PM | 1 comments »

I am looking at making the trade ideas scanner an addition to this page, similar to what trader mike is doing. It is at the bottom of the page and it updates every thirty seconds. Feedback is appreciated if this is something you would find useful. I all also try out the product and let everyone know what I think. Thanks,

DT


Interesting Charts Posted by downtowntrader | 3/13/2006 09:38:00 PM | 0 comments »

Another sorry day as after the initial pop, the markets did nothing the rest of the day. It's a mixed bag right now for the indices and I am still keeping most of my trades to very short timeframes.

ERS looks like it is resolving into a triangle. Keep an eye on this one as it has been the top stock on IBD 100 for a few weeks now.
BWNG looks like it is ready to move after a quick consolidation.
I seeing mixed charts out of retailers. BBY is one that looks decent. The intraday chart is showing a nice triangle.
AEOS has been advancing well after breaking out of a reverse head and shoulders base.
ANF is a retailer that looks pretty sad right now. Just started leaking out of the channel, and although it has gap support below, it could unwind pretty quick if retailers or markets take a hit.
CHS broke down and has climbed back to previous trendline on declining volume. Watch for a breakdown.
GROW may have bottomed here.
UBB is testing previous support as resistance. This looks like a short to me if it makes a lower low or if it breaks back down under the 50 sma.
JPM may get a bounce here after a sideways consolidation.
Thats all for tonight. Good Luck and Good Trading,

DT


Cramer is an Idiot and some charts Posted by downtowntrader | 3/12/2006 10:50:00 PM | 0 comments »

Smallcaps have been hit hard lately, and while they are lagging the big boys, I think they may get a run this week. Here is my Russell chart.
ABAX took a pretty steep pullback to trendline support and had a nice bounce.
Emerging markets have also fallen, but BBD is still within the uptrend channel.


USG started to rise from the bottom of the current trading range.
COST has been looking good.
PNRA is bouncing off the trendline and looks like it is breaking out of the current pullback.
PAAS bounce off the lower trendline.
Cramer is an idiot. Someone called in on the lightning round Friday, and he said something along the lines like how can you think GG and SLW are in the same class and that they should trade in to PAAS. Doesn't he realize that GG owns 62% of SLW?
AUY has held up OK as far as gold plays.
TTI barely defended it trendline at first, but came back strong.
BOOM is starting to get interesting.
MNST had a nice bounce off the 50SMA.
GFIG looks like it may fall apart here.

Good Luck,

DT
金币:
奖励:
热心:
注册时间:
2006-7-3

回复 使用道具 举报

 楼主| 发表于 2009-3-20 07:02 | 显示全部楼层
No update tonight Posted by downtowntrader | 3/09/2006 06:30:00 PM | 0 comments »

I won't be posting tonight. It is my daughter's 1st birthday and we will be celebrating. Good Luck tomorrow.

DT


Late bounce Posted by downtowntrader | 3/08/2006 10:16:00 PM | 0 comments »

We got a bounce starting around middle of day as expected, although the close left much to be desired. Tomorrow is a key day to see if we get follow through on a recovery rally. At this point it looks like a retracement rally and not the beginnings of anything special.

Small caps have been getting hammered lately and Russell finally decided to fight back. Looks like a possible head and shoulders forming if we get a bounce that stops on the red trendline.
While Gold looks like it's beginning a deeper correction, Silver is still within the channel. Silver has been stronger for some time now, and while precious metals tend to trade together, Silver is the clear leader.
SLW has sold off a little too quick and hit the 50% retracement today. I added to my position this morning.
PAAS is another silver play if we get a bounce.
Biotechs were strong today and look like they may build on those gains. ILMN has been trading a tight channel.
NBIX chart is self explanatory.
GILD got a nice lift off the 50sma and trendline support.
Financials also look ok, and JPM is trying to clear consolidation.
AKS pulled back a little but got support.
The other sector that has looked good is retailers. AEOS cleared a reverse head and shoulders type base and is completing a continuation candle pattern.
BBY looks like it is breaking a pennant consolidation.
CVS broke through a nice ascending triangle.

JCP has held it's breakout and has been consolidating very well.
BNT may be forming a double bottom here. Keep in mind that buying under the 50sma is risky.
JCOM has climbed back to the top of the trendline. Watch for a move to either side.
PEIX is testing lower trendline of triangle.
QCOM had a nice move on volume today.
Good Luck,

DT


Bounce back rally Posted by downtowntrader | 3/07/2006 08:32:00 PM | 0 comments »

It is looking like we may get the technical bounce I was expecting tomorrow. Dow eeked out a gain today and SP held 1270. NAS was hammered all day by chip stocks and fell through back in to the wedge. While this is bearish, the hourly chart is pointing to some near term support. However GOOG was down AH and may weigh down on the index. I am looking at mostly longs as shorts are likely to get chopped around. If we have a negative day, I will probably look back to oil sector for some plays.

Here is the Russell. Notice it is right at a trendline. If it falls, then look for redline as next support.
Here is the nasdaq falling back in to the wedge.
ISE broke to new highs this afternoon. I was expecting most of the exchanges to do well in sympathy to NYS beginning to trade tomorrow, but all of them save for ISE were beaten down pretty bad.
EZPW showed some nice strength the past couple days with markets falling apart and them breaking to new highs.
PAL reversed course and is in danger of breaking the 50 SMA. Should make a nice short if metal's keep getting hammered.
JOYG has pulled back after strong earnings, and is setting up for a test of the trendline.
AMD has been acting very weak and looks to be testing the trendline and 50 sma. If markets stage a recovery rally, AMD may get a boost.
MRVL broke serious support and was my best daytrade today. If markets bounce, then I will be looking to short it again near the trendline (if it can't hold of course).
FFIV has pulled back to ttrendline and no serious technical damage has been done here.
TRN is setting up for a test of trendline support and had a doji at support.
TRAD gave back yesterdays gains but has held the trendline. Watch tomorrow's action for a break to either side.

While I am thinking we get a bounce soon, I don't think it will be the beginning of any sustained move. Trade cautiously.

Good Luck,

DT
金币:
奖励:
热心:
注册时间:
2006-7-3

回复 使用道具 举报

 楼主| 发表于 2009-3-20 07:02 | 显示全部楼层
Is Gold entering a deeper correction? Posted by downtowntrader | 3/06/2006 10:39:00 PM | 0 comments »

As I posted earlier, the divergence between GLD and gold stocks shouldn't last too long. I was expecting Gold stocks to turn up, and the did for a couple days, and now they all turned down in unison. There is a chance that we have made a near term top in gold, but we have to wait for confirmation. Here is a chart of GLD. GLD is an ETF that trades gold bullion. The gold index chart is similar to this one. It has been trading this channel nicely and bounced recently off the trendlline and 50sma. It started to trend higher before todays sharp pullback. Watch the trendline and 50sma over the next couple of days to see how GLD reacts.GG has been the strongest gold stock. They gapped higher on earnings news, and then pulled back most of the day until a little run in the afternoon.
NEM broke out of the primary channel, and may get a bounce in the previous channel.
AUY fought back today and closed above support.
PCU is not a gold stock, but I think it's worth mentioning that most metals trade together. PCU is near a trendline, and if we get a bounce in precious metals. I would expect PCU to follow suit.
TRE is has had support on this trendline before and is also trading in an ascending triangle base.
Be sure to read my posts from last night below.
Good Luck,

DT


Monday Night Update Posted by downtowntrader | 3/06/2006 10:02:00 PM | 0 comments »

Here are some charts for tomorrow.

LIFC had a strong move prior to earnings release tomorrow. Let's see if someone knew something, or if retail's are getting screwed.
GFIG is in danger of falling below channel.
GOL may break below support here.
HANS is acting like a leader again, and showed nice strength in a down market today.
RACK also showed strength and is trading near high.
NGPS has broken downtrend and is now in a nice little uptrend. They released after hours are were trading higher.
A reader asked for an update on CKCM. CKCM fell below support and is trading under 50 sma. It is wavering at support on the weekly chart. I wouldn't short for several reasons one being that any news will send CKCM gapping higher because earnings were actually pretty good. Another is that CKCM may be at support from the 61.8% retrace of the last leg up. I am flat on CKCM and waiting to re-enter.
ENG had a nice break of the pennant type consolidation.
HAL will be a good play if OIH gets a bounce in the next couple of days.

Thats it for tonight. I will be posting my gold charts tomorrow. GLD is back at trendline and may of double topped. I also have a few gold stocks to watch in case of a bounce.
Good Luck,

DT


Nasdaq Picture Posted by downtowntrader | 3/06/2006 08:29:00 PM | 0 comments »

My apologies for not getting this out sooner. I was having problems uploading earlier today, and I was swamped all afternoon. Here are some of my charts on the Nasdaq. In trying to gauge where we are we need to take a step back and look at the bigger picture.

Looking at the monthly chart, you can see that the Nasdaq has been trading sideways (or drifting up) for the past two years after the first move up from the .net crash. In the grand scheme of things we are near 4 year highs.

Here is the weekly chart for the past three years. The nasdaq has clearly broken a rising wedge which can only be classified as bullish. However, the red channel depicts a possible new trading range as the uptrend accelerates. The nasdaq is currently in the upper range of the channel and the MACD crossed down today which may be near term bearish. The Nas can drop over 100 points from here an still be in the rising channel.
Here is my daily chart. This takes a closer look at the red channel in the weekly chart. There are clear channels within the overall trend, however, things get a little messy towards the end. The nasdaq was pulling back in a bullish pennant recently and broke above it, however, it is currently testing that pennant. In doing so, it may of formed a double top, or may be resolving into a triangle (shown in dotted purple). I can't predict what will happen as much as I wish I could, but market internals have been a little bearish and indicators are diverging. There is a chance we bounce between the blue and purple lines until the direction is decided.
Here is the hourly chart. Rising channel is broken and Nas stopped at 200ema. Indicators are oversold, so it looks like Nas will get a technical bounce tomorrow.

So, as Austin Powers would say "but what does it all mean?". I can't predict which way we are going, but there are clues to the near term direction. The weekly MACD crossover, signals a possible downtrend over the next few weeks. The daily is showing possible support, but plenty of resistance overhead, and the hourly is showing oversold conditions. My guess, and this is only a guess, is that we get a technical bounce soon, followed by more choppy action. I wish I could provide a more clear picture, but if it was that easy, I would be on a golf course in Hawai. Good Luck and I will post a few charts later.

DT


Charts to watch
金币:
奖励:
热心:
注册时间:
2006-7-3

回复 使用道具 举报

 楼主| 发表于 2009-3-20 07:05 | 显示全部楼层


As I posted earlier, the divergence between GLD and gold stocks shouldn't last too long. I was expecting Gold stocks to turn up, and the did for a couple days, and now they all turned down in unison. There is a chance that we have made a near term top in gold, but we have to wait for confirmation. Here is a chart of GLD. GLD is an ETF that trades gold bullion. The gold index chart is similar to this one. It has been trading this channel nicely and bounced recently off the trendlline and 50sma. It started to trend higher before todays sharp pullback. Watch the trendline and 50sma over the next couple of days to see how GLD reacts.GG has been the strongest gold stock. They gapped higher on earnings news, and then pulled back most of the day until a little run in the afternoon.
NEM broke out of the primary channel, and may get a bounce in the previous channel.
AUY fought back today and closed above support.
PCU is not a gold stock, but I think it's worth mentioning that most metals trade together. PCU is near a trendline, and if we get a bounce in precious metals. I would expect PCU to follow suit.
TRE is has had support on this trendline before and is also trading in an ascending triangle base.
Be sure to read my posts from last night below.
Good Luck,

DT


GFIG is in danger of falling below channel.
GOL may break below support here.
HANS is acting like a leader again, and showed nice strength in a down market today.
RACK also showed strength and is trading near high.
NGPS has broken downtrend and is now in a nice little uptrend. They released after hours are were trading higher.
A reader asked for an update on CKCM. CKCM fell below support and is trading under 50 sma. It is wavering at support on the weekly chart. I wouldn't short for several reasons one being that any news will send CKCM gapping higher because earnings were actually pretty good. Another is that CKCM may be at support from the 61.8% retrace of the last leg up. I am flat on CKCM and waiting to re-enter.
ENG had a nice break of the pennant type consolidation.
HAL will be a good play if OIH gets a bounce in the next couple of days.

Thats it for tonight. I will be posting my gold charts tomorrow. GLD is back at trendline and may of double topped. I also have a few gold stocks to watch in case of a bounce.
Good Luck,

DT


Here is the weekly chart for the past three years. The nasdaq has clearly broken a rising wedge which can only be classified as bullish. However, the red channel depicts a possible new trading range as the uptrend accelerates. The nasdaq is currently in the upper range of the channel and the MACD crossed down today which may be near term bearish. The Nas can drop over 100 points from here an still be in the rising channel.

Here is the hourly chart. Rising channel is broken and Nas stopped at 200ema. Indicators are oversold, so it looks like Nas will get a technical bounce tomorrow.

金币:
奖励:
热心:
注册时间:
2006-7-3

回复 使用道具 举报

 楼主| 发表于 2009-3-20 07:11 | 显示全部楼层
Charts to watch Posted by downtowntrader | 3/05/2006 09:39:00 PM | 0 comments »

I will be posting my nasdaq charts to give a better perspective of where we stand either later tonight or tomorrow morning. To sum it up though, we are trading above resistance on the weekly chart and wavering on the daily. I would expect more sideways action the next few days, but I think we are close to moving in one direction or the other.

One thing to mention real quick. I saw it mentioned on a board the other day that I listed so and so stock first on my list so it was one of my preferred plays. I just want to clear up, that the stocks are listed in no order whatsoever. I go through my charts and save them all into a folder as I go along. When I'm done I upload them all to the blogger in whatever order I happened to save them. It isn't until I review the blog that I decided which I am more likely to play. Also, one of the intentions of my blog is to post what is on my watchlist and how I use technical analysis to indentify high probability trades. Please keep in mind that several of my charts don't produce the action I was looking for and therefore I don't enter the position. Also, sometime I post a mix of charts so that I can have options available if the markets decide to surprise me.

Lot's of charts tonight with a good mix of both short and long.

PWEI sold off after earnings, but has come back strong and look at volume for past two days.
CWTR was mentioned last week and I still think it's a short. Set a tight stop as it is near it's high if you do short.
DGIN looks like it may bounce off resistance line.
FDG broke out of a contracting triangle and may be headed higher.
TTI looks good here and has room to run.
ATI looks similar to TTI and has blue skies above.
DNDN has been fighting this downtrendline for a while. The trend is your friend.
LUM may break down here.
TRAD has been hugging it's channel lately. Watch for a move in either direction.
CPWM has formed a nice ascending triangle, but looks like it will fall out of the bottom of the triangle. 200 sma is strong resistance.
NILE is another possible short. It is up against gap resistance and had a long wick with the rest of the market Friday.
CTRN just broke a trendline so it looks like it is in trouble.
PEET has been a weak stock and looks like it may break down from the descending triangle.
JCOM may still head to upper trendline, but it looks pretty weak here.
EZPW has held above the breakout area, so a move higher is more probable then a breakdown.
FCFS looks like it has more support then resistance here.
I looked at KEYS as a possible long the other day and it looks like it is broken. Watch for a lower low if you are gonna short it.
USG looks like it is gonna hold support and bounce to upper range.
WSO is right at support, so watch to see if it bounces or breaks down.
OXPS is running out of room and will probably make a move now. My guess would be higher.
PMTI broke the downtrend but has to get over the redline before I would get excited. If it gets back into the horizontal channel, it may go back to top of range similar to CWTR's chart above.
HOMS had a nice break of the triangle Friday.
RATE is looking weak but has a nice clear channel defined. Also, looks like 35 is clear support.


Good Luck and good trading,

DT
金币:
奖励:
热心:
注册时间:
2006-7-3

回复 使用道具 举报

您需要登录后才可以回帖 登录 | 立即注册

本版积分规则

本站声明:MACD仅提供交流平台,请交流人员遵守法律法规。
值班电话:18209240771   微信:35550268

举报|意见反馈|手机版|MACD俱乐部

GMT+8, 2025-7-20 23:18 , Processed in 0.052965 second(s), 9 queries , MemCached On.

Powered by Discuz! X3.4

© 2001-2017 Comsenz Inc.

快速回复 返回顶部 返回列表