- 金币:
-
- 奖励:
-
- 热心:
-
- 注册时间:
- 2006-7-3
|
|

楼主 |
发表于 2009-3-20 15:42
|
显示全部楼层
Monday, January 05, 2009Daily Range Contraction - Mystery Chart
Jamie is a fan of "hunting for focus list stocks from the dailies and setting alerts at key S/R levels to prepare for the trading day ahead". Following the principle that range expansion follows range contraction (RC), I use a custom indicator to help scan the dailies for RC or box setups.
The first chart below is a daily chart of FWLT which Jamie traded last Friday - see Box Trade post. Notice the range contraction (RC) indicator at the bottom of the chart. A low reading on the RC indicator denotes range contraction. A low RC reading almost always involves narrow range bars of some flavor (NRB, NR7, NRIB). Following the low reading coming into Friday, FWLT has had two days of range expansion (upside).

The second chart (mystery chart) has a good RC setup for tomorrow. Do you know this stock?

[url=] [/url] [/url]
Posted by Jim at 1/05/2009 11:54:00 PM 7 comments 
Labels: Box_Play, Daily, Focus_List, NR7, NRB, NRIB
Analyzing the Trades -
 A reader submitted the following four trades and asked me to analyze NOC and PHM for possible tips on how to pick good setups from mediocre setups in real time. He trades on the 10 minute timeframe, so all the charts are displayed on the 10 as opposed to the usual 15 min. A reader submitted the following four trades and asked me to analyze NOC and PHM for possible tips on how to pick good setups from mediocre setups in real time. He trades on the 10 minute timeframe, so all the charts are displayed on the 10 as opposed to the usual 15 min.
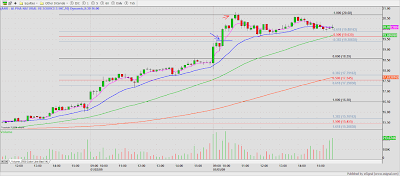
The best setup, IMO is the BTU because we have IBs, green on green, in the upper half of the ORH with the PDH holding as support, so I would rate this setup as A+.
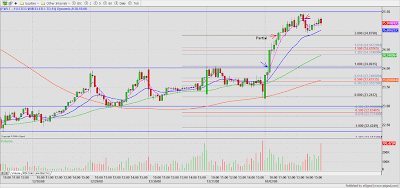
The only thing I don't like about ANR, is the entry occurs in the R-zone (retracement zone), which is often a consolidation area. I had ANR and ACI as early leaders (outliers) on my watch list, and I decided to go with ACI (break of ORH at the whole $ level). The entry point is a good distance away from the Fib. extension (R-zone) of the PDL to the ORH . ANR had bigger relative volume, but I thought ACI had a better base and higher chance of running given the distance from the R-zone.
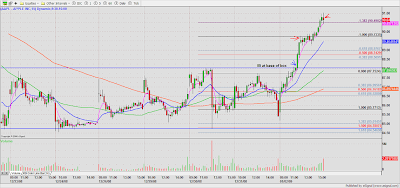
 The opening range for NOC is very wide, so I would place my Fibs from the ORL to the ORH and extend from there. Price consolidates in the upper third of the OR and breaks out. The entry is good, but shortly after breaking, price stalls. The doji shooting star is a red flag and I would take some money off when price moves below the low of the SS. The trader in question, tightened the intial stop and was stopped out as depicted in the chart below. If the inital stop plus 2 cents had not been tightened, it would have held as support. The opening range for NOC is very wide, so I would place my Fibs from the ORL to the ORH and extend from there. Price consolidates in the upper third of the OR and breaks out. The entry is good, but shortly after breaking, price stalls. The doji shooting star is a red flag and I would take some money off when price moves below the low of the SS. The trader in question, tightened the intial stop and was stopped out as depicted in the chart below. If the inital stop plus 2 cents had not been tightened, it would have held as support.
The only thing I could add as a secondary strategy, you might want to take half off after a shooting star and leave the balance with the original stop.
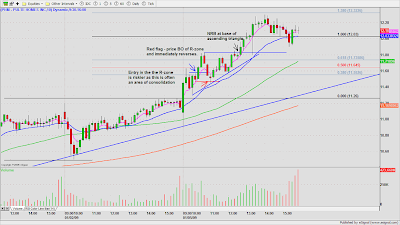
 The PHM setup is my least favorite of the four trades. Not only does it execute in the R-zone, but it's also less orderly. However, it does have decidedly more volume on green bars than red, so there's a strong bias towards a continuation long. The PHM setup is my least favorite of the four trades. Not only does it execute in the R-zone, but it's also less orderly. However, it does have decidedly more volume on green bars than red, so there's a strong bias towards a continuation long.
If price moves out of the R-zone and immediately reverses back in, it's a red flag - keep it on a tight leash. In this case, PHM carved out a dark cloud cover candle and retraced quite sharply. If you're using intraday pivots, price popped above R2 and couldn't hold it, so time to take some money off to protect capital.
PHM eventually carved out an ascending triangle with a low risk entry and had a nice run.
 In summary, I would say that the trader had a good day, despite a 50% stop out rate on the morning trades, the winners both reached the 100% Fib. extensions and the stop outs were managed for minor losses. The only caution I would stress is picking spots away from the R-zone unless the setup is otherwise perfect like ANR. In summary, I would say that the trader had a good day, despite a 50% stop out rate on the morning trades, the winners both reached the 100% Fib. extensions and the stop outs were managed for minor losses. The only caution I would stress is picking spots away from the R-zone unless the setup is otherwise perfect like ANR.
Related Post: Understanding Fibonacci
[url=][/url]
Posted by Jamie at 1/05/2009 09:57:00 PM 5 comments
Labels: Fibonacci, Pivot Point, retracement_zone, Support_Resistance
Sunday, January 04, 2009Technical Picture - Inverse H&S
 Welcome to 2009. The first trading day got off to a good start if you're a bull. We finally broke out of the inverse head & shoulders pattern we've been talking about over the last month. If the breakout doesn't fail in the coming days, I'm expecting at least 150 point move north from the breakout point. Welcome to 2009. The first trading day got off to a good start if you're a bull. We finally broke out of the inverse head & shoulders pattern we've been talking about over the last month. If the breakout doesn't fail in the coming days, I'm expecting at least 150 point move north from the breakout point.
[url=][/url]
Posted by Jamie at 1/04/2009 11:28:00 PM 4 comments
Saturday, January 03, 2009Box Trade - Apple Inc. (Public, NASDAQ:AAPL)
 A reader asked what is the easiest setup to master. I would have to say that basic chart patterns such as C&H, flags, and H&S along with the box trade are relatively simple setups to execute. I usually look for box trades from my watch list. I look for stocks basing in a narrow range over a period of three days or more. The longer and narrower the box, the more powerful the setup. A reader asked what is the easiest setup to master. I would have to say that basic chart patterns such as C&H, flags, and H&S along with the box trade are relatively simple setups to execute. I usually look for box trades from my watch list. I look for stocks basing in a narrow range over a period of three days or more. The longer and narrower the box, the more powerful the setup.
AAPL had been basing for 6 days between $84.75 and $88.00. Today it moved out of the R-zone and stair stepped towards the base at $88.00. I usually set an alert inside the base so that I know when to start focusing on the setup. If price moves sharply into the base, it needs to consolidate that move before breaking out, so patience is required to spot the correct entry. AAPL carved out an inside bar (NR7), green on green, which is my favorite for longs.
 FWLT had developed a box over the minimum three days. It moved sharply towards the base and retraced 50% allowing for a scaling in, ambush setup followed by additional size after it moved back into the base and printed a tight, narrow handle at $24.00 on the 1 minute chart. FWLT had developed a box over the minimum three days. It moved sharply towards the base and retraced 50% allowing for a scaling in, ambush setup followed by additional size after it moved back into the base and printed a tight, narrow handle at $24.00 on the 1 minute chart.
 Use Fibonacci as opposed to pivot levels to help plan the exit strategy. The pivot levels are usually tight after a stock has been in a narrow box over several days, so the R2/S2 levels are usually easily taken out. Use Fibonacci as opposed to pivot levels to help plan the exit strategy. The pivot levels are usually tight after a stock has been in a narrow box over several days, so the R2/S2 levels are usually easily taken out.
 CELG was a failed C&H pattern. I set my initial stop 2 pennies below the previous (outside) bar low. I eventually tightened the stop as depicted by the red line segment because the setup looked hopeless and I was stopped out. My initial stop would have been been taken out by 1 cent, followed by a reversal and full extension of the measured move of the pattern. Once a pattern fails, it's hard to get back in because you don't trust it anymore. CELG was a failed C&H pattern. I set my initial stop 2 pennies below the previous (outside) bar low. I eventually tightened the stop as depicted by the red line segment because the setup looked hopeless and I was stopped out. My initial stop would have been been taken out by 1 cent, followed by a reversal and full extension of the measured move of the pattern. Once a pattern fails, it's hard to get back in because you don't trust it anymore.
[url=][/url]
Posted by Jamie at 1/03/2009 12:17:00 AM 9 comments
Labels: Box_Play, Fibonacci, Inside Bars
Friday, December 26, 2008Scalping the Fives
Too many days off, and too much holiday spending, make me long for some good trading action. I followed the markets all morning without putting on a trade (a good holiday season mode = market observation until you are certain of a good setup). After lunch, I saw several setups sufficient for scalps on the 5 min charts.
Some key points to remember when scalping in lower volume conditions are: 1) Choose a good time-of-day (first hour and afternoon are best), 2) Know the local pivot points (sup/res levels) such as opening range high (ORH) and low (ORL), previous day high (PDH) and low (PDL), Fibonacci levels, etc., 3) Utilize traps or head fakes relative to these local pivot points, and 4) Watch for range contraction (foreshadows range expansion) in the setup.
Chart1: Following range contraction (denoted by converging trendlines), oil services (OIH) broke out and showed some afternoon strength.

Chart 2: Gold was weak in the AM and came roaring back (trap action). ABX consolidated below the ORL and then retook the ORL, ORH and PDH. The bull flag did lead to higher highs but the bulk of the move occurred before the flag.

Chart 3: Following some weakness at the open, SRS showed enough mid-day strength to set a decent trap. When price fell through the ORH (failure) in the afternoon, the next consolidation set the stage for a retest of the ORL.
 Happy Holidays! Happy Holidays!
[url=][/url]
Posted by Jim at 12/26/2008 04:45:00 PM 3 comments
Labels: Failure, Opening Range, ORH, ORL, Scalp
Friday, December 19, 2008Happy Holidays
Merry Christmas, Joyeux Noël, Feliz Navidad
Enjoy the holidays. See you back here in 2009
[url=][/url]
Posted by Jamie at 12/19/2008 11:34:00 PM 11 comments
Newer Posts Older Posts Home |
|
|
 [复制链接]


