- 金币:
-
- 奖励:
-
- 热心:
-
- 注册时间:
- 2006-7-3
|
|

楼主 |
发表于 2009-3-21 10:52
|
显示全部楼层
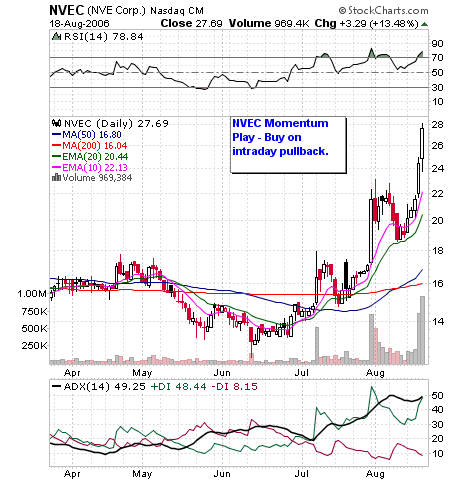
Sunday, August 20, 2006Watch List - AKAM, CMCSK, INFA, NVEC
NASDAQ Stocks trading above their 200 MA - well positioned to move higher.
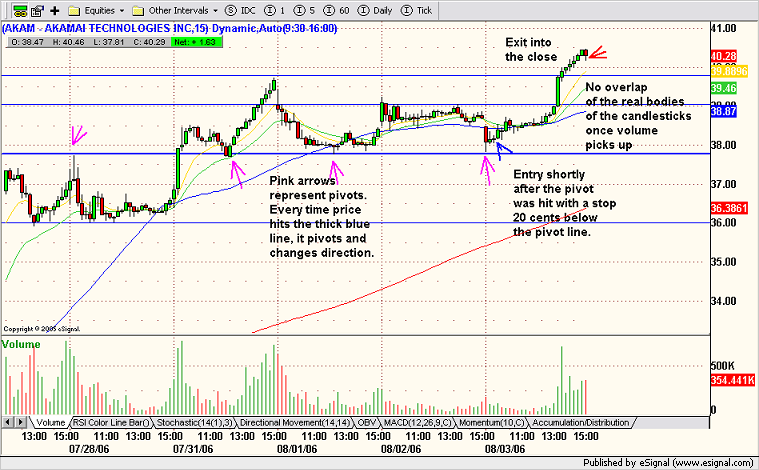
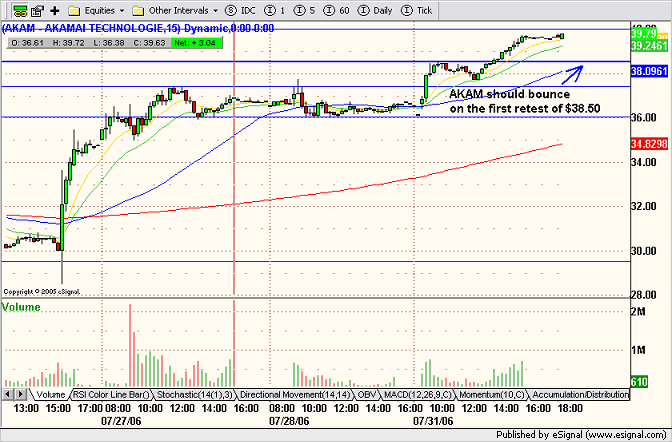
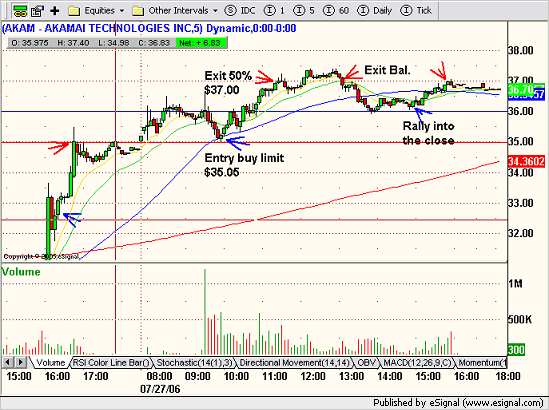
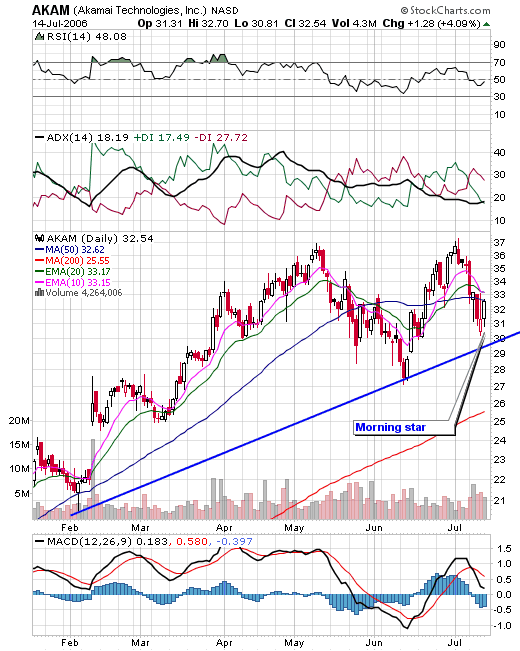
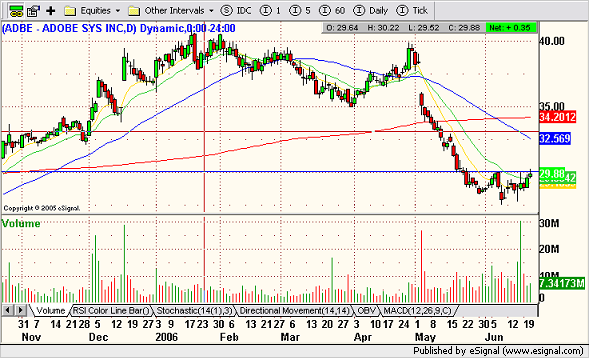
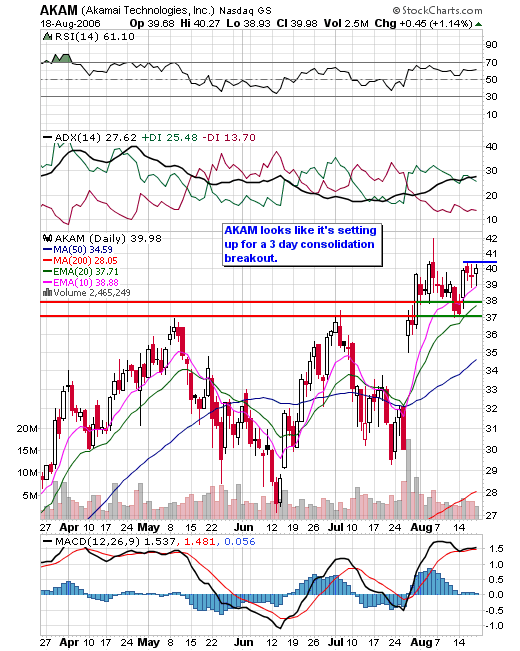
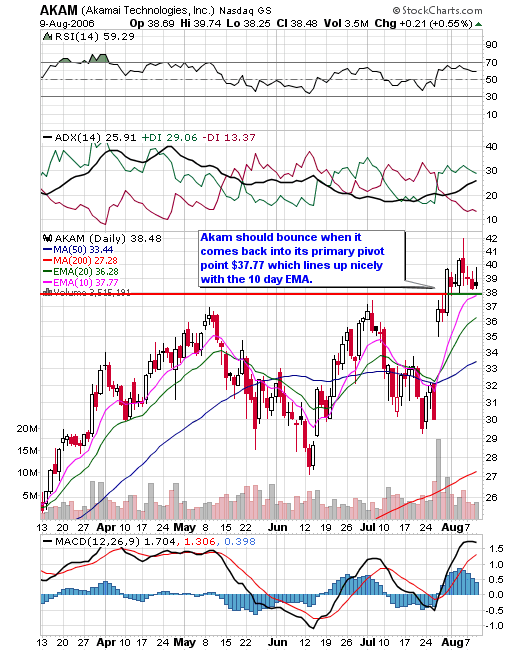
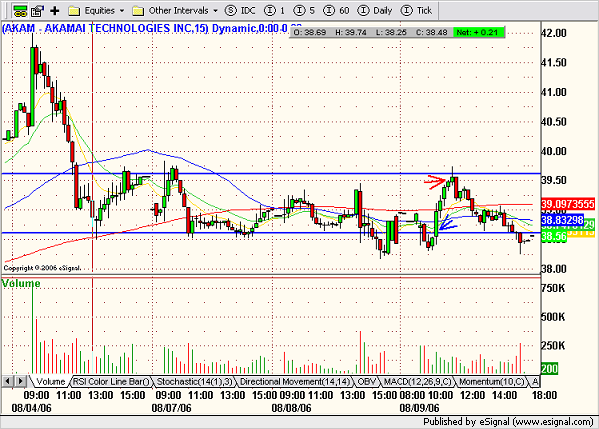
 After gapping up on earnings, AKAM has tested two levels of support and looks well positioned to begin the next leg up. After gapping up on earnings, AKAM has tested two levels of support and looks well positioned to begin the next leg up.
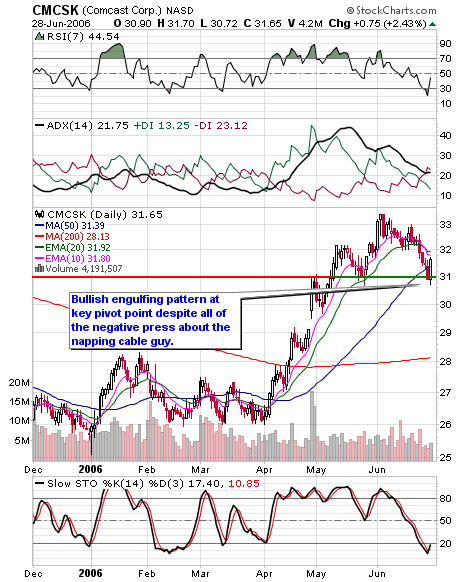
 CMCSK has been consolidating its gap up for most of the month of August. It looks like it could break higher any time soon. CMCSK has been consolidating its gap up for most of the month of August. It looks like it could break higher any time soon.
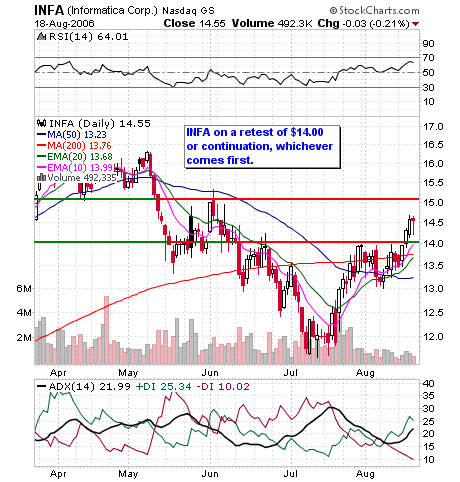
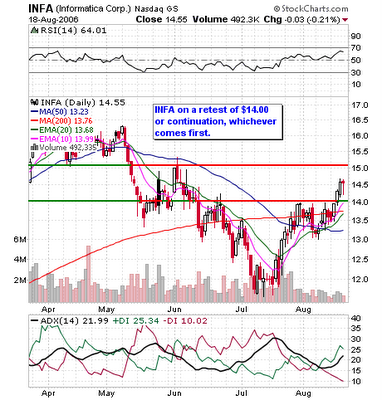 INFA would be nice on an intraday pullback to $14.00 but it may just push higher. INFA would be nice on an intraday pullback to $14.00 but it may just push higher.
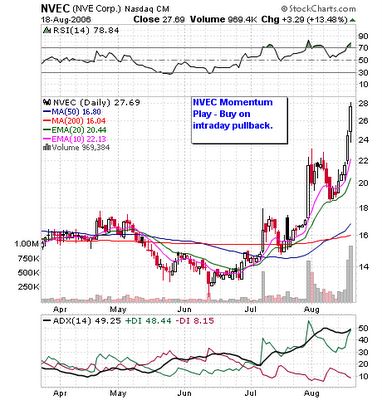 I caught a bit of the NVEC move Friday afternoon on an intraday scan. I'd like to see it pullback to $26.30 so I can get back in. This is a momentum play and should be good for more after some consolidation. I will be watching it closely going foward. I caught a bit of the NVEC move Friday afternoon on an intraday scan. I'd like to see it pullback to $26.30 so I can get back in. This is a momentum play and should be good for more after some consolidation. I will be watching it closely going foward.
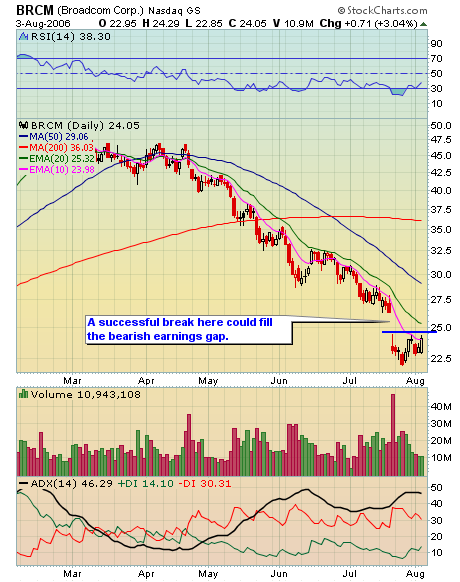
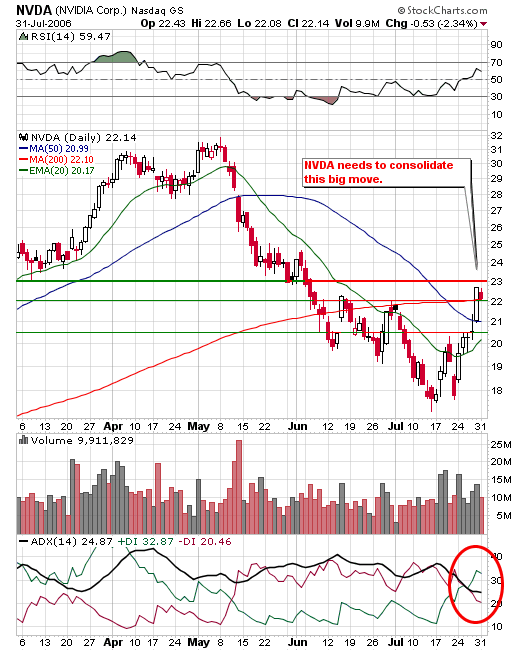
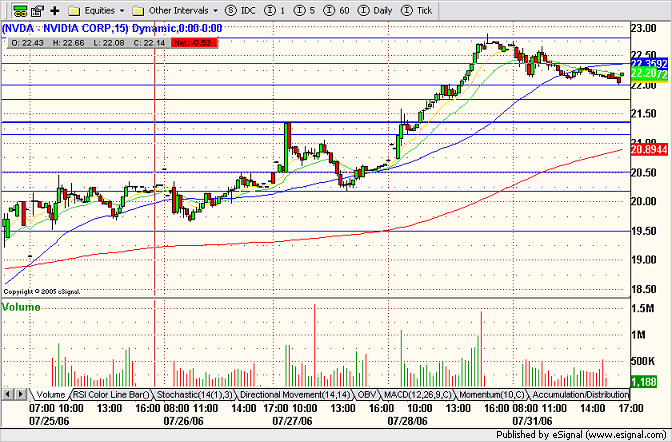
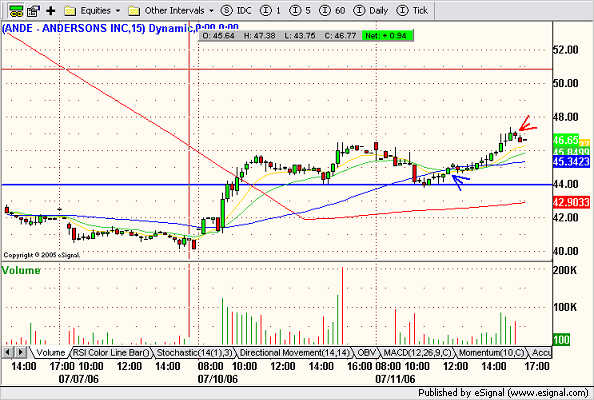
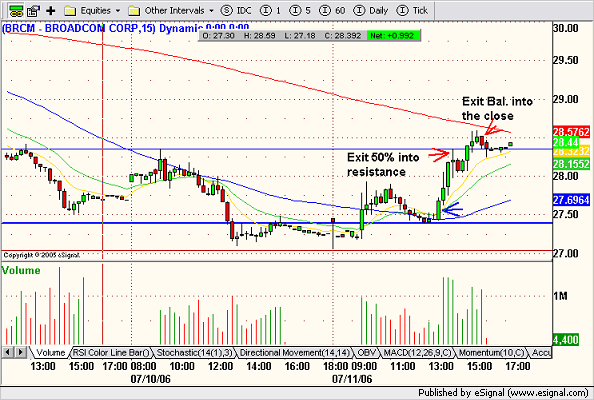
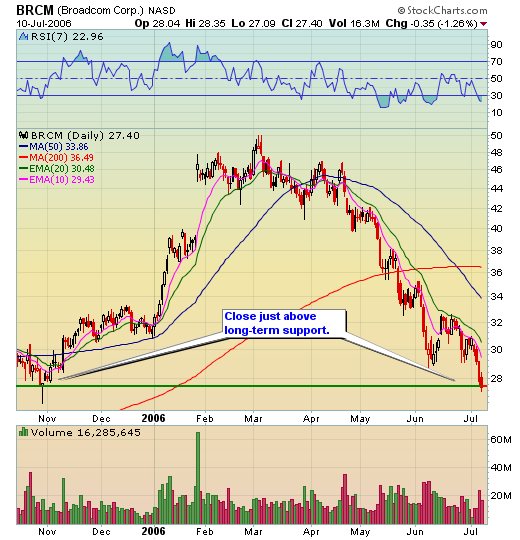
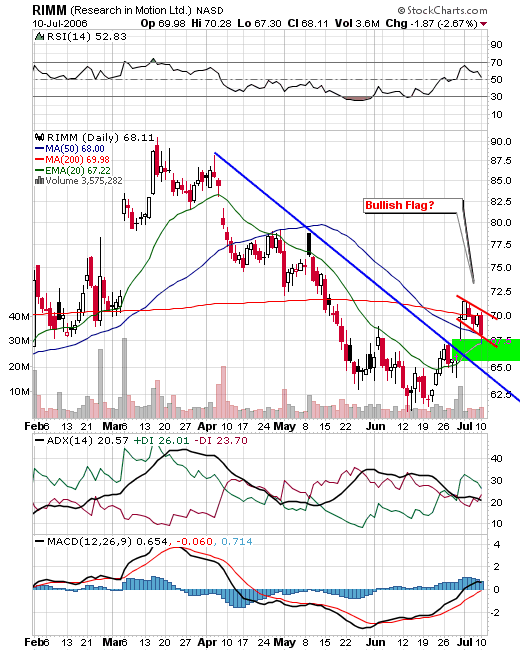
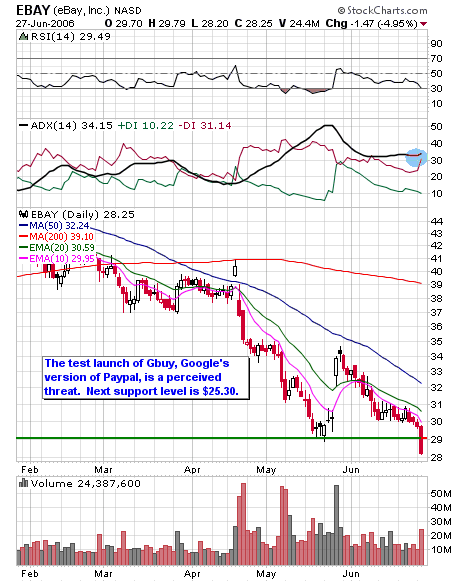
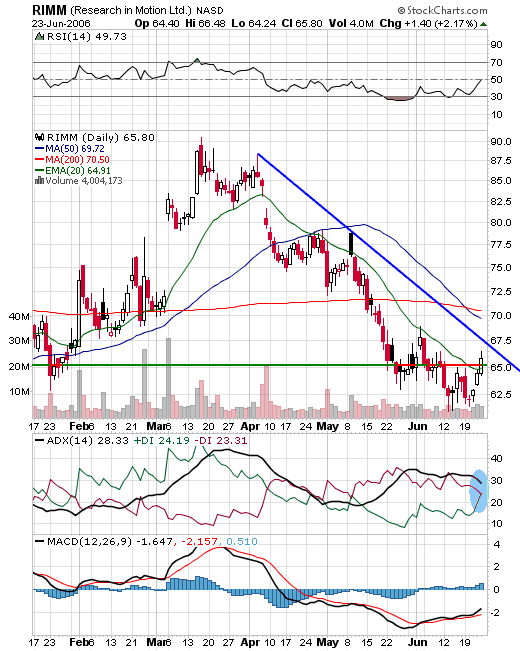
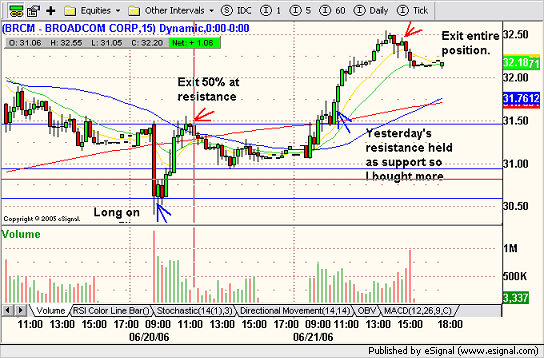
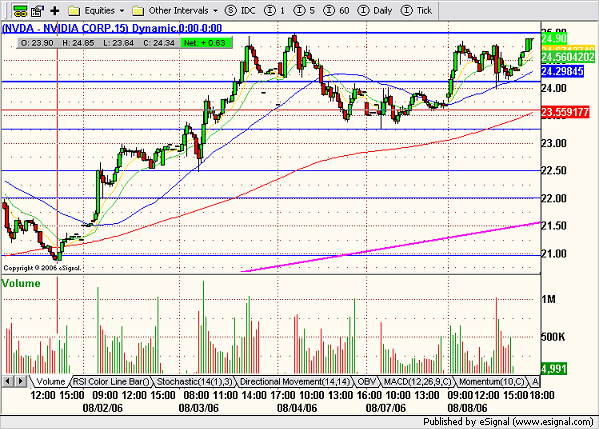
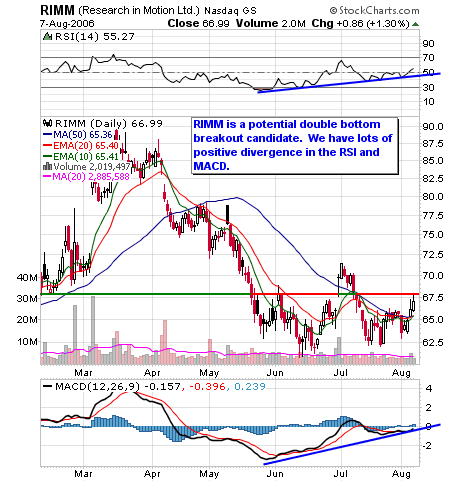
Other Bullish Watch List Stocks - RIMM, GENZ, NVDA. I'm also adding BRCM which, although not trading above its 200 MA, has made a nice rounded bottom and is consolidating recent gains.
[url=] [/url] [/url]
Posted by Jamie at 8/20/2006 09:49:00 PM 1 comments 
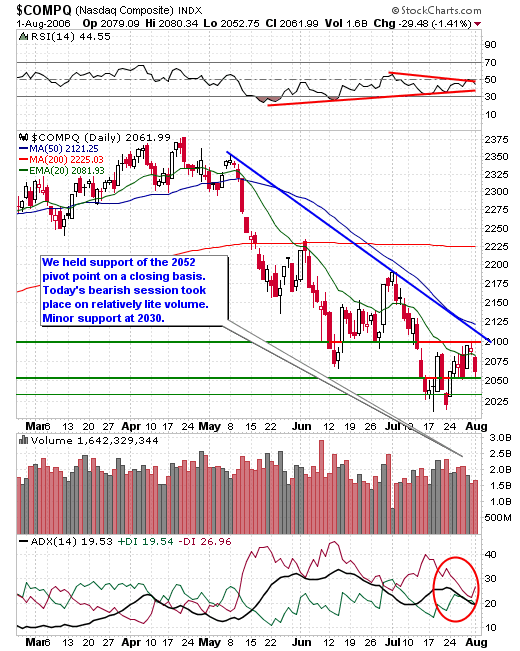
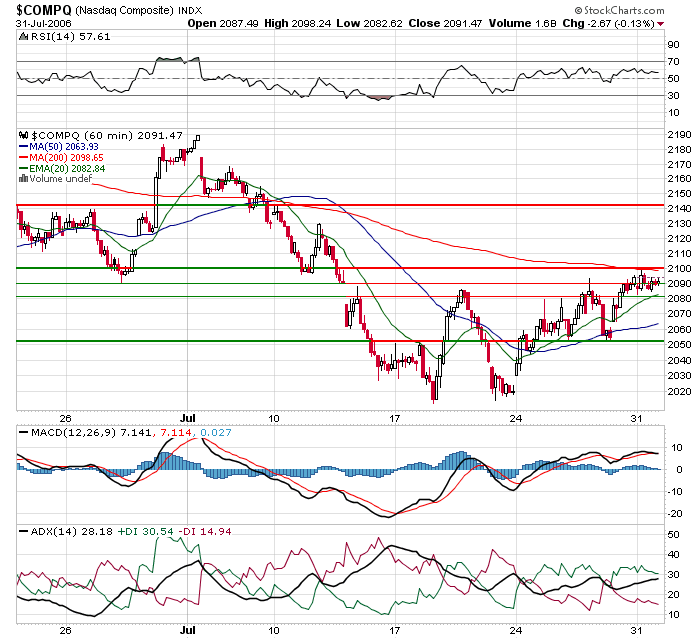
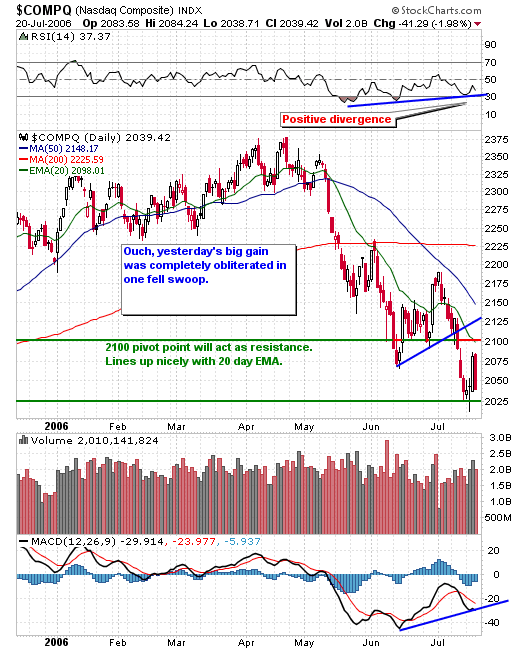
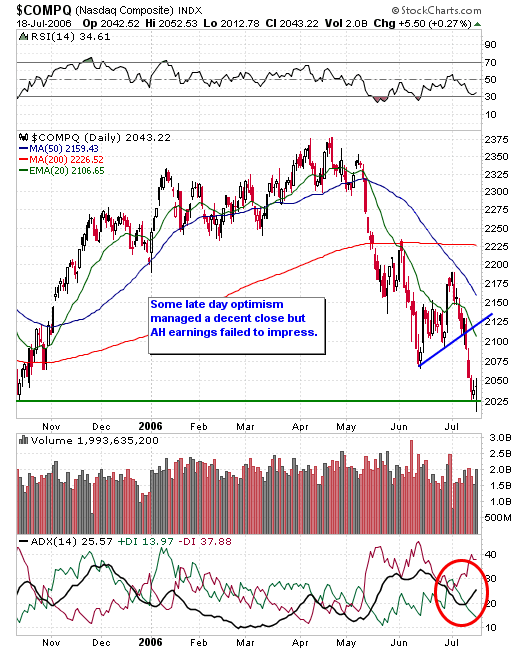
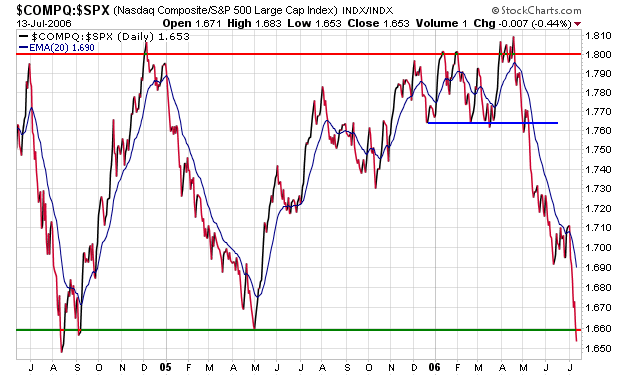
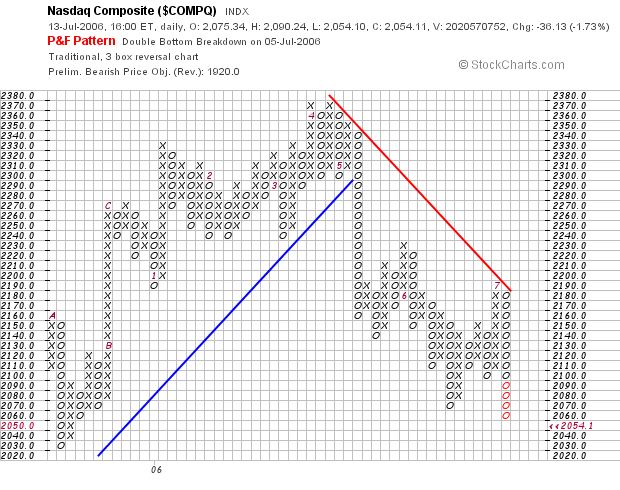
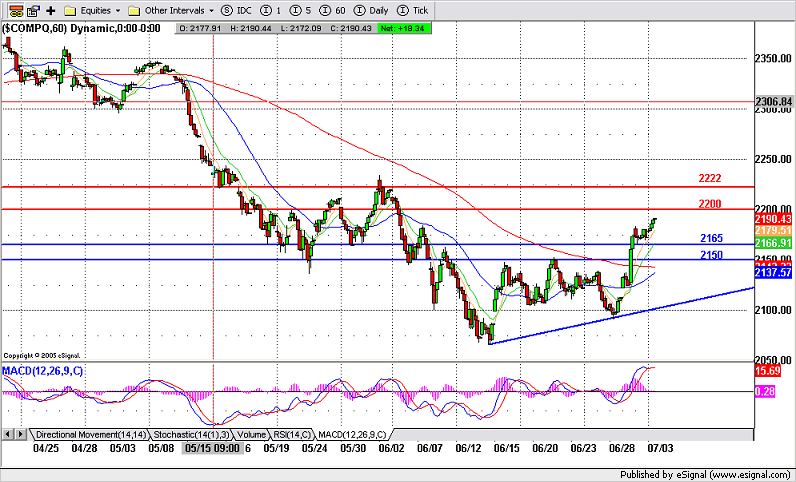
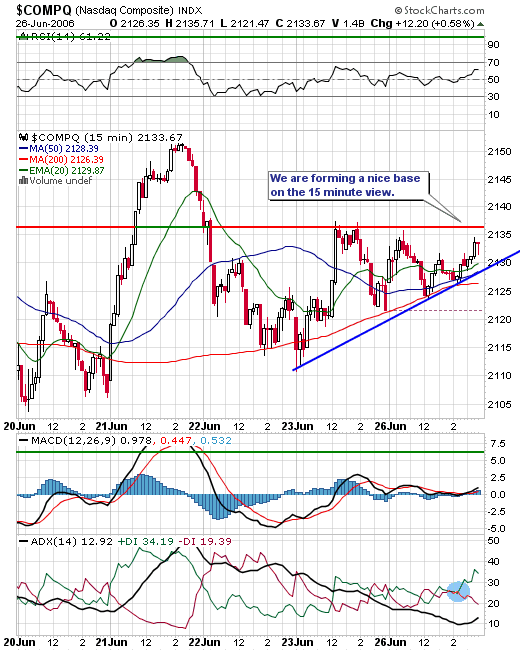
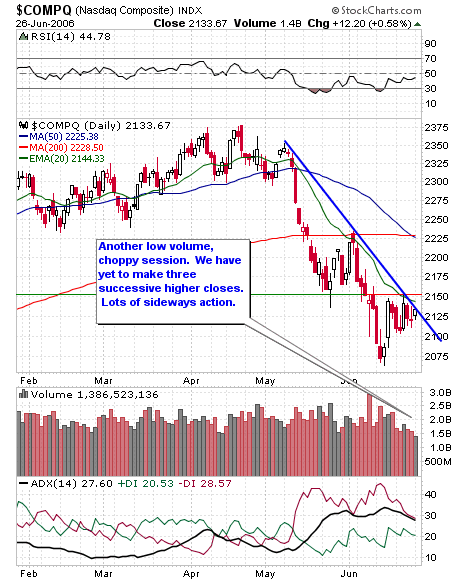
NASDAQ Technical Picture

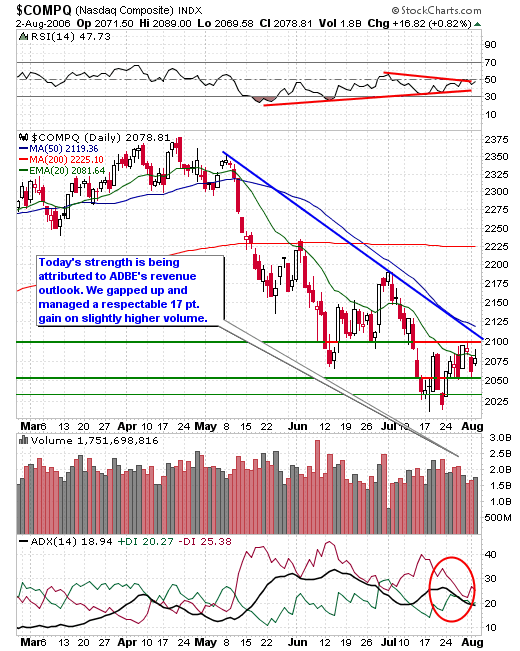
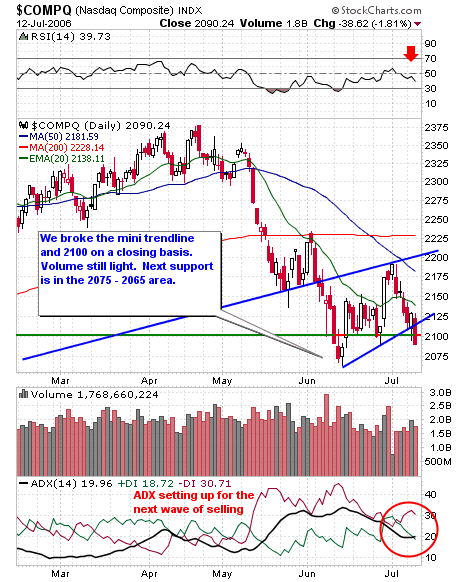
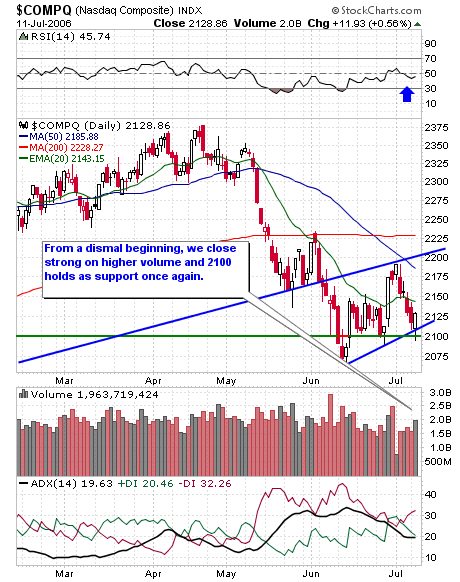
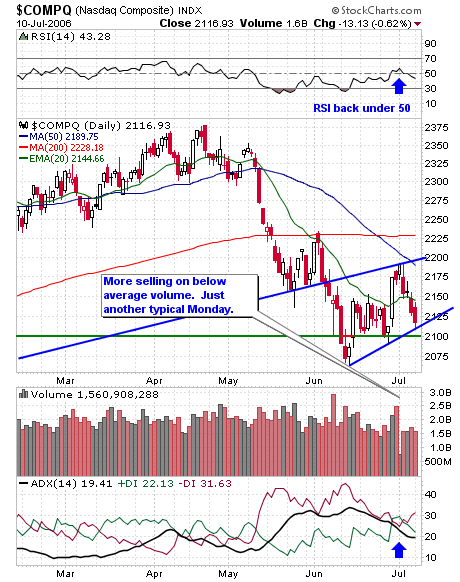
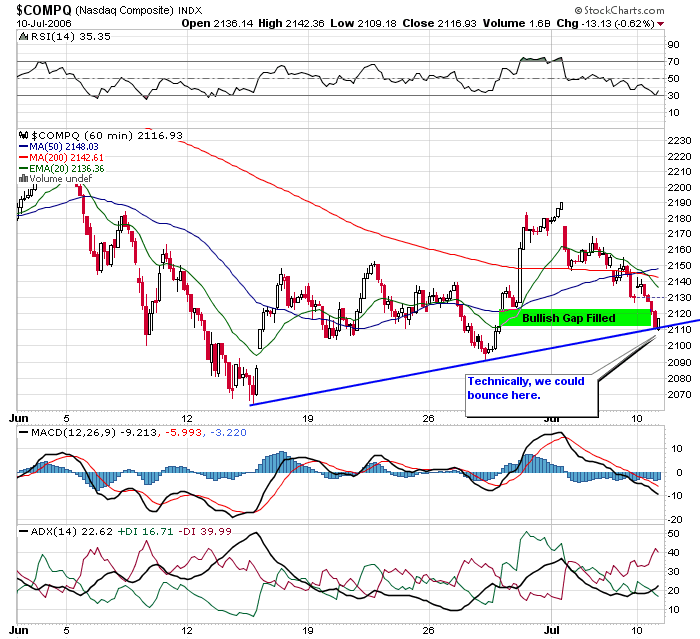
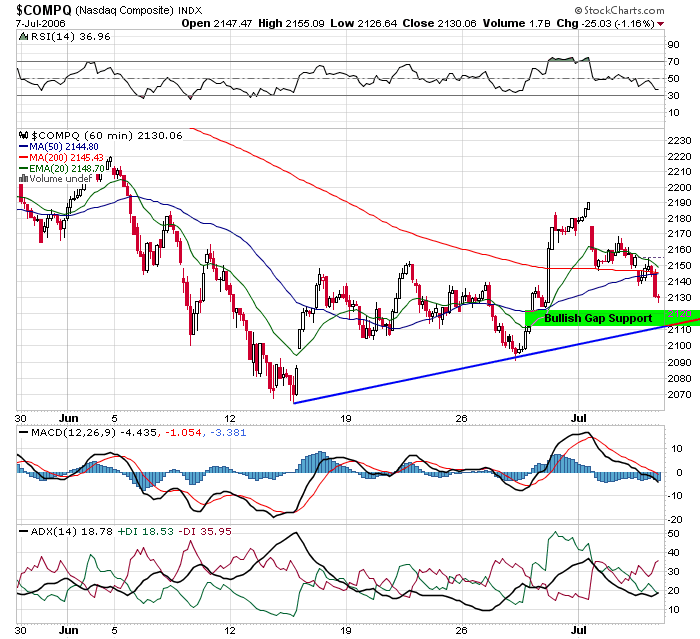
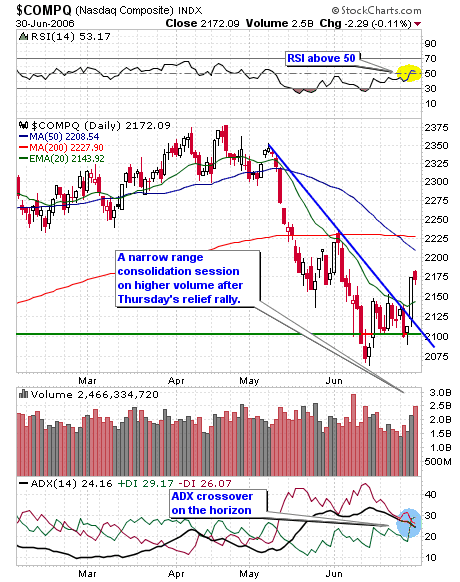
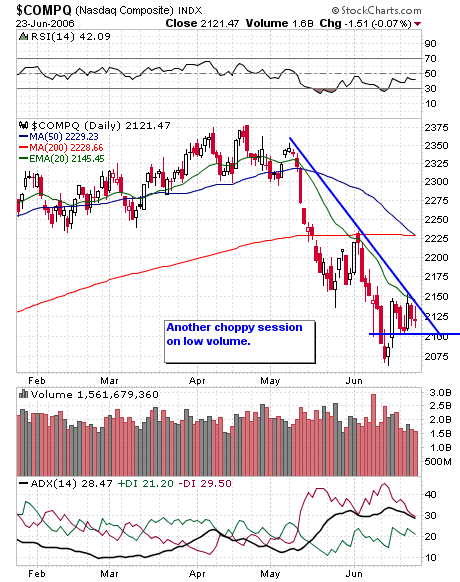
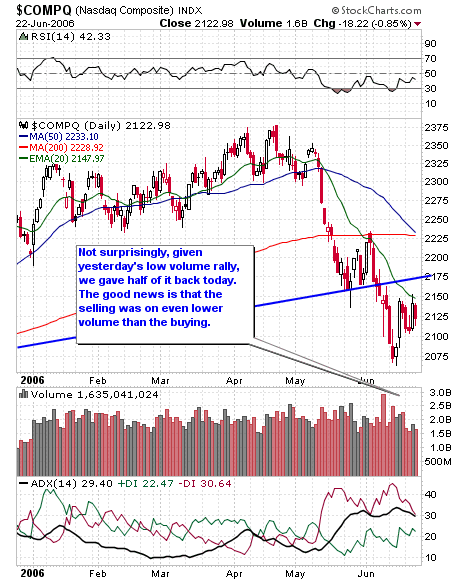
After opening weak on DELL's earnings, the NASDAQ managed to close higher than Thursday by 6 points. Notwithstanding the overall market strength in the face of bellwether weakness, Friday's options expiration session was a real snooze fest and most stocks on my watch list were not tradable.
If we can consolidate a bit more early in the week, that will leave the door open for further upside in the second half of the week (not a prediction, just wishful thinking).
[url=][/url]
Posted by Jamie at 8/20/2006 09:29:00 PM 0 comments
Thursday, August 17, 2006NASDAQ Technical Picture - Sweet, but let me catch my breath!
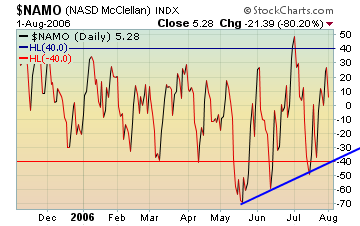
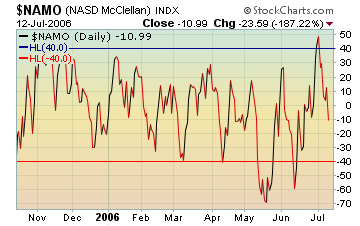
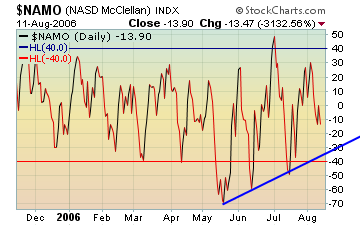
 The NASDAQ McClellan oscillator is signaling that we're overbought. Ya think? The NASDAQ McClellan oscillator is signaling that we're overbought. Ya think?
 I agree with Trader Mike, we need to consolidate these gains. Friday is options expiration, so unless I see something really compelling in the pre-market, I will probably not trade tomorrow. I agree with Trader Mike, we need to consolidate these gains. Friday is options expiration, so unless I see something really compelling in the pre-market, I will probably not trade tomorrow.
[url=][/url]
Posted by Jamie at 8/17/2006 09:27:00 PM 0 comments
Trade of the Day - Research In Motion NASDAQ (RIMM)
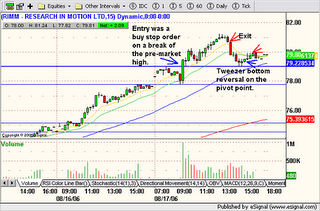
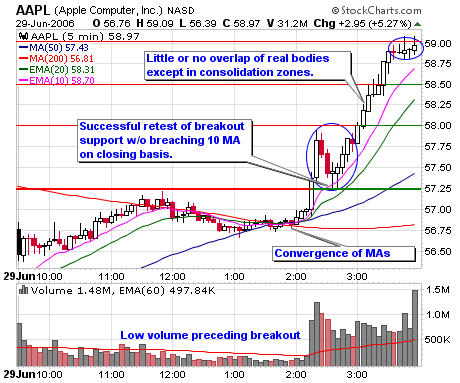
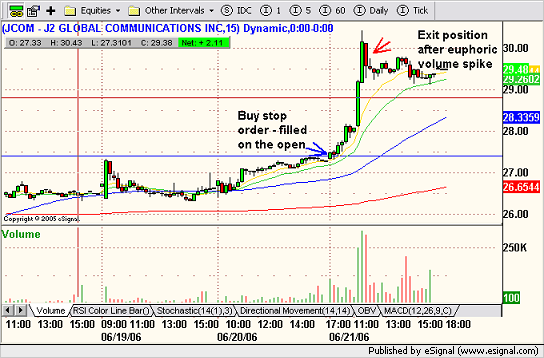
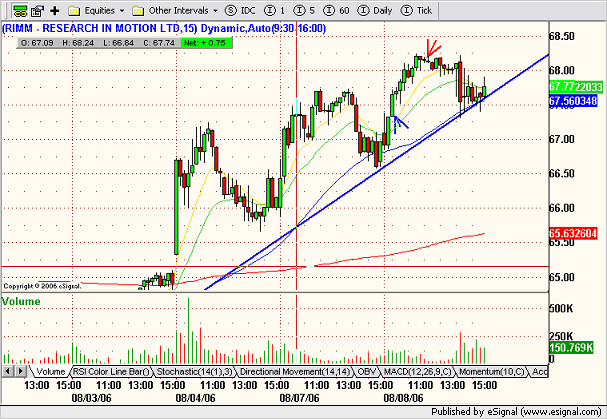
No, this is not a repeat of yesterday, although the entry is exactly the same. Long RIMM on a break of the pre-market high. Notice how the pre-market high was exactly $79.00 and then price came back in to fill the entire gap before the market opened. At 9:30 price took off on huge volume taking out $79.00 on the first wide range bar. The second bar (doji) observed $79.00 (pre-market resistance) as support. Shortly after 10:00, I moved my stop just 10 cents below break-even. This was a very orderly trade and easy to manage. Notice how there is hardly no overlap of the real bodies of the candlesticks as price moves up. Around 1:00, RIMM started consolidating and formed a small series of lower highs. This was a cue to tighten my stop to $80.70.
In the afternoon, price came back in to test the $79.00 pivot point. Notice how the low of both the 2:30 and the 2:45 candlestick is exactly $79.00. Steve Nison calls this a tweezer bottom candlestick reversal pattern. Although rare, I've found it to be very reliable. So, I went long as price took out the close of the second tweezer stick and exited the position at the end of the session.
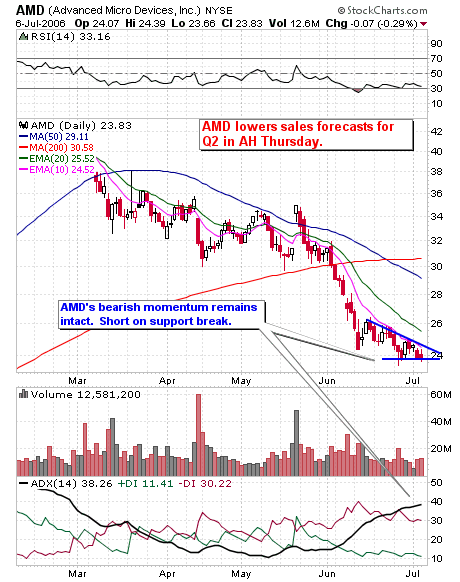
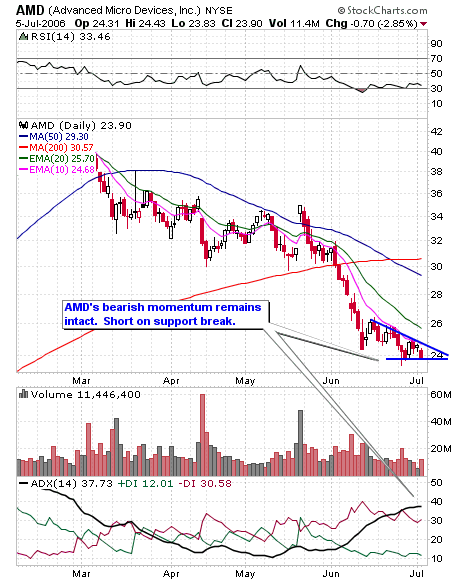
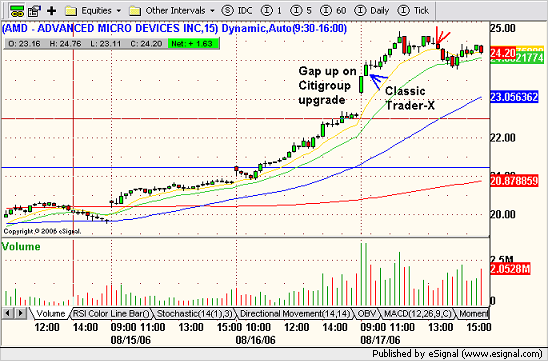
 AMD gapped up on a Citigroup upgrade. The first bar closed on its high and as soon as the second bar showed continuation, I went long. I took my exit shortly after AMD made a lower high. This is a classic Trader-X type trade. It was also orderly and easy to manage. AMD gapped up on a Citigroup upgrade. The first bar closed on its high and as soon as the second bar showed continuation, I went long. I took my exit shortly after AMD made a lower high. This is a classic Trader-X type trade. It was also orderly and easy to manage.
I also traded LLTC from last nights's watch list as soon as price took out yesterday's high. A little choppy but profitable just the same. However, the target was not reached. PAYX was invalidated on the open because it gapped down.
[url=][/url]
Posted by Jamie at 8/17/2006 07:13:00 PM 2 comments
Wednesday, August 16, 2006Watch List - LLTC, PAYX
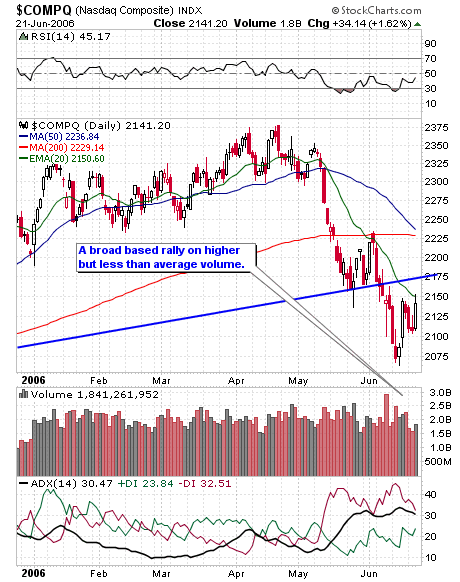
We've had three successive days of gains on the NASDAQ. From Friday's close to today's close we've racked up close to 100 points and we're running into resistance. Consequently, tomorrow will be cautious trading for me.
 Long PAYX if it opens at, or just above today's close. Support is $35.40 on the 15 minute timeframe. This is a continuation play out of a rounded base. The preliminary target is the 50 MA on the daily timeframe, followed by $37.00. Long PAYX if it opens at, or just above today's close. Support is $35.40 on the 15 minute timeframe. This is a continuation play out of a rounded base. The preliminary target is the 50 MA on the daily timeframe, followed by $37.00.
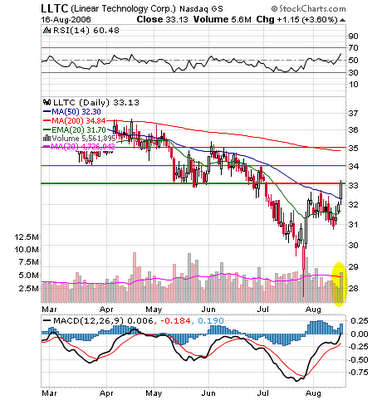 Similar setup with LLTC. Look for it to open at or just above today's close. Target is $34.00, followed by the 200 MA on the daily timeframe. Similar setup with LLTC. Look for it to open at or just above today's close. Target is $34.00, followed by the 200 MA on the daily timeframe.
[url=][/url]
Posted by Jamie at 8/16/2006 10:49:00 PM 3 comments
NASDAQ Technical Picture - Groundhog Day
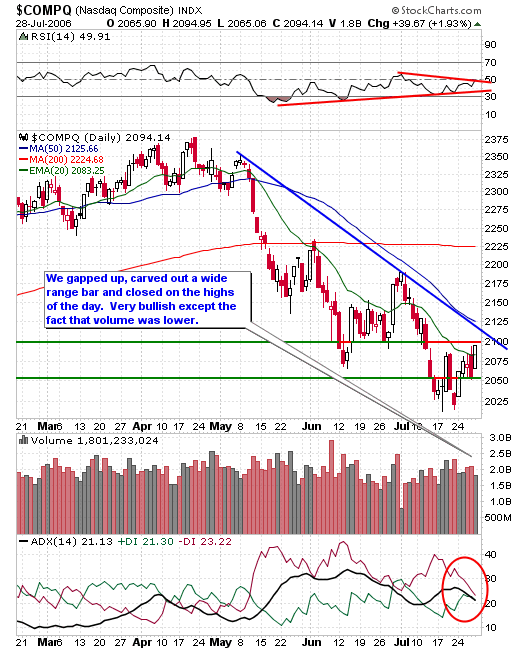
 Today was a repeat of yesterday. The NAZ gapped up, carved out a wide range bar, closed on its highs on higher volume. The SOX is pacing the way so it must be real. Watch pivot point resistance tomorrow. Today was a repeat of yesterday. The NAZ gapped up, carved out a wide range bar, closed on its highs on higher volume. The SOX is pacing the way so it must be real. Watch pivot point resistance tomorrow.
[url=][/url]
Posted by Jamie at 8/16/2006 08:10:00 PM 0 comments
Trade of the Day - Research in Motion NASDAQ (RIMM)
 As per last night's watch list, RIMM was setting up as a classic three day consolidation breakout after digesting last Thursday's bullish wide range bar. The criteria I look for in this type of setup is a narrow range consolidation in the upper price range of the preceding bullish bar on lower volume. I also look for the stock to close on its highs on the third or last day of the consolidation period. RIMM met all of my criteria. As per last night's watch list, RIMM was setting up as a classic three day consolidation breakout after digesting last Thursday's bullish wide range bar. The criteria I look for in this type of setup is a narrow range consolidation in the upper price range of the preceding bullish bar on lower volume. I also look for the stock to close on its highs on the third or last day of the consolidation period. RIMM met all of my criteria.
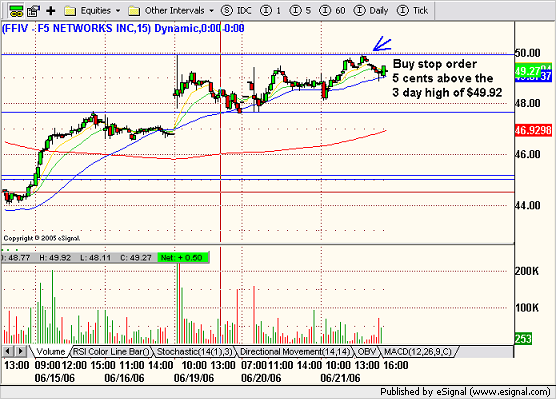
RIMM traded up in pre-market, but the gap was not excessive so I felt comfortable setting a buy stop order above the pre-market high. I booked 50% of my profit as price stalled at $77.00 and exited the balance into the close.
Other Watch List Stocks - ADSK was invalidated because the pre-market price was excessive. NDAQ did not trigger on the open as price retreated. KLAC gapped down, however I was able to initiate a long position in KLAC on the third 15 minute stick. My rationale was that although it opened lower, the first bars were bullish in that there was no overlap of the real bodies despite the long upper shadows. Price was now trading above yesterday's high, so when the third bar started trading above the second bar's close , I went long and held through to the end of the session.
[url=][/url]
Posted by Jamie at 8/16/2006 07:29:00 PM 2 comments
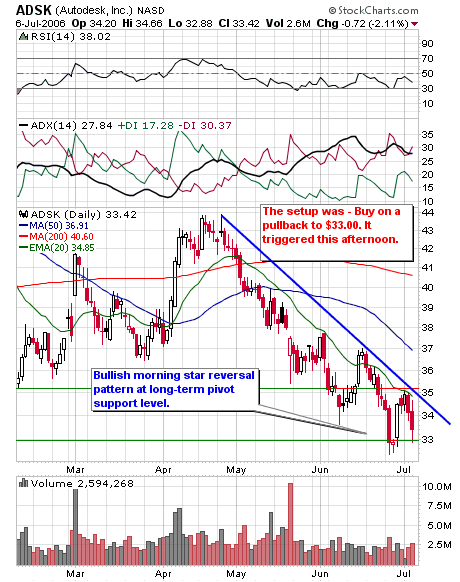
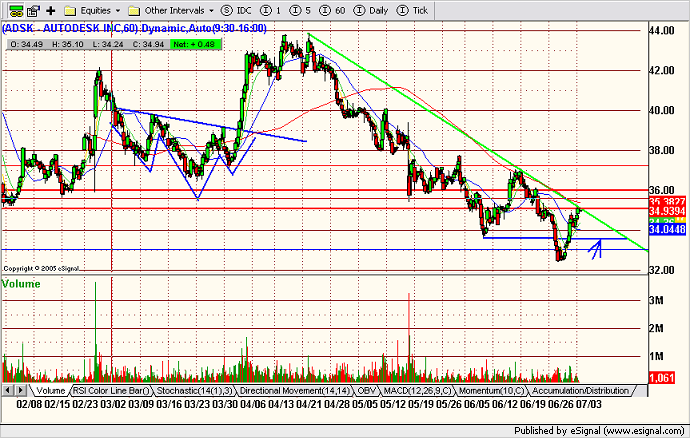
Pre-Market - ADSK Upgrade
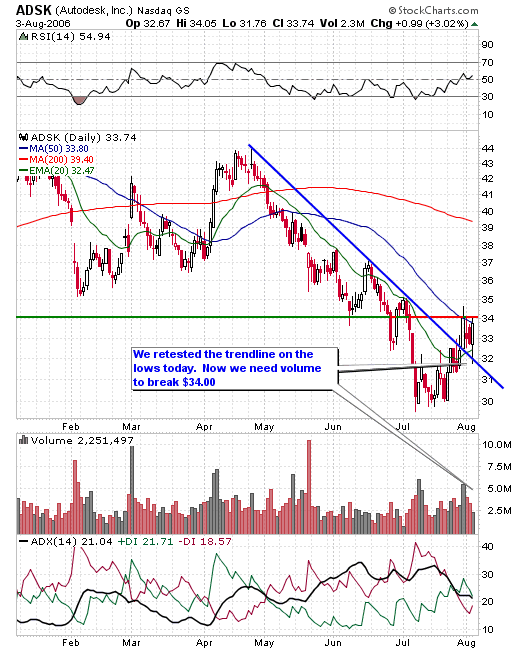
Jefferies upgrades Autodesk (ADSK 33.83) to Buy from Hold and $40 tgt from $34, as they think consensus estimates have limited downside and that shares have likely seen a valuation bottom
[url=][/url]
Posted by Jamie at 8/16/2006 07:25:00 AM 0 comments
Tuesday, August 15, 2006Watch List - Poised to Breakout - RIMM, NDAQ, KLAC, ADSK


 Click on charts to enlarge. Click on charts to enlarge.
[url=][/url]
Posted by Jamie at 8/15/2006 11:48:00 PM 0 comments
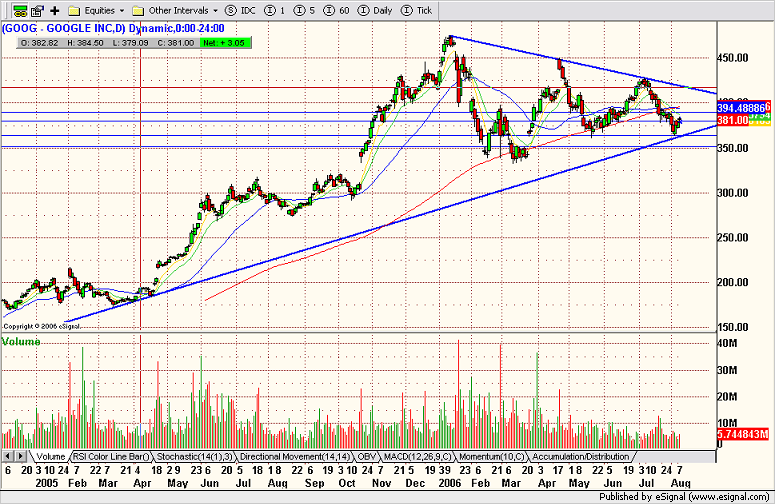
AKAM vs. GOOG


Interesting piece on a potential AKAM / GOOG clash at Seeking Alpha.
As a provider of content distribution to big media players, Akamai fits this vision well. They provide the technical infrastructure to ensure high-quality broadband video anywhere in the world, but they are transparent to the consumer. The content owners retain control of the presentation and monetization of the product.
We are still investors in Akamai, but it appears that one of our core reasons has now become invalid.
[url=][/url]
Posted by Jamie at 8/15/2006 11:12:00 PM 0 comments
Newer Posts Older Posts Home |
|
|
 [复制链接]


 Click on charts for larger views and chart notes.