搜索
楼主: hefeiddd

一个笨蛋的股指交易记录-------地狱级炒手

  [复制链接]
 楼主| 发表于 2009-5-2 17:38 | 显示全部楼层
Continental (CAL), mentioned countless times here, having completely a lovely head and shoulders retracement to the neckline.


Brazil iShares (EWZ):


Goldman "nut" Sachs (GS):


PSB, part of the commercial real estate crowd:
金币:
奖励:
热心:
注册时间:
2006-7-3

回复 使用道具 举报

 楼主| 发表于 2009-5-2 17:39 | 显示全部楼层
11111111111111

本帖子中包含更多资源

您需要 登录 才可以下载或查看,没有帐号?立即注册

x
金币:
奖励:
热心:
注册时间:
2006-7-3

回复 使用道具 举报

 楼主| 发表于 2009-5-2 17:40 | 显示全部楼层
PSB, part of the commercial real estate crowd:


Oh, speaking of Hillary......your video of the day. This is what all the fuss is about regarding the repurposed "1984" commercial. Hearing her nasal voice patronizingly talk about "conversation" this and "chat" that is truly nauseating. Anyhoo........enjoy:


What surprised me was the speed that the market has retraced virtually its entire drop from February 27th. You can see how quick the effect of the Fed's statement was today:


You would have though the Fed statement read, in its entirely, "The U.S. Government hereby guarantees a positive month-after-month return on U.S. equities in perpetuity." Instead, here it is:


The Federal Open Market Committee decided today to keep its target for the federal funds rate at 5-1/4 percent.

Recent indicators have been mixed and the adjustment in the housing sector is ongoing. Nevertheless, the economy seems likely to continue to expand at a moderate pace over coming quarters.

Recent readings on core inflation have been somewhat elevated. Although inflation pressures seem likely to moderate over time, the high level of resource utilization has the potential to sustain those pressures.

In these circumstances, the Committee's predominant policy concern remains the risk that inflation will fail to moderate as expected. Future policy adjustments will depend on the evolution of the outlook for both inflation and economic growth, as implied by incoming information.

Surprising that the above statement generated so much excitement. But here's where Tim the bear comes out: I was gobbling up puts left and right at the peak of the market today, because I feel 2/27 was the tip-off to a new kind of market, and everything we've seen since then has just been a retracement which will be obliterated in short order.

Just look at the $VIX. Every morsel of volatility from 2/27 forward has been destroyed. We're back to "the before time."


The key for the Dow 30 is the trendline I've drawn. I've circled the key break date.
金币:
奖励:
热心:
注册时间:
2006-7-3

回复 使用道具 举报

 楼主| 发表于 2009-5-2 17:42 | 显示全部楼层
111111111111111111111

本帖子中包含更多资源

您需要 登录 才可以下载或查看,没有帐号?立即注册

x
金币:
奖励:
热心:
注册时间:
2006-7-3

回复 使用道具 举报

 楼主| 发表于 2009-5-2 17:43 | 显示全部楼层
The key for the Dow 30 is the trendline I've drawn. I've circled the key break date.


The Russell 2000, being particularly strong of late, is just about to kiss the underbelly of its broken trendline. This, to me, is the ideal time to buy puts (or otherwise short the market). Because for all those that missed 2/27, here is your second chance.


Same story with the S&P 500.


I find the $XMI graph intriguing, although shorting this index isn't as easy. The full-blown bear play would be to short it here and watch it smash that horizontal line (which represented the former bullish break-out).


Don't get me wrong - - today sucked for the bears. But, as my earlier postings suggested, we had to suffer through this retracement. You can see from the comments section of yesterday's post how re-invigorated the bulls are now. Memories are very short, my friends!

at 3/21/2007 19 insightful comments
Links to this post


Newer Posts Older Posts Home
金币:
奖励:
热心:
注册时间:
2006-7-3

回复 使用道具 举报

 楼主| 发表于 2009-5-2 17:44 | 显示全部楼层
111111111111111

本帖子中包含更多资源

您需要 登录 才可以下载或查看,没有帐号?立即注册

x
金币:
奖励:
热心:
注册时间:
2006-7-3

回复 使用道具 举报

 楼主| 发表于 2009-5-2 17:46 | 显示全部楼层
Tuesday, March 20, 2007The Return of Sanguinity
First off, for those of you who can't quite get your fill of me in this blog (OK, that would be the empty set.....) there's a short published today you might find of interest.

It hasn't taken long at all for people to have utterly forgotten about February 27th. The $VIX has come full circle, sinking to levels not seen since the big break on that (not-so) fateful day. It seems the bulls are ready to party again. By the end of day tomorrow (post-Fed announcement), some of the smoke should clear a bit.


Index after index shows the same thing - - that we are at the upper levels of the trading range established after the 2/27 break. As I said yesterday, if we push above this trading range, the bulls are going to feel rightfully emboldened.


The $RUT has been especially strong of late.


Take a closer look at the $RUT and see how nicely it is bound by two Fibonacci retracement levels.
金币:
奖励:
热心:
注册时间:
2006-7-3

回复 使用道具 举报

 楼主| 发表于 2009-5-2 17:48 | 显示全部楼层
1111111111111111

本帖子中包含更多资源

您需要 登录 才可以下载或查看,没有帐号?立即注册

x
金币:
奖励:
热心:
注册时间:
2006-7-3

回复 使用道具 举报

 楼主| 发表于 2009-5-2 17:49 | 显示全部楼层


Take a closer look at the $RUT and see how nicely it is bound by two Fibonacci retracement levels.


Same story with the S&P 500.


A closer look at the S&P 500.......with a different, tighter set of retracement levels...shows again we're at the highest reaches of the recovery since 2/27.


Research in Motion (RIMM) inched down a bit more today, which is good. Also of note is Continental Airlines (CAL), shown here, which has done a perfect retracement to its neckline (and, interestingly, its trendline). A break down and away from this neckline would neatly complete the pattern.


That's all I've got for today. If we don't see weakness tomorrow, it's going to only amplify the discouragement, disappointment, and frustration of the bears who had thought their fortunes had finally turned with the recent market break.
at 3/20/2007 26 insightful comments
Links to this post
Labels: $indu, $rut, $spx, $vix, cal

[ 本帖最后由 hefeiddd 于 2009-5-2 17:51 编辑 ]
金币:
奖励:
热心:
注册时间:
2006-7-3

回复 使用道具 举报

 楼主| 发表于 2009-5-2 17:50 | 显示全部楼层
111111111111111

本帖子中包含更多资源

您需要 登录 才可以下载或查看,没有帐号?立即注册

x
金币:
奖励:
热心:
注册时间:
2006-7-3

回复 使用道具 举报

 楼主| 发表于 2009-5-2 17:55 | 显示全部楼层
Monday, March 19, 2007Contratrend Rally
Today was a pretty bad day for the bears. I woke up to find myself stopped out of my S&P and Russell index puts. I only got stopped out of a few equity/other put positions, but suffice it to say it was pretty much red across the board for me today.

I don't comment much on the FX markets, but I just wanted to share a chart of the USD/CAD ratio. To me it looks like the multi-year slide of the USD/CAD may be behind us. The succession of lower lows and lower highs seems to have changed to higher highs and higher lows. I've tried to make this clear with the circles and arrows.


Speaking of FX, one item I follow fairly closely is the New Zealand dollar. The NZD/USD pair gave me a clear signal before the February 27th selloff. NZD has been rather strong lately, but I think it may have exhausted its ability to climb back up. A resumption of the sinking of this FX would be very positive for equity bears like myself.


Is there a VIX on the VIX? If there is, it must be going crazy. Just look at how volatile this thing has been, swooping between 14 and 20 like mad. Today's very strong market took a lot of steam out of the VIX.


The principle risk the bears are facing right now is if the markets show much more strength, they are going to push into a relatively "all clear" zone where the bulls and frolic for a few weeks. I've tinted this in green.
金币:
奖励:
热心:
注册时间:
2006-7-3

回复 使用道具 举报

 楼主| 发表于 2009-5-2 17:56 | 显示全部楼层
11111111111111111111111111

本帖子中包含更多资源

您需要 登录 才可以下载或查看,没有帐号?立即注册

x
金币:
奖励:
热心:
注册时间:
2006-7-3

回复 使用道具 举报

 楼主| 发表于 2009-5-2 17:57 | 显示全部楼层
The principle risk the bears are facing right now is if the markets show much more strength, they are going to push into a relatively "all clear" zone where the bulls and frolic for a few weeks. I've tinted this in green.


The NASDAQ is even a prettier picture for the bulls, since it seems a short term double bottom may have been hammered out, and there's plenty of open sky above current levels.


The Russell 2000 - which is a favorite of mine since the bid/ask is relatively reasonable on the puts - has been strong compared to the more narrow indexes. A tight stop on this would be $789.88 with a somewhat fatter stop being 797.45.


Same story with the S&P 500. We've been in a trading range for the past couple of weeks, and things will look bad for us bears if we break above it.
金币:
奖励:
热心:
注册时间:
2006-7-3

回复 使用道具 举报

 楼主| 发表于 2009-5-2 18:00 | 显示全部楼层
11111111111111111

本帖子中包含更多资源

您需要 登录 才可以下载或查看,没有帐号?立即注册

x
金币:
奖励:
热心:
注册时间:
2006-7-3

回复 使用道具 举报

 楼主| 发表于 2009-5-2 18:01 | 显示全部楼层
Same story with the S&P 500. We've been in a trading range for the past couple of weeks, and things will look bad for us bears if we break above it.


Although people may think the sub-prime story may be fully told, I'm not so sure. I bought puts on AHM today. To me, this looks like the beginning of a much larger fall. What's freaky about these puts is that I actually picked up the June $35 puts for less than the April $35 puts were priced. Bizarre.


RIMM was about the only bright spot for me today. For RIMM to fall in a market this strong is encouraging. Breaking below $131.18 is key.


And now your occasional video clip. One of the most unlikely scenes from "The Facts of Life" known to man. Beyond the pale. Enjoy.


at 3/19/2007 6 insightful comments
Links to this post
Labels: ahm, goog, rimm
金币:
奖励:
热心:
注册时间:
2006-7-3

回复 使用道具 举报

 楼主| 发表于 2009-5-2 18:03 | 显示全部楼层
111111111111111111

本帖子中包含更多资源

您需要 登录 才可以下载或查看,没有帐号?立即注册

x
金币:
奖励:
热心:
注册时间:
2006-7-3

回复 使用道具 举报

 楼主| 发表于 2009-5-2 18:04 | 显示全部楼层
Friday, March 16, 2007So Short, I Could Jump Off a Nickel
One of the readers of this blog commented last night: "If we have a down 3rd Friday, It’ll be the first one I’ve seen, in (well, in a second, as far back as….wait, I think I found it, … no wait, that’s not it, well.. Records don’t go back far enough." Well, we were down today 50 points on the Dow. Another good week!

Here's a daily graph of the S&P 500. I've put three moving averages on this index graph - a 50 day, a 100 day, and a 200 day. The big drop on February 27th sliced through the 50 day and the 100 day. The recover from that fall kissed the underside of the 100 day. And now it's falling again, pulling both the 50 and the 100 into a downward slope.


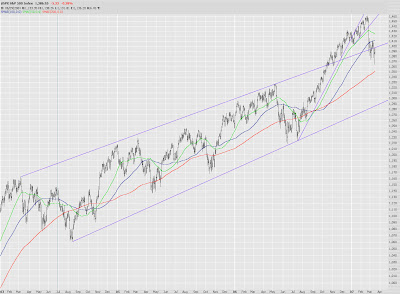
Here's something more remarkable to me. See that huge upward-sloping channel? Now take a close look at the upper line of that channel. Keep in mind I drew that channel a while ago. Take a look at what happened today on a minute-by-minute basis:


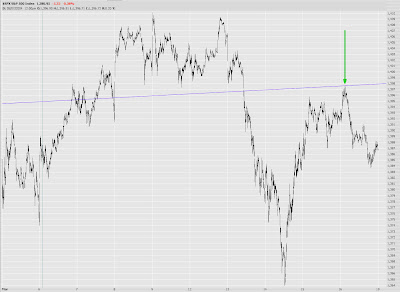
Do you see what I'm talking about? The arrow marks the place where the index bounced off the trendline virtually to the penny. Astonishing! Once again, this isn't a trendline I drew today. I drew it a long time ago. But now that we're back within the channel, the price is obeying this level splendidly.

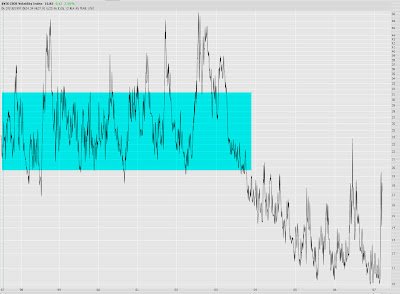
A lot of people, myself including, have become hung up on the fact that the $VIX has become so "high" in a very short amount of time. Going from the single digits to 16 is a big move, to be sure. But step back and look at the $VIX over the past decade. The norm was for it to bounce between about 20 and 30, with occasional bursts above and (less frequently) below these levels. So a level of about 16 is actually way under the norm still.


Looking at the NASDAQ Composite, if there is any regularity to the broad action of the market, it seems we're still in the same sine-wave type pattern with plenty of room left to the downside.
金币:
奖励:
热心:
注册时间:
2006-7-3

回复 使用道具 举报

 楼主| 发表于 2009-5-2 18:05 | 显示全部楼层
1111111111111

本帖子中包含更多资源

您需要 登录 才可以下载或查看,没有帐号?立即注册

x
金币:
奖励:
热心:
注册时间:
2006-7-3

回复 使用道具 举报

 楼主| 发表于 2009-5-2 18:06 | 显示全部楼层
Looking at the NASDAQ Composite, if there is any regularity to the broad action of the market, it seems we're still in the same sine-wave type pattern with plenty of room left to the downside.


The Dow 30 did a gorgeous bounce off the underside of the 100 day moving average. It seems to me the next target is to take out that red 200 day moving average.


Regular readers know of my fondness of the Russell 2000, particularly since the put options have a much more reasonable bid/ask spread than the S&P 500. A tight stop on this would be about $785.


The Major Market ($XMI) is another interesting graph. We've come full circle on the breakout. The downward momentum of this market doesn't seem like a fluke anymore. It feels truly bearish.
金币:
奖励:
热心:
注册时间:
2006-7-3

回复 使用道具 举报

 楼主| 发表于 2009-5-2 18:07 | 显示全部楼层
1111111111111111111

本帖子中包含更多资源

您需要 登录 才可以下载或查看,没有帐号?立即注册

x
金币:
奖励:
热心:
注册时间:
2006-7-3

回复 使用道具 举报

您需要登录后才可以回帖 登录 | 立即注册

本版积分规则

本站声明:MACD仅提供交流平台,请交流人员遵守法律法规。
值班电话:18209240771   微信:35550268

举报|意见反馈|手机版|MACD俱乐部

GMT+8, 2025-8-4 11:15 , Processed in 0.044638 second(s), 9 queries , MemCached On.

Powered by Discuz! X3.4

© 2001-2017 Comsenz Inc.

快速回复 返回顶部 返回列表