- 金币:
-
- 奖励:
-
- 热心:
-
- 注册时间:
- 2006-7-3
|
|

楼主 |
发表于 2009-5-2 17:27
|
显示全部楼层
Friday, March 23, 2007Grind It Out, Part Deux
Photocopy yesterday's entry and make it today's. Not satisfied with that? Sigh. I feel a sense of duty to put up a post for today, in spite of little new to say.
Here, I've got a chart to show you. Something to get us away from the tick-by-tick obsession of this market (which, granted, sucked for bears - every single day this week was positive for the Dow).
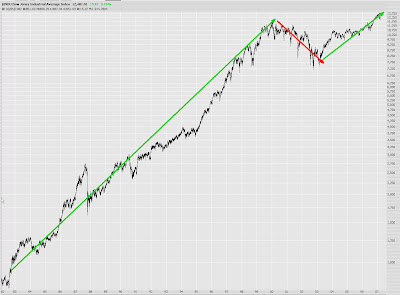
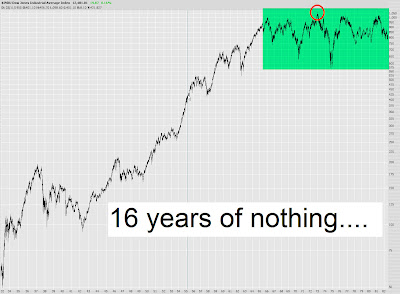
This graph shows a huge, secular bull market followed by a bear market, and then a push to new highs. Let's call it Graph #1.

The next graph is very similar. Again, a huge bull market........then a bear market .....and then a push to new highs. We'll call this Graph #2.
What is interesting to me is this......what happened to Graph #1 in the years that followed? This is shown below. Year after year of a market that ground away, going nowhere. Actually, if you take inflation into account, it could be argued this was a sixteen-year long bear market. Suffice it to say equities wasn't a good place to be.
My theory is that Graph #2 - which spans from the early 1980s right up to the present day - could be a repeat of the same behavior. That is, yes, we've made new highs, but we're in the midst of a very long "grind it out" market which, in retrospect, will be a debacle for the market in general. |
|
|
 [复制链接]


