- 金币:
-
- 奖励:
-
- 热心:
-
- 注册时间:
- 2006-7-3
|
|

楼主 |
发表于 2009-5-1 08:30
|
显示全部楼层
Saturday, April 14, 2007I, For One, Welcome Our New Bull Overlords.....
Thanks for coming back this weekend (or Monday......) to see my post. I had to do some thinking, charting, and scanning to reassess the market.
Oh, before I begin, a shameless plug: for those who have been holding off buying Chart Your Way to Profits, check You'll be able to get some third-party opinions from those who have actually read it. The one negative review was from someone who didn't realize the book was largely about ProphetCharts and JavaCharts. So, consider yourself warned.
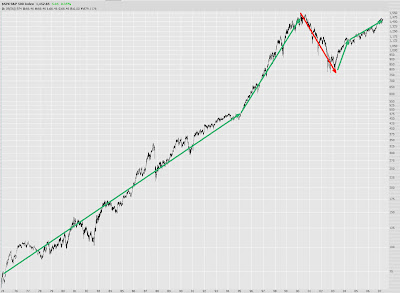
I really tried to look at the whole market with a very open mind, because the strength of the bulls since July has been frustrating, confusing, and vexxing. I keep coming back to the graph below, which shows the S&P 500 over the long haul. I simply cannot see that we are set up for a bullish surge. I don't want to hear about liquidity, the global economy, or the trillion dollar oil surplus seeking a home. This blog is about charts, and the charts, to me, don't say "buy."
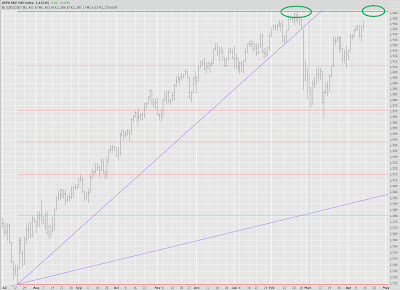
Looking at a short-term S&P chart, we can see that we're getting dangerously close to the high set back in February. It isn't the all-time high (set early in 2000), but it's getting close to that as well. The big question now is, does the market (a) sink from here (b) push up to a double top and then sink (c) blow past the February high and make an assault on the all-time high from the bubble.
To me, an important indicator to watch is the NZD/USD market. The New Zealand kiwi has been extraordinarily strong. The weakness in late February was a good early indicator of the tumble the markets took. But, since then, this currency has basically been going straight up.
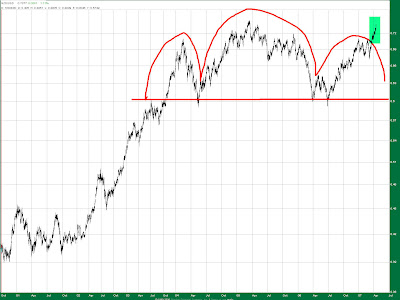
Another item I watch is China - one shorthand way to do it is via GCH (Greater China Fund). One interesting tidbit is that it seems to have retraced up to a retracement level. We'll see if it backs away or not. |
|
|
 [复制链接]