- 金币:
-
- 奖励:
-
- 热心:
-
- 注册时间:
- 2006-7-3
|
|

楼主 |
发表于 2009-5-1 07:16
|
显示全部楼层
Monday, April 23, 2007Finally!
At long last, the Dow did not go up today. A one-day respite, at least, from the torture!
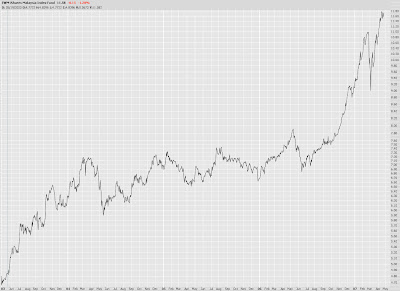
All eyes have been on Asia, particularly since the 2/27 blowout. People are wondering when the mania is going to end. God only knows, and He ain't telling. Here's a graph of Malaysia. I mean, these aren't magical fairylands, people. Have you been to Malaysia? I have. I think it's a hole, myself. But then again, I'm an Ugly American.
Even though we haven't crossed the fabled 13,000 mark on the Dow, the press is already impatiently looking for the next big milestone. ''We could be looking at 14,000 by the end of the year,'' said Robert Froehlich, chief investment strategist for DWS Scudder. Yeah, fine. Whatever.
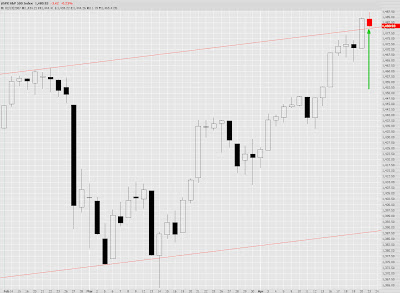
Anyway, the S&P had a touch of weakness today, but notice how it stayed perfectly above its former resistance level. In other words, now that line represents support.
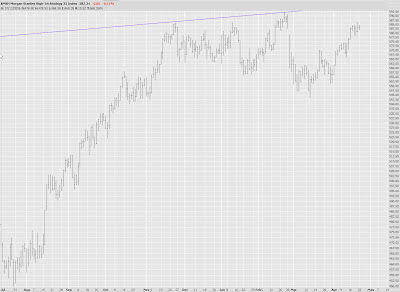
The Morgan Stanley Tech Index looks like it could fall badly, but unfortunately, the spread between the bid/ask on these options is wider than Rosie O'Donnell's underwear. (I wonder to myself just how long people will pause before clicking that link.)
A couple of cautionary tales for you. First - - - American Airlines (AMR) appears to be a lovely head and shoulders pattern. |
|
|
 [复制链接]


