- 金币:
-
- 奖励:
-
- 热心:
-
- 注册时间:
- 2006-7-3
|
|

楼主 |
发表于 2009-4-30 15:37
|
显示全部楼层
Monday, April 30, 2007Here's Your Pickle Surprise, Pal....
One of the readers of this blog posted a link to an interesting article called that you might find of interest. Here is an excerpt:
"As Grantham points out, a bubble needs two things: excellent fundamentals and easy money. 'The mechanism is surprisingly simple,' he wrote. 'Perfect conditions create very strong 'animal spirits,' reflected statistically in a low risk premium. Widely available cheap credit offers investors the opportunity to act on their optimism.'
"And it becomes self-sustaining. 'The more leverage you take, the better you do; the better you do, the more leverage you take. A critical part of a bubble is the reinforcement you get for your very optimistic view from those around you.'"
"My colleagues suggest that this global bubble has not yet had this phase and perhaps they are right. ... In which case, pessimists or conservatives will take considerably more pain."
So - encouraging in a way, although discouraging in another. I strongly believe, as readers of this blog know by now, that we are in the midst of the hugest Ponzi scheme in human history, and one day it's going to completely collapse. The question is whether that "day" is tomorrow or five years from now. One thing in certain - between now and then, the bulls will persist in posting their taunts here. Although at least to a lesser degree, now that the shield of anonymity has been taken away.
One other article of interest is , emailed to me by another thoughtful reader.
Today is the best day I've seen in a long time for my portfolio. I sometimes wonder on days like this is our national nightmare is finally over. One day does not a trend make (or break), so that remains to be seen. All the same, as you can see from this chart of the $INDU, the big boys gave up some ground, and the cyclic indicators are looking mighty encouraging.
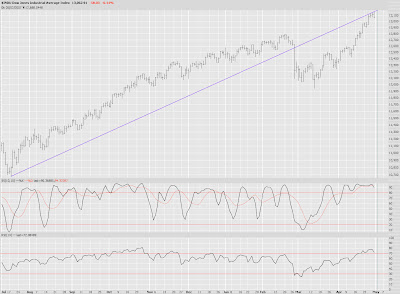
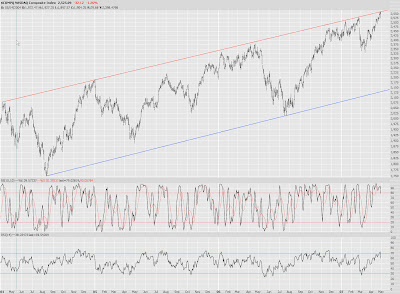
The NASDAQ Composite, which has been weaker than the Dow, also fell. The key difference is that it was down pretty much all day, whereas the Dow sported a 40+ point gain at one point in the day before shriveling away.
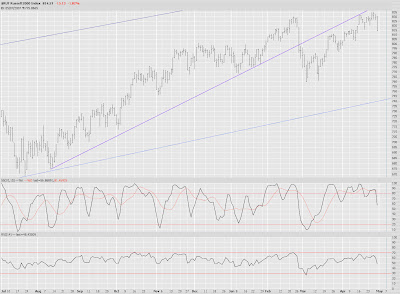
My favorite index, the Russell 2000, fell the hardest. I like what I see here.
The S&P 500 remains above its former resistance, but any further drop will pierce that line and put us back into that gigantic upward-sloping channel. |
|
|
 [复制链接]