- 金币:
-
- 奖励:
-
- 热心:
-
- 注册时间:
- 2006-7-3
|
|

楼主 |
发表于 2009-4-28 08:08
|
显示全部楼层
Tuesday, June 26, 2007When It Seems Easy, Feel Queasy...
I began this blog over two years ago, and I think that it has made me a better trader. Having to step up to the podium each day and offer up opinions (which are subject to scrutiny, disparagement, and future review) makes me think long and hard about the market. And the occasional public floggings I have received have imbued with me a healthy dose of humility that I think is essential to profitable trading.
Trading profitably has become far too easy recently for my liking. If bearish trades start becoming like shooting fish in a barrel, I know it's time to take profits. There have been times in the past.......and this is very common among traders.... when easy profits encourage more trading. And the tide starts to turn against you. So you pile on more. And the losses start to pile on. And, before you know it, all your fantastic profits from the last downturn are M.I.A. I really don't want to go through that again.
So as the trading day ended, I was kicking myself for having such a substantial position of puts on the Russell 2000 in place. There are some areas in my life where "irresponsibly large" is welcome, but options positions is not one of them. Let's just say I hope I don't wake up to a huge gap-up in the indexes. It could happen.
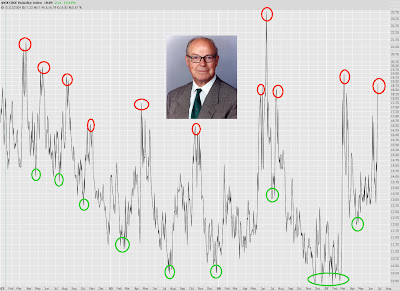
The basis for my nervousness.......besides my own angst........is the $VIX. Just take a look as this multi-year graph. For ease of viewing, I have circled peaks and troughs. We have certainly had $VIX levels higher than the present one, but let's face it, this is pretty peak-y. As I said: I'm nervous.
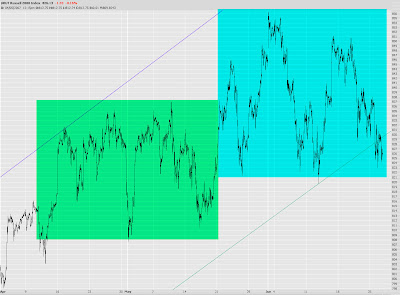
The Russell 2000 is below its supporting trendline, but this trendline isn't horribly significant. In other words, I don't put a heck of a lot of weight into the fact that it is broken. I'm glad it's broken, to be sure, but there's still a fair amount of support at these price levels.
One way to look at the market is that, for the past month or so, we've been caught in a trading range, and we are at the bottom of that range now. I've highlighted the range area on the S&P 500 daily graph here. I do not think we would break into new highs from here, but we might wind up with a triple top or at least partially retrace our way back up near the former highs.
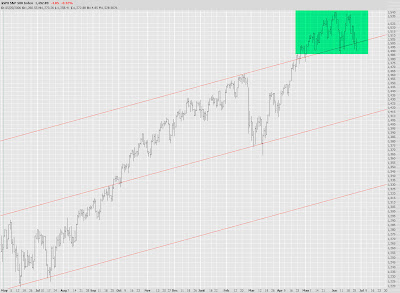
One could look at the market another way........it is pretty easy to lay out a massive rounding top. Just look at the intraday chart of the S&P 500, where I've embellished it with probably one of the worst arcs drawn in human history. (I am not much of an artist). |
|
|
 [复制链接]


