- 金币:
-
- 奖励:
-
- 热心:
-
- 注册时间:
- 2006-7-3
|
|

楼主 |
发表于 2009-4-12 07:09
|
显示全部楼层
Sep 24, 2008 6:20am
| | 
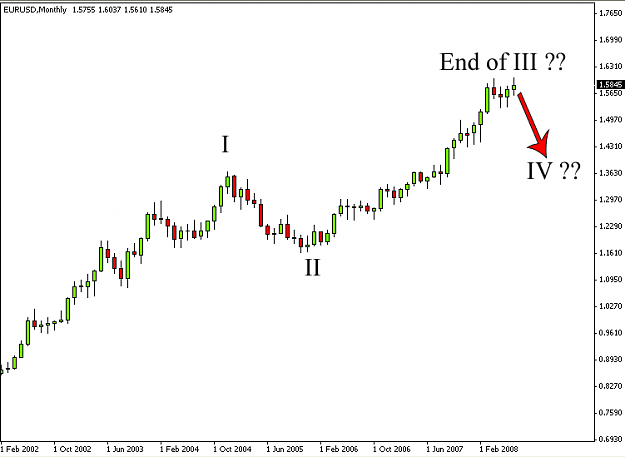
Cable chart.
Red color label is my alternative count..
Attached Thumbnails
|
#439
 Sep 24, 2008 8:08pm Sep 24, 2008 8:08pm
| | Go easy on me
I got something right here 
or
Should we expect wave 5 or 3 in the coming months?
Quote:
Originally Posted by NuckingFuts 
As you can see I am definitely not an Elliot Waver.
Wishful thinking EW experts?

|
|
#440
Sep 24, 2008 9:07pm
| | EUR Elliot
Quote:
Originally Posted by NuckingFuts
I got something right here
Should we expect wave 5 or 3 in the coming months?
|
Looks like you got it. Nice to start on the monthly to get your bearings and foundation correct, otherwise it get harder in smaller time frames.
Both charts are good. I support your first chart, and am looking for wave 5 up, if 4 is done.
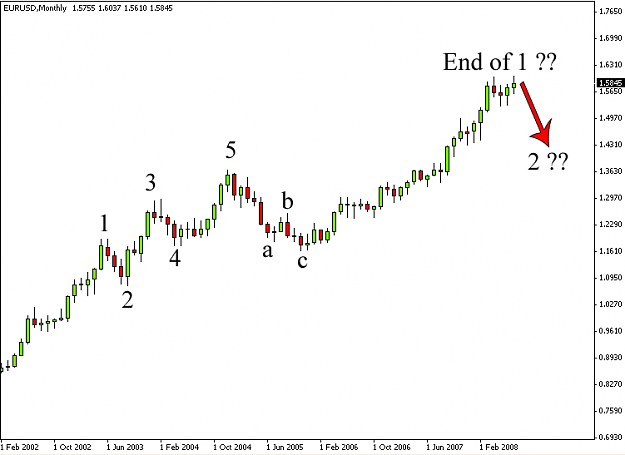
My reasoning is that chart 2 loses the count by getting the "degree" mixed up.
The second chart is accurate if 5 is the end of larger degree 1.
And C is the end of larger degree 2. IMHO.
It is like a computer code, where subsets are nested. With just one nesting, it is easy to follow, but when you have 10 nestings, then you have to punctuate your code to avoid an unclosed bracket. i.e. the last </ >
<A>
. . .<a>
. . .</a>
</A>
There are guidelines for degree, and structure in Elliott, which help in learning. Old timers can look at any chart and count waves, including some subsets like an extension (a wave inside a wave - typical in a 3rd wave for forex).
Hope that helps a bit. Keep posting your charts! 
__________________
- FXoffshore
"Expect the best - prepare for the worst" Trade Charts and commentary: http://vault.bz
|
#441
Sep 24, 2008 9:18pm
| |
Quote:
Originally Posted by FXoffshore
Looks like you got it. Nice to start on the monthly to get your bearings and foundation correct, otherwise it get harder in smaller time frames.
I support your first chart, and am looking for wave 5 up, if 4 is done.
My reasoning is that chart 2 loses the count by getting the "degree" mixed up.
It is like a computer code, where subsets are nested. With just one nesting, it is easy to follow, but when you have 10 nestings, then you have to punctuate your code to avoid an unclosed bracket.
<A>
<a>
</a>
</A>
There are guidelines for degree, and structure in Elliott, which help in learning. Old timers can look at any chart and count waves, including some subsets like an extension (a wave inside a wave - typical in a 3rd wave for forex).
Hope that helps a bit. Keep posting your charts!
|
Thanks FXoffshore, sure does help.
My only concern with EW is exactly where to start the count. I will be looking right into this when I can as I find it quite similar to the electrical impulses of the human heart beat (QRS complex etc..). At least the concept anyway.
There has to be a pulse in the market, it's driven by many of them
|
#442
Sep 24, 2008 9:23pm
| |  EUR Crossroad EUR Crossroad
Quote:
Originally Posted by doji
Guys, has Wave-C ended on the EUR/USD pair?
It looks to me like it's still completing Wave 4, and is, therefore due for another wave up ?
Am I wrong?
Thanks!
|
Great question. We at the crossroads now.
With the past 2 week rally still in 3 waves, it could be either: - A-B-C as part of intermediate w.4 of large w.C (or)
- 1-2-3 as part of large w.5
I got out at 1.4800 with 670pips to see what direction the market would take. I lean toward we are in a 4, looking for 5 to break higher soon/tonight? Reason, all the impulses waves up, not all zig-zags?
But I'll wait for the market to lead.
Personally, I am looking at support to hold at 1.4570 if it gets that low, or a break above 1.4750 range.
__________________
- FXoffshore
"Expect the best - prepare for the worst" Trade Charts and commentary: http://vault.bz
|
#443
Sep 24, 2008 9:29pm
| | Heart Impulse Waves
Quote:
Originally Posted by NuckingFuts
I will be looking right into this when I can as I find it quite similar to the electrical impulses of the human heart beat (QRS complex etc..). At least the concept anyway.
There has to be a pulse in the market, it's driven by many of them
|
Yes, good impulse wave remind me of a heart beat shape. Our designer shows clues that math and fractals are in all His creations.
I would love to hear what you find on heart impulses - summary or article links? Please let us know.... 
__________________
- FXoffshore
"Expect the best - prepare for the worst" Trade Charts and commentary: http://vault.bz
|
#444
Sep 24, 2008 10:09pm
| | Not really
There are turning points at times, this is one of them for me. Another trader could say I'm long until 1.5500. My style is conservative because I trade a large capital base, my priority is preservation of capital, profits come second.
Generally, when I see 5 waves one way, then a 3 correction, I am in, and make out well. I can see that in any time frame, in most securities.
I can trade a naked chart by price action alone. Or candles, or S&R. Been there and done that. I was trading 30 years ago, kid.
I would be glad to answer your questions, and can be patient, but I deserve respect - don't be rude to me.
__________________
- FXoffshore
"Expect the best - prepare for the worst" Trade Charts and commentary: http://vault.bz
|
#445
Sep 24, 2008 10:17pm
| | 
Quote:
Originally Posted by steelhead
Perfect post on why this indicator cannot be trusted. Could be a-b-c as part of itermediate wave 4? or 123 as part of wave 5? Come on this is hilarious.
Again this is why you cant trust it. Could be this or could be that. Ten different traders will give you ten different scenarios about elliot waves.
|
Dear Sir,
Would you please correction of the CHF chart I try learned of this wave method.. looks like good for take the short if the support break .
Please advise the point C am i right to draw base on this wave method
best regards,
my30marahaba 
Attached Images
|
#446
Sep 25, 2008 2:27am
| |  How to start a count How to start a count
Quote:
Originally Posted by NuckingFuts
Thanks FXoffshore, sure does help. My only concern with EW is exactly where to start the count.
|
That is a good question, it is the kernel of Elliott skills. It depends on the trader, so others may do it a different way. By all means speak up, anyone.
In summary, I look for certain distinguishing or unique patterns, in tight bar view, never candles. Sometimes line view removes noise. - a vertical move is often a wave 3, sometimes w.1 starts like a rocket
- a contracting triangle is typical of a wave 4 or B (never a w.2)
- a sharp 3 wave retracement is a typical w.2
- a meandering retracement may be a w.4
a significant bottom or top is tricky because it is not always the extreme tick, like in the case of a truncated w.5 - so avoid starting there.
I start by looking on weekly or daily charts, then progress to smaller time frames to get it right. I look for those vertical or triangle patterns to anchor my count. then start counting 3s or 5s, applying labeling after some prep has been done.
When it comes to labeling, I don't begin there, it is the last thing I do. Also, I consider alternative counts, so I can eliminate them or prioritize them as the market moves. 'ALT' counts are risk management for me, plan B and C are on the table, but the preferred count is the one that satisfies the most rules/guidelines. The temptation is to favor a count that supports a traders presupposed bias, guard against that. Be open to all counts that are valid, but experience will teach which ones are likely. If a rule is violated, let the count go - don't ignore the solid violation.
I compare intra-market charts as well, other currencies, like Swissy is great for Eur to confirm a count. Gbp/Usd is good also. Gold and Oil have been highly correlated with EUR, and make advance moves that help.
Often I will confirm a count using a MACD like oscillator that ebbs and flows over a 0 line. Wave threes have the biggest hump, w.4 crosses the naught line, and w.5 almost always shows divergence.
Another standard is to put every trend into equal channels. After a while you get to know the personality of patterns and where they will go within the channel. As soon as 1 and 2 appear to be done, I'll put a channel on it as a guide where 3 will touch, 4 will retrace, and 5 will finish. 2 and 4 are your base line, or 0 and B in a correction. Very powerful and reliable tool.
My goal is to find and track setup wave (2, 4, B) to enter clear 3, 5, or C impulses. 3 and C are the relaible money makers, and since they are fractal, they are in different degrees/char time frames for any currency.
I favor majors, like EUR/USD, over synthetic pairs. Try to stick to one or two currencies that are not correlated or inverse.
There is much more, but that is a summary. Get Prechters book, or Neely if you are a geek. And practise. Post your charts here and ask for feedback.
It is not true that 10 traders will give 10 different EW counts, it is a myth. There can only be a few valid counts, typically 2, but up to 4+ in wave 4. Complex corrections are the hardest to count, so don't sweat those, remember that the rules for impulse wave are quite strict, and if it is not a clear impulse 5: - then by default it is a correction. If bars are going sideways or overlaping a lot, it is a correction. If you don't know what it is, it is a correction.
Like a puzzle, Focus on what you can identify, and leave the toughest for last, is good advice.
This thread can help, or Grega EW by daily email is a bargain for $39/mo, learn from a pro if you want to learn fast. I use Grega and Elliott Wave International paid subscriptions - to confirm or challenge my counts. At the highest levels, they best tend to have about the same counts. Jaime Saettle at DailyFX has a good free perspective. Some in this group are excellent.
__________________
- FXoffshore
"Expect the best - prepare for the worst" Trade Charts and commentary: http://vault.bz
Last edited by FXoffshore, Sep 25, 2008 2:45am
|
#447
Sep 25, 2008 3:11am
| | Eur going higher
A small 5 impulse is just completing in EUR, will look for entry long after a 3 wave correction, around 1.4695. It should keep going up, but caution NY opening for news.
__________________
- FXoffshore
"Expect the best - prepare for the worst" Trade Charts and commentary: http://vault.bz
|
#448
Sep 25, 2008 3:30am
| |
Quote:
Originally Posted by FXoffshore
That is a good question, it is the kernel of Elliott skills. It depends on the trader, so others may do it a different way. By all means speak up, anyone.
In summary, I look for certain distinguishing or unique patterns, in tight bar view, never candles. Sometimes line view removes noise. - a vertical move is often a wave 3, sometimes w.1 starts like a rocket
- a contracting triangle is typical of a wave 4 or B (never a w.2)
- a sharp 3 wave retracement is a typical w.2
- a meandering retracement may be a w.4
a significant bottom or top is tricky because it is not always the extreme tick, like in the case of a truncated w.5 - so avoid starting there.
I start by looking on weekly or daily charts, then progress to smaller time frames to get it right. I look for those vertical or triangle patterns to anchor my count. then start counting 3s or 5s, applying labeling after some prep has been done.
When it comes to labeling, I don't begin there, it is the last thing I do. Also, I consider alternative counts, so I can eliminate them or prioritize them as the market moves. 'ALT' counts are risk management for me, plan B and C are on the table, but the preferred count is the one that satisfies the most rules/guidelines. The temptation is to favor a count that supports a traders presupposed bias, guard against that. Be open to all counts that are valid, but experience will teach which ones are likely. If a rule is violated, let the count go - don't ignore the solid violation.
I compare intra-market charts as well, other currencies, like Swissy is great for Eur to confirm a count. Gbp/Usd is good also. Gold and Oil have been highly correlated with EUR, and make advance moves that help.
Often I will confirm a count using a MACD like oscillator that ebbs and flows over a 0 line. Wave threes have the biggest hump, w.4 crosses the naught line, and w.5 almost always shows divergence.
Another standard is to put every trend into equal channels. After a while you get to know the personality of patterns and where they will go within the channel. As soon as 1 and 2 appear to be done, I'll put a channel on it as a guide where 3 will touch, 4 will retrace, and 5 will finish. 2 and 4 are your base line, or 0 and B in a correction. Very powerful and reliable tool.
My goal is to find and track setup wave (2, 4, B) to enter clear 3, 5, or C impulses. 3 and C are the relaible money makers, and since they are fractal, they are in different degrees/char time frames for any currency.
I favor majors, like EUR/USD, over synthetic pairs. Try to stick to one or two currencies that are not correlated or inverse.
There is much more, but that is a summary. Get Prechters book, or Neely if you are a geek. And practise. Post your charts here and ask for feedback.
It is not true that 10 traders will give 10 different EW counts, it is a myth. There can only be a few valid counts, typically 2, but up to 4+ in wave 4. Complex corrections are the hardest to count, so don't sweat those, remember that the rules for impulse wave are quite strict, and if it is not a clear impulse 5: - then by default it is a correction. If bars are going sideways or overlaping a lot, it is a correction. If you don't know what it is, it is a correction.
Like a puzzle, Focus on what you can identify, and leave the toughest for last, is good advice.
This thread can help, or Grega EW by daily email is a bargain for $39/mo, learn from a pro if you want to learn fast. I use Grega and Elliott Wave International paid subscriptions - to confirm or challenge my counts. At the highest levels, they best tend to have about the same counts. Jaime Saettle at DailyFX has a good free perspective. Some in this group are excellent.
|
Your are the man!!
Thanks a lot FXoffshore for sharing your knowledge with us.
It helps me in many ways.
Attached 1-5wave EurUsd chart which you mention above.
Attached Thumbnails
 |
#449
Sep 25, 2008 3:47am
| |
My AudUsd chart.
wave B is 62% of wave A, so i guess it ended at 0.8426.
I gonna short it for wave C.
Attached Thumbnails
|
|
|
|
 [复制链接]


 when one enters because he thinks price would turn around without any kind of confirmation from price itself. It looks like for some people it works though. Not for me.


