- 金币:
-
- 奖励:
-
- 热心:
-
- 注册时间:
- 2006-7-3
|
|

楼主 |
发表于 2009-4-7 14:05
|
显示全部楼层
Wednesday, January 7, 2009EU is going down?
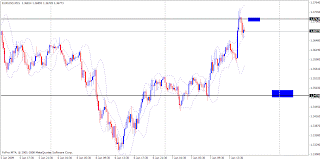
I expect now the EU is going down...if it does not exceed 1.3713, the price will go down till 1.3479..we'll see
Posted by mna@eejam at 10:53 PM
0 comments

Monday, January 5, 2009NZDUSD
Teringin nak Elliot wave kan NZDUSD
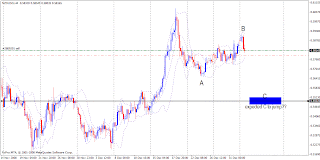
Posted by mna@eejam at 9:37 PM
0 comments

Thursday, December 25, 2008Contoh Penggunaan Indi Alligator+5SMA+200EMA+Stoch+AO
1. Keadaan 27 Nov 08
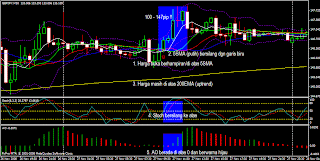
2. Keadaan 28 Nov 08
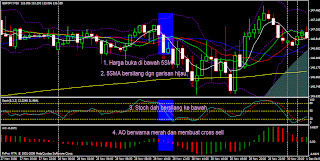
3. Keadaan 01 Dec 08
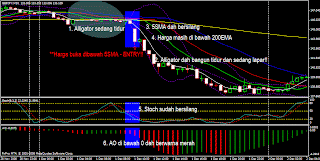
4.Keadaan 22 Dec 08
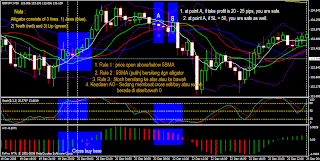
Posted by mna@eejam at 8:47 AM
0 comments

Wednesday, December 24, 2008Moving Average (MA)
The Moving Average Technical Indicator shows the mean instrument price value for a certain period of time. When one calculates the moving average, one averages out the instrument price for this time period. As the price changes, its moving average either increases, or decreases.
There are four different types of moving averages: Simple (also referred to as Arithmetic), Exponential, Smoothed and Linear Weighted. Moving averages may be calculated for any sequential data set, including opening and closing prices, highest and lowest prices, trading volume or any other indicators. It is often the case when double moving averages are used.
The only thing where moving averages of different types diverge considerably from each other, is when weight coefficients, which are assigned to the latest data, are different. In case we are talking of simple moving average, all prices of the time period in question, are equal in value. Exponential and Linear Weighted Moving Averages attach more value to the latest prices.
The most common way to interpreting the price moving average is to compare its dynamics to the price action. When the instrument price rises above its moving average, a buy signal appears, if the price falls below its moving average, what we have is a sell signal.
This trading system, which is based on the moving average, is not designed to provide entrance into the market right in its lowest point, and its exit right on the peak. It allows to act according to the following trend: to buy soon after the prices reach the bottom, and to sell soon after the prices have reached their peak.
Moving averages may also be applied to indicators. That is where the interpretation of indicator moving averages is similar to the interpretation of price moving averages: if the indicator rises above its moving average, that means that the ascending indicator movement is likely to continue: if the indicator falls below its moving average, this means that it is likely to continue going downward.
Here are the types of moving averages on the chart:
*Simple Moving Average (SMA)
*Exponential Moving Average (EMA)
*Smoothed Moving Average (SMMA)
*Linear Weighted Moving Average (LWMA)
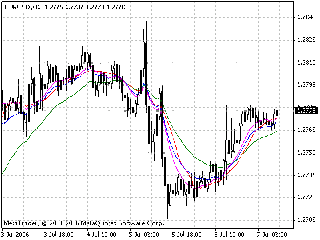
Calculation:
Simple Moving Average (SMA)
Simple, in other words, arithmetical moving average is calculated by summing up the prices of instrument closure over a certain number of single periods (for instance, 12 hours). This value is then divided by the number of such periods.
SMA = SUM(CLOSE, N)/N
Where:
N — is the number of calculation periods.
Exponential Moving Average (EMA)
Exponentially smoothed moving average is calculated by adding the moving average of a certain share of the current closing price to the previous value. With exponentially smoothed moving averages, the latest prices are of more value. P-percent exponential moving average will look like:
EMA = (CLOSE(i)*P)+(EMA(i-1)*(1-P))
Where:
CLOSE(i) — the price of the current period closure;
EMA(i-1) — Exponentially Moving Average of the previous period closure;
P — the percentage of using the price value.
Smoothed Moving Average (SMMA)
The first value of this smoothed moving average is calculated as the simple moving average (SMA):
SUM1 = SUM(CLOSE, N)
SMMA1 = SUM1/N
The second and succeeding moving averages are calculated according to this formula:
SMMA(i) = (SUM1-SMMA1+CLOSE(i))/N
Where:
SUM1 — is the total sum of closing prices for N periods;
SMMA1 — is the smoothed moving average of the first bar;
SMMA(i) — is the smoothed moving average of the current bar (except for the first one);
CLOSE(i) — is the current closing price;
N — is the smoothing period.
Linear Weighted Moving Average (LWMA)
In the case of weighted moving average, the latest data is of more value than more early data. Weighted moving average is calculated by multiplying each one of the closing prices within the considered series, by a certain weight coefficient.
LWMA = SUM(Close(i)*i, N)/SUM(i, N)
Where:
SUM(i, N) — is the total sum of weight coefficients.
source
Posted by mna@eejam at 11:45 AM
0 comments

Awesome Oscillator (AO)
AO is a 34-period simple moving average, plotted through the central points of the bars (H+L)/2, and subtracted from the 5-period simple moving average, graphed across the central points of the bars (H+L)/2.
MEDIAN PRICE = (HIGH+LOW)/2
AO = SMA(MEDIAN PRICE, 5)-SMA(MEDIAN PRICE, 34)
Signals to buy
Saucer
This is the only signal to buy that comes when the bar chart is higher than the nought line. One must bear in mind:
*the saucer signal is generated when the bar chart reversed its direction from the downward to upward. The second column is lower than the first one and is colored red. The third column is higher than the second and is colored green.
*for the saucer signal to be generated the bar chart should have at least three columns.
Keep in mind, that all Awesome Oscillator columns should be over the nought line for the saucer signal to be used.
Nought line crossing
The signal to buy is generated when the bar chart passes from the area of negative values to that of positive. It comes when the bar chart crosses the nought line. As regards this signal:
*for this signal to be generated, only two columns are necessary;
*the first column is to be below the nought line, the second one is to cross it (transition from a negative value to a positive one);
*simultaneous generation of signals to buy and to sell is impossible.
Two pikes
This is the only signal to buy that can be generated when the bar chart values are below the nought line. As regards this signal, please, bear in mind:
*another by followed is and line nought the below which minimum lowest (the down pointing pike a have you when generated signal the down-pointing) pike which is somewhat higher (a negative figure with a lesser absolute value, which is therefore closer to the nought line), than the previous down-looking pike.
*the bar chart is to be below the nought line between the two pikes. If the bar chart crosses the nought line in the section between the pikes, the signal to buy doesn’t function. However, a different signal to buy will be generated — nought line crossing.
*each new pike of the bar chart is to be higher (a negative number of a lesser absolute value that is closer to the nought line) than the previous pike.
*if an additional higher pike is formed (that is closer to the nought line) and the bar chart has not crossed the nought line, an additional signal to buy will be generated.
Signals to sell
Awesome Oscillator signals to sell are identical to the signals to buy. The saucer signal is reversed and is below zero. Nought line crossing is on the decrease — the first column of it is over the nought, the second one is under it. The two pikes signal is higher than the nought line and is reversed too.
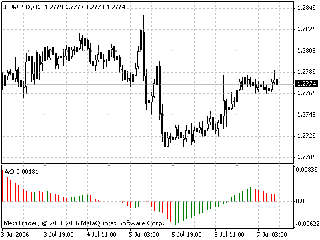
source
Posted by mna@eejam at 8:40 AM
0 comments

Alligator
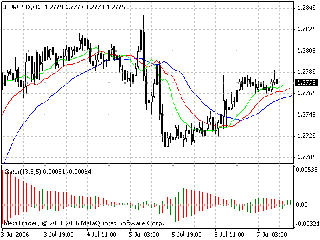
In principle, Alligator Technical Indicator is a combination of Balance Lines (Moving Averages) that use fractal geometry and nonlinear dynamics.
*The blue line (Alligator’s Jaw) is the Balance Line for the timeframe that was used to build the chart (13-period Smoothed Moving Average, moved into the future by 8 bars);
*The red line (Alligator’s Teeth) is the Balance Line for the value timeframe of one level lower (8-period Smoothed Moving Average, moved by 5 bars into the future);
*The green line (Alligator’s Lips) is the Balance Line for the value timeframe, one more level lower (5-period Smoothed Moving Average, moved by 3 bars into the future).
Lips, Teeth and Jaw of the Alligator show the interaction of different time periods. As clear trends can be seen only 15 to 30 per cent of the time, it is essential to follow them and refrainfrom working on markets that fluctuate only within certain price periods.
When the Jaw, the Teeth and the Lips are closed or intertwined, it means the Alligator is going to sleep or is asleep already. As it sleeps, it gets hungrier and hungrier — the longer it will sleep, the hungrier it will wake up. The first thing it does after it wakes up is to open its mouth and yawn. Then the smell of food comes to its nostrils: flesh of a bull or flesh of a bear, and the Alligator starts to hunt it. Having eaten enough to feel quite full, the Alligator starts to lose the interest to the food/price (Balance Lines join together) — this is the time to fix the profit.
source
Posted by mna@eejam at 7:58 AM
0 comments

Wednesday, December 17, 2008Indicators : Alligator + AO + EMA + SMA + Stochastic
Salam...
Aku nak share beberapa indicator yg masih aku gunakan dlm trading harian aku.
1) Alligator
2) 5SMA
3) 200EMA
4) Stochastic
5) AO
Rupa dalam chart spt beikut:
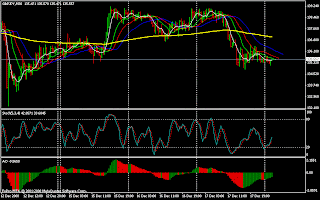
Macam mane nak masukkan indicator ini...
Bagi mereka yg baru dlm forex ye..mcm ni:
1) Alligator - Dalam platform Metatrader, pergi bahagian atas bernama "Insert". pastu gi ke Indicators -> Bill Williams -> Alligator.
2) 5SMA - Dalam platform Metatrader, Insert -> Indicators -> Trend -> Moving Average.
Masukan Period = 5, Shift = 0, MA Method = simple and Apply to = close.
3) 200EMA - Dalam platform Metatrader, Insert -> Indicators -> Trend -> Moving Average.
Masukan Period = 200, Shift = 0, MA Method = exponential and Apply to = close.
4) Stochastic Oscillator - Dalam platform Metatrader, Insert -> Indicators -> Oscillator -> Stochastic Oscillator.
Masukan %K period : 5, %D period : 3, dan Slowing : 4...Price field : Low/High, MA Method : Simple.
ATAU
%K period : 8, %D period : 3, dan Slowing : 3...Price field : Low/High @ close/close, MA Method : Simple.
5) AO - Dalam platform Metatrader, Insert -> Indicators -> Bill Williams -> Awesome Oscillator.
Itu sahaja caranye.
Nak entry :
Rulesnya spt berikut:
1) Tgk TF30 dan TF1H
2) BUY - pada TF30, bila SMA (garis putih) bersilang dgn alligator (line hijau / lips), dan AO berada di atas line 0 atau ingin cross dr bawah ke atas, posisi buy boleh di ambil. Pada masa yg sama, perhatilan juga Stochastic sama ada ia juga sudah bersilang atau tidak. SL dan TP bergantung pada apa pair yg anda trade. biasa kalau EU, UJ, GU, SL = 30pip...
3) SELL - pada TF30, bila SMA bersilang dgn alligator (line biru / Jaw), dan AO berada di bawah line 0 atau ingin cross dr atas ke bawah, posisi sell boleh diambil. Pada masa yg sama, perhatilan juga Stochastic sama ada ia juga sudah bersilang atau tidak.
Ambillah TP 20pips at least..insyaAllah dpt...
Selamat mencuba.
p/s TF30m diambil memandangkan ia taklah terlalu lama dan tidah terlalu cepat...kalau nak lagi selamat, gunalah TF1H...biasanye saya guna TF30m, entry dan refer TF1H utk tahu momentum price itu...kalau di TF1H, keadaannye sama spt TF30m, maka biasanye price utk terus pergi adalah cerah...boleh lah dpt lebih 50pips atau lebih 100pips.
Posted by mna@eejam at 10:40 PM
0 comments

Fill in the blanks
Can you fill in the blanks:
1) I will NOT trade if/when __________________________________________
2) I will ONLY trade LONG if/when ____________________________________
3) I will ONLY trade SHORT if/when ___________________________________
4) I will STOP trading for the day if/when ______________________________
5) I will STOP trading if I lose ____ pips or _____ trades in a row or $_______
6) I will STOP trading if i make ____ pips or _____ trades in a row or $______
7) I ONLY trade between the hours of _____ and _____
8) I ONLY trade on Sun( ) Mon( ) Tues( ) Wed( ) Thur( ) Fri( ) Sat( )
9) I will NEVER trade if/when ________________________________________
10) I ALWAYS do this BEFORE I begin trading ___________________________
Posted by mna@eejam at 3:14 PM
0 comments

Tip-tip Bagaimana Menjadi Jutawan Daripada Al-Quran
Salam...
Saya mulakan dgn Bismillahhirrahmannirahim...

Artikel di bawah ini saya dpt drp satu blog....
bacalah utk panduan kita...
Mahmud Ibn Labid r.a. pernah berkata, bahawa beliau mendengar Rasulullah bersabda, “Dua perkara yang tidak disenangi oleh anak Adam. Mati, padahal mati itu adalah lebih baik dari dugaan (kesesatan). Harta yang sedikit, padahal harta yang sedikit meringankan hisab. [1]
Namun sekiranya anda ingin juga menjadi seorang jutawan, Allah s.w.t telah berfirman di dalam surah An-Nuur ayat 37 hingga 38, “(Ibadat itu dikerjakan oleh) orang-orang yang kuat imannya yang tidak dilalaikan oleh perniagaan atau berjual-beli daripada menyebut serta mengingati Allah, dan mendirikan solat serta memberi zakat; mereka takutkan hari (kiamat) yang padanya berbalik-balik hati dan pandangan.”
“(Mereka mengerjakan semuanya itu) supaya Allah membalas mereka dengan sebaik-baik balasan bagi apa yang mereka kerjakan, dan menambahi mereka lagi dari limpah kurniaNya; dan sememangnya Allah memberi rezeki kepada sesiapa yang dikehendakiNya dengan tidak terhitung.”
Bermaksud, dengan mengingati Allah, mendirikan solat, memberi zakat dan sedekah, takutkan hari kiamat kerana akan diadili, seseorang itu akan mendapat limpah kurnia Allah dan pembalasan yang paling baik. Allah sesungguhnya satu-satunya sumber segala rezeki dan Dia akan menambahkan kurniaNya kepada hamba yang mempunyai ciri-ciri seperti di atas.
Kajilah Al-Quran dengan sebenarnya-benarnya, kerana tips untuk menjadi jutawan banyak terdapat di dalam Al-Quran. Terjemahan Al-Quran bermodalkan RM20 di pasaran. Menurut Abu Said r.a., Allah berfirman di dalam sebuah hadith qudsi, “Sesiapa yang disibukkan oleh Al-Quran daripada berzikir dan meminta kepadaKu, maka Aku akan memberikan kepadanya sesuatu yang lebih utama daripada diberikan kepada orang yang meminta kepadaKu” [2]
Sekiranya anda bukan berniat untuk menjadi jutawan, tetapi sekadar ingin hidup sederhana, beribadat kepada Allah. Serta dalam masa yang sama tidak mahu mempunyai bebanan hutang dan dikurniakan kecukupan dalam semua perkara, amalkan membaca Surah Al-Waqiah setiap malam. Menurut Ibnu Mas’ud, Rasulullah s.a.w telah bersabda, “Sesiapa yang membaca surah Al-Waqiah pada setiap malam, ia tidak akan ditimpa kemiskinan selama-lamanya.”[3]
Sekiranya anda sekarang berada di dalam keadaan terdesak, ditimpa kesusahan, memerlukan “fast-cash” untuk sesuatu perkara mustahak, maka ikutlah petua Rasulullah s.a.w. Di dalam sebuah hadith yang diriwayat oleh Huzaifah r.a., apabila Rasulullah s.a.w mengalami kesulitan, beliau akan segera mengerjakan solat.[4] Solat yang dimaksudkan adalah solat sunat. Ini adalah selaras dengan firman Allah di dalam surah Al-Baqarah ayat 45, “Dan mintalah pertolongan (kepada Allah) dengan jalan sabar dan mengerjakan solat; dan sesungguhnya solat itu amatlah berat kecuali kepada orang-orang yang khusyuk”.
Di dalam riwayat lain diceritakan oleh Abdullah bin Salam r.a., ketika keluarga Rasulullah menghadapi sebarang kesempitan rezeki, beliau akan memerintahkan mereka mendirikan solat dan membaca ayat 132 surah Taha.[5]Firman Allah di dalam ayat berkenaan, “Dan perintahkanlah keluargamu serta umatmu mengerjakan sembahyang, dan hendaklah engkau tekun bersabar menunaikannya. Kami tidak meminta rezeki kepadamu, (bahkan) Kamilah yang memberi rezeki kepadamu. Dan (ingatlah) kesudahan yang baik adalah bagi orang-orang yang bertaqwa.”
Kebanyakkan yang mengamalkan tip ini mendapat kemurahan rezeki yang luas dan “low profile”. Mereka tidak terburu-buru dan tergesa-gesa dalam mengejar kesenangan. Kebanyakkan mereka akhirnya menjadi komited dalam beribadat atau melakukan aktiviti dakwah. Mereka hanya melakukan sedikit pekerjaan dunia, namun kurnia yang diperolehi melebihi apa yang mereka kerjakan.
Wallahu’alam.
[1] Jami-ul-Saghir (Terjemahan H. Nadjih Ahjad),Imam Suyuthi, PT Bina Ilmu, Jakarta, 2003; Riwayat Ahmad, hadith #166.
[2] Muntakhab Ahadits (terjemahan Muhammad Qasim at Timori), Maulana Muhammad Yussuf Al-Khandalawi, Pustaka Ramadhan, Bandung, Indonesia, 2004; Riwayat Tirmizi, ms327
[3] Jami-ul-Saghir, op. cit.; Riwayat Baihaqi, hadith #8942, menurut Imam Suyuthi berstatus daif.
[4] Muntakhab Ahadits, op. cit.; ms 244
[5] Ibid.
Posted by mna@eejam at 12:53 PM
0 comments

Does $700 Billion Deserve This Much Attention?
By Robert Folsom
As the economic crisis has unfolded, a lot of different financial issues have played their own special part, and most have had their "day in the headlines." But when it comes to sheer volume of media ink and airtime, the $700 billion bailout probably tops the list. Does it deserve all the attention it's getting?
The "$700 billion" figure was conceived immediately after Lehman Brothers collapsed in mid-September, and has remained in the news virtually every day since. This week the focus was on an "oversight committee" that's supposed to hold the Treasury Department accountable for what it does with the $700 billion. That committee managed to issue its first report on Dec. 10, titled "Questions About the $700 Billion Emergency Economic Stabilization Funds."
I actually read the questions and they seemed reasonable enough. Even so, I couldn't help but wonder if this is the first time in history that a committee put 10 questions down on paper and called it an "Oversight Report" -- even before the department they oversee bothered to give any answers.
Historic firsts aside, there's still the question of $700 billion deserving this much attention. The reflexive answer would be "You're bloody right it deserves attention -- that's a lot of taxpayer money!"
And that's true enough -- "a lot" indeed. Then again, the scope of this crisis has helped make certain dollar amounts somewhat, umm, relative...
...Which is to say: Some numbers are bigger than others. The Treasury has supposedly spent only half of the $700 billion, since it became available on Oct. 3. Of course, it's hard to imagine that the printing presses could go any faster anyway.
But wait: The printing presses HAVE been going a LOT faster. The $700 billion is a sideshow, dear reader.
The Federal Reserve has pumped out $1.23 t-t-trillion in the past 12 weeks alone, through their so-called lending facilities. As for "oversight," you may as well imagine instead a big collective horselaugh. There ain't no oversight. The Fed refused a Freedom of Information Act request to disclose the recipients of their lending (which actually totals $2 trillion so far).
So, I believe that "Too much attention?" to the $700 billion is actually the wrong question. The better one is, "Why almost NO attention to TRILLIONS flowing out of the Federal Reserve?" Bloomberg News has been virtually alone in covering this, and is likewise alone in filing suit regarding the Fed's refusal to disclose who the borrowers are.
The "bailouts" haven't helped anyone or anything except the big institutions on the receiving end. The best help you're going to get will consist of what you do for yourself.
Posted by mna@eejam at 8:01 AM
0 comments

Tuesday, December 16, 2008About Elliotwave Analyst in Elliotwave.com
ROBERT R. PRECHTER
The founder and president of Elliott Wave International. He has been publishing The Elliott Wave Theorist since 1979. Mr. Prechter is also Executive Director of the Socionomic Institute, an independent think-tank whose mission is to develop socionomics as an academic discipline and to promote its commercial application.
STEVEN HOCHBERG
Began his professional career with Merrill Lynch & Co. and joined Elliott Wave International in 1994. He became co-editor of The Elliott Wave Financial Forecast for its inaugural issue in
July 1999.
PETER KENDALL
Joined Elliott Wave International as a researcher in 1992 and has contributed to The Elliott Wave Theorist since 1995. He has been co-editor of The Elliott Wave Financial Forecast since its inception in July 1999. He is also the director of Elliott Wave International’s Center for Cultural Studies.
Posted by mna@eejam at 1:04 PM
0 comments

Sunday, December 14, 2008Japanese Yen: Guesswork Vs. Forecasting
By Vadim Pokhlebkin
You may have heard that this week, the Japanese yen hit a 13-year high against the U.S. dollar. As The Financial Times put it in a December 17 article,
The yen appreciated to its strongest level against the dollar in 13 years as the US Federal Reserve unexpectedly cut interest rates from 1 per cent to a range of 0 to 0.25 per cent. The yen’s reached Y88.24 to the dollar by mid-afternoon in Tokyo. [Y87.15 on Dec. 17 – Ed.] The currency has gained more than a quarter in value against the dollar so far this year.
To currency traders, this pair is known as the USD/JPY. So, why is the yen gaining? Apparently, "It gained a reputation as a safe-haven currency during turbulent times…" Now that we find ourselves in the middle of a financial crisis, that's a perfectly good explanation – in retrospect. But could you have predicted the yen's current strength six months ago? A year ago?
It depends on how you would have gone about coming up with that prediction. Was there anything in the yen's "fundamentals" six-twelve months ago that would have suggested its current strength? Unless the memory fails me, no. So, a year ago, stating that the yen would soon gain "a reputation as a safe-haven currency" likely would have been nothing but a wild guess.
The opposite of wild guesses is a certainty. Somewhere in-between is a forecast – still a guess, because no one knows the future – but an educated guess, nevertheless. (Maybe even a highly educated one.) Thus, a forecast is not based on guesswork; in the two examples you're about to see, forecasts were based on years of experience and concrete technical evidence that the yen was offering earlier this year.
Here is a forecast for the USD/JPY from Elliott Wave International's monthly Global Market Perspective (GMP) – as published on January 4, 2008, almost exactly a year ago:
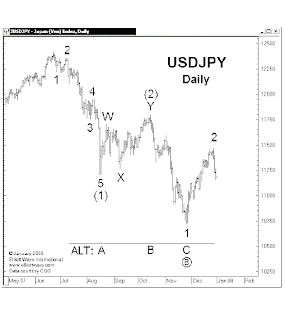
Forecast, January 2008 GMP (excerpt): "We can anticipate that the yen will … resume its larger bull trend against the dollar, evidenced by $JPY falling to a new low."
Posted by mna@eejam at 3:26 PM
0 comments

Newer Posts Older Posts Home |
|
|
 [复制链接]
