- 金币:
-
- 奖励:
-
- 热心:
-
- 注册时间:
- 2006-7-3
|
|

楼主 |
发表于 2009-4-6 08:46
|
显示全部楼层
SPX

[size=130%]10.12 - 2008, US Market Closed
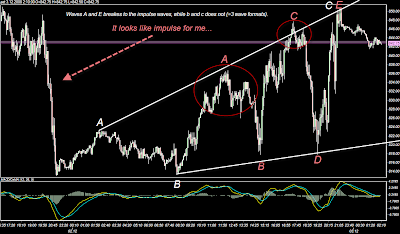
[size=100%]Unfortunately, I accidently just noticed 60 minutes data pattern looks very much of it > Bear Diagonal...
If it´s going to retrace, size is 80 points. SPX 808 is 61.8% retracement for this pattern. 830 is 50%.[size=100%]
Very different view what I been looking at so far as A-B-C reactionary upwave, but if you look this particular shot again, it could be easily be also fully impulse which has ran it´s cource allready. W3 could fit previous top, as well as then a-b-c with W4 down, and finally last W5 up.
Linkit tähän tekstiin
Merkinnät: SPX
SP-500 - Some StockPatterns + Elliott Wave Projections
[size=100%][size=180%]7.12 - 2008
I need to confess your life who try to hold this market and ride up with it is not comfortable task, even it looks alike 718 offered that bottom for us, at least for now - because each waves and each up movements takes so deep retracements it allmost looks alike market is not going anywhere while terrible macro fundamendals slash market down seriouslytime after times. Last monday market bottom was 814 with SPX, 5 days later as this friday it was 817. That´s 3 points up progress in 5 days holding most uncomfortable & unpleasant riskparameter called time.
For traders this is paradise, deeper the movements are more clear they comes as there´s much less noise. Even, it´s not easy task to fill specific waves for them, patterns and fibs still works, market simple getting from very oversold to very overbought several times per week offering multiple entry and exit points for both directions - if you patient enough to wait your turn to make a new entry, should not be too difficult.
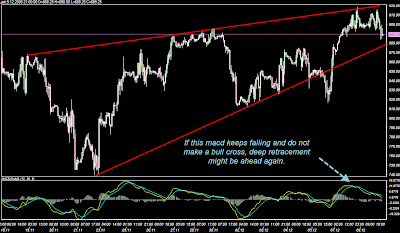
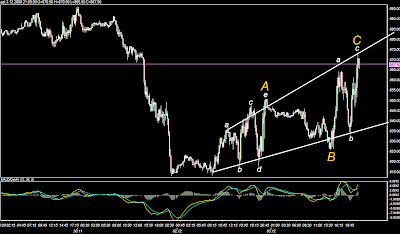
Here´s a few charts for the new week or next 2 weeks ahead, but not subminuette wave charts, so, these does not telling anything about tomorrow. If mainforce (wave) C comes valid now, "speed" and overall wave progress could come slightly better to fullfill IV upwave, but I would not certainly be surprized if this deep retracements seen at so far keep coming every day and every week, besides I never hold&swing any any IV waves - it´s one of the most boring trading wave you can get, but still doing some progress at this time because our impulses down were so huge one´s during the year.
Enjoy your trading, before Santa will come and watch carefully every bigger 50% retracements market offers - they usually offers reversal points, even when overlap occures.
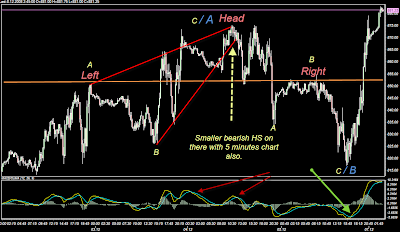
[size=100%]I have no idea what is this very last impulse wave we got on friday, it kicked in after 50% retracement was met, just traded it based for my 15 minutes macd signal as it looked alike a-b-c also, but it ran to the 875 area and over again, which is massive bearish HS right shoulder (see my older post charts). If market leaves this pattern now, perhaps at this time we could be lucky and it retraced allready, but at so far this pattern has been one of the best shorting setup in all timeframs and it appears often also. If it´s part of the right shoulder, we have very serious troubles ahead. Which is the case, we´ll see on next week, but my best guess is as mentioned in charts we work with C upwave, but I have absolute zero positions to hold it. Waiting another signal & retracement from market, besides this very last powerfull upwave should easily retrace also, even it looks alike impulse wave.
[size=100%]Btw. one nice thing to have a blog is that peoble usually post if anything interesting new websites hit the area. Usually they´re don´t anything interesting or unique, but someone might like this one - if you don´t have any financial software for most basic tasks stock scanning you might like to test this>
http://www.dojispace.com/
[size=100%]No register requirement either, seems to work just like that. Webmaster seems to forget fill shorting scanning plus fibonacci issues also - the most important thing which works in this business like a train, but after all - for quick very basic scanning if you´re happy enough with daily signal data seems to be fare enough.
Linkit tähän tekstiin
Merkinnät: SP-500 - Some StockPatterns + Elliott Wave Projections
Well,
That was quick ! It went to 44,50 $, then freefall again ;)
We´ll see if Merrill Lynch is correct and Oil will reach 25 $ on next year ! Hugo Chavez will have pretty tough times ahead as well as Mr. Putin with that price!
Enjoy your weekend, if US market will offer something interesting today when it opens, I might come with chart - if not, enjoy your weekend!
Linkit tähän tekstiin
Merkinnät: Well
European Morning
[size=100%]5.12-2008
TrailingStop Covered EuroDollar short position at 1.2745 by over night. No clear setup enough for re-consider, but I think it´s at zigzag mode.
Thank You Eur-Usd. We really need to see crude oil reversal soon, it cannot fall without reversals at all placed. 43 $ plus those pennis sounds amazing price. 15 Minute macd has done allready pretty nice rollover, I think today could be Oil bullish day.
Linkit tähän tekstiin
Merkinnät: European Morning
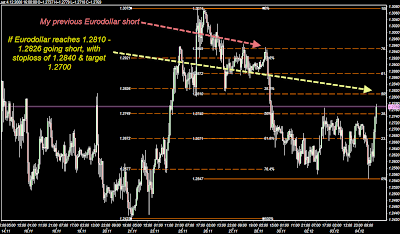
Another Entry
[size=100%]US market closed. Same old, same old - usually when you do short major size fibonacci with EuroDollar first one allways blows out with stoploss, but I allways make new entry and certainly it finally started to fall, even needed to wait allmost all day with it as 1.2800 offered some shorter timeframe support before it was broken.
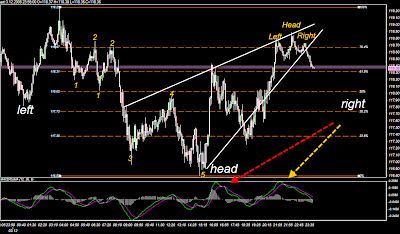
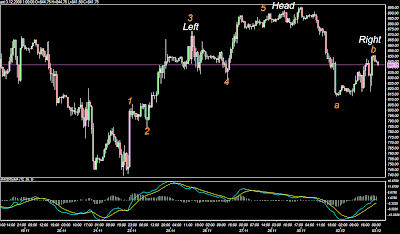
SPX bearish Head&Shoulder chart I mentiond somewhere in lower posts department was placed today, market build that right shoulder at 875, twice actually making doubletop for it while 15 minutes macd started to fall in last 24 hours. I don´t know if this HS pattern will be under progress now, but if it is, we will go much deeper on next week as it´s very large pattern at this time.
SPX 837 is .618% fib support for this new downwave, one snapback movement from there likely ahead, but then the rest should follow - I´ll keep the same Eur-Usd short position by overnight. Haven´t decided exactly yet where to cover it.
Linkit tähän tekstiin
Merkinnät: Another Entry
EuroDollar
Eur-Usd, going short once and if target price will be reached. Might be that car makers will get their money and bull is coming, but I allways short 50% retracements.
Linkit tähän tekstiin
Merkinnät: eurodollar
EuroYen
4.12 - 2008 Morning, it seems EuroYen has been falling more during rest of the night even more, so, I suppose this was true bear diagonal (even it looked a bit weird). I removed my stops at this morning to 117.50 level, it if breakes it upside - profits taken home in there, if it falls I´ll let it fall - as it looks alike after all countries made a rate cut.
Thank You EuroYen !!!!!!!!!!
Linkit tähän tekstiin
Merkinnät: EuroYen
EuroYen
[size=100%]4.12 - 2008
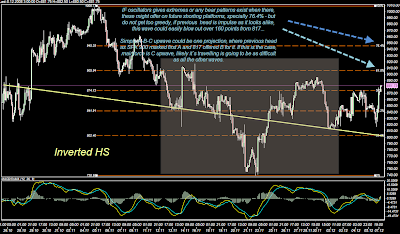
Asian night, shorted EuroYen at 118,72 as it build so beautifull bear diagonal and bear HS above of it - hopefully someone on there is with me with this one, but perhaps this might build something bigger later on, if we get that 50 % we could have inverse HS - which would be extremely bullish pattern. Chrisis, I love this currency paritet (it track´s also stockmarket very closely).[size=100%] Simple a-b-c down, first a down, then b wave up from .618, then c wave down....
Linkit tähän tekstiin
Merkinnät: EuroYen
Still Expanding
[size=180%]3.12 - 2008
[size=100%]Noap, no crash, just average down, then up again - higher. Pretty deep retracements inside of this triangle what every upmovement takes. Perhaps, this is it. We start getting expanding triangle channel as upwave, because I am not coming with you - I am going to subdivide to EuroYen trading for this month.
Enjoy, but take care that you won´t be there when final E will be placed, when it´s placed I will be there then ;). I think VIX is the best target to EW chart now, because it does have a fully impulse which could correct A-B-C down. Sorry, I just don´t like non impulsive expanding channels, if Oil will join to the club, then I might re-consider, but at so far it´s still landing, even 50 $ didn´t offer much support for it.
Linkit tähän tekstiin
Merkinnät: Still Expanding
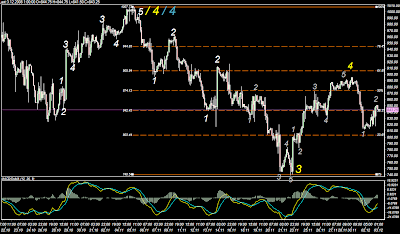
SPX-500 - Elliott Wave Count
[size=100%][size=180%]3.12 - 2008
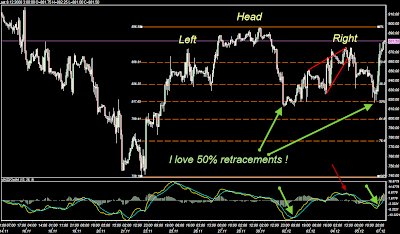
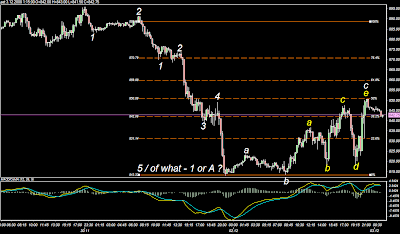
I know many expext and hope market to take snapback rally for Christmas for SPX 1000 or even to the better side as Vix gave extreme bearish signals reaching allmost one hundred. We have alternates and we could see A-B-C up wave as as scenario to fullfill IV for SPX1000, but as monday sold down relatively strongly & violently I started to gave today another look for it, after all it was just one of these same bearish HS patterns which EuroYen and EuroDollar has also recently offered quite often, but pretty strong - It argues it have to be impulse wave ?
After stockmarket crashed at this monday market took then 50% correction and bought immediately when US closed, it was SPX 814. It make it twice creating doublebottom again on the next day ie. today as 817 and once again market bought it and once again it was HS pattern which dropped market to this level. Then with full impulse wave making relative strong snapback rally for SPX 850 level. More important information however was 50% level itself, because this fib retracement has been in the most strong short and long setup for this market for decades in all wave time formats starting from subminuettes all the way up.
So, here it is, if this comes true - Houston, we have a serious problem if I am right this one. Likely I will update this one tomorrow or at least before ECB will release ratecut on thursday - hopefully, FX world express more clear setup just before. All the other countries like UK and Australia cut allready 0.75 points and that´s likely what ECB will do as well, but chart might want to tell us something before that happens.
So, if you see crash tomorrow, start looking these charts - if you won´t see any crash, then you can still look at these charts and make a point > nice charts, but wrong call.
Oscilllators are however relatively neutral in all timeframes, not extreme setups or support available from there. Either the case, I feel this expanding triangle to be very interesting to see how it´s going to solve itself - you don´t see it often with SPX ! However, after waves, we have soon (again) one bearish HS as one chart below pinpoints. Timeframes with charts below are down from 2 hours to 15 minutes.
99 % of the hard pro technical folks are bullish now in this indursty, but there´s also very simple guideline of the EW theory I just created, the side which ran faster is usually correct and with this one I mean this monday plunge. Do you really think most strong downside day of the multimonth plunge is end of this when it´s not even new low - don´t know, but one need pretty good imagination if you try to fit that for B wave for example...let´s hope it´s more clear tomorrow - shall we....
Linkit tähän tekstiin
Merkinnät: SPX-500 - Elliott Wave Count |
|
|
 [复制链接]


