搜索
楼主: hefeiddd

一个笨蛋的股指交易记录-------地狱级炒手

  [复制链接]
 楼主| 发表于 2009-4-6 07:39 | 显示全部楼层
eurusd march 18, 2009 update II

[size=85%]Here a quick update. EURUSD gained over 500 pips after FMOC update.
[size=85%]Targets of 1.3300 was hit. Second Target of 1.3500 almost hit.
[size=85%]1.3500 is trendline resistance. If it breaks there will be resistance at 1.3585, which is 38.2% fibonacci retrace from 1.47 to 1.25.


|

Filed Under: eurusd


8:09 AM
GBPUSD march 18, 2009 update

[size=85%]Relabeled the top of I since price fell below wave i of I and is therefore not a wave 4, but must be a wave II.
[size=85%]If that is true, then this might be wave III starting its way to 1.5000.


|

Filed Under: gbpusd


7:23 AM
eurusd march 18, 2009 update

[size=85%]Target is 1.3300. MACD is open, so looking for further gains.
[size=85%]Resistance is at the top of the fibonacci channel.


|

Filed Under: eurusd


5:38 AM
Cable GBPUSD March 17, 2009

If it falls below 1.3900 then a top is in place at 4227 and we are forming a wave 2 of bigger degree. If it stays above 1.3900 then we are in a wave 4 and should see a higher top this week. 1.3945 is the target for wave c, if indeed a wave c (1.618 ext. of wave a).


|

Filed Under: gbpusd


Newer Posts Older Posts Home
金币:
奖励:
热心:
注册时间:
2006-7-3

回复 使用道具 举报

 楼主| 发表于 2009-4-6 07:40 | 显示全部楼层
EUR/JPY March 17, 2009

[size=85%]Here is an update from 2 weeks ago on EUR/JPY. The target of 1.2800 has been reached.


|

Filed Under: eurjpy


5:19 AM
eur/usd March 16, 2009

Here is the chart from yesterday evening.


|

Filed Under: eurusd


11:09 AM
GBPUSD March 15, 2009

Here is my GBPUSD count.
The MACD is still open, indicating more upward move. However, wave 4 should be setting in quickly, if not already.


|

Filed Under: gbpusd


11:07 AM
EUR/USD March 15, 2009

Here is my eurodolar count.


|

Filed Under: eurusd


Newer Posts Older Posts Home
金币:
奖励:
热心:
注册时间:
2006-7-3

回复 使用道具 举报

 楼主| 发表于 2009-4-6 07:41 | 显示全部楼层
Cable short term trade setup

Here is my short term trade setup for the cable.
Obviously it is the weekend and a gap can occur.
However, as an example this is a way to trade shortterm with the help of Elliott Waves.

Watch the trendline, the price is currently in an ABC correction and forming a wave C. Wave C van run flat against the trendline, or break towards 1.3900. Watch the bounce of the trendline, that would be your entry. If it breaks, wait for 1.3900 level for support. A bounce of 1.3900 would then be your entry.
The first target is 1.4100, that is a psychological resistance, the second target is the 1.618 extension of wave 1, which would be 1.4150.
One way to trade it is to open 2 contracts, one for each target. Use your moneymanagement wisely.
A drop below the start of wave ii would invalidade this trade.


|

Filed Under: gbpusd


5:34 AM
GBPUSD Update March 13, 2009

[size=85%]For those of you who have been trading my GBPUSD count, congratulations, you have made a few pips!


[size=85%]We are entering a cluster of resistance and so I am expecting some corrections.
[size=85%]I closed out for almost 400 pips profit and call it a day, since it is Friday the 13th...


[size=85%]Next week I expect a retest of the neckline on this head and shoulder pattern. The neckline is at 1.3900.
[size=85%]I will buy the dip.
[size=85%]If it holds, we will go up further, 1.50 is a good initial target.Also look at the MACD. It is opening up indicating momentum and it hasn't crossed into the positive yet, which will happen and round downward again when it is well in the positive.
[size=85%]Good luck!


|

Filed Under: gbpusd


12:47 PM
Cable Update March 11, 2009

The cable is following EW to the tee and has been for a while now. We went long yesterday and hopefully this turnaround will last for a while.
The flat scenario will put us at 1.49 and change. If I look at the MACD and see the last similar move it gained about 1100 pips.
That would put us in the 1.48 area and change, so a flat is very possible.
Also, a Head and Shoulder pattern maybe forming, keep a lookout.


|

Filed Under: gbpusd


12:42 PM
GBP/USD Update


One more wave down...Its a B wave, they can retrace all or even more than wave A. After B comes...C! If this is correct a big turnaround can be expected.


|

Filed Under: gbpusd


Newer Posts Older Posts Home
金币:
奖励:
热心:
注册时间:
2006-7-3

回复 使用道具 举报

 楼主| 发表于 2009-4-6 07:42 | 显示全部楼层
EUR/USD Update March 9. 2009 1h chart

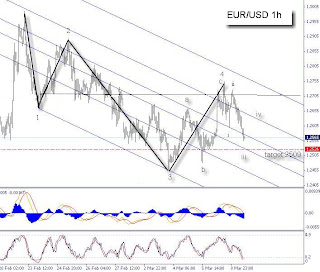
Here is an update. I believe we are in wave V of 5 and this should be the last wave before a significant move up.
2509 is the 161.8 extension of wave I and the target for wave 3.
See the fibonacci channel drawn in the chart as well.
Both indicators are pointing down, reaching their turning points (oversold) a good indication that this is indeed a wave 3 and an indicator that it might stay oversold for a while. As a contra indicator you could see this as a sell signal.
Remember there is still a minor wave iv to form before heading down one more time, so expect some pullback.


|

Filed Under: eurusd


9:54 AM
Psychology in Trading
Approaching Trading With an Empty MindBrett N. Steenbarger, Ph.D.www.brettsteenbarger.comNote: A version of this article appeared on the Trading Markets site, 8/7/06I recently accompanied my father to a real estate sale in the southern part of Florida. That market for homes and condos had been among the hottest in the country. When we looked at the number of properties on the market at present, however, and the (paltry) number that were selling, we could see that most million-dollar units would have to be priced $200,000 or more below their recent, peak values. Nonetheless, sellers, for the most part, were keeping their asking prices fixed, despite the clear reality that they were generating no traffic and certainly no offers. Quite simply, they were slow to update their perceptions in a changing reality.

Cognitive psychologists emphasize that we see what we want to see: we are all prisoners of the mental maps we create. Once a trader forms an opinion, he or she is more likely to overweight information consistent with this view than information that is contradictory. In one behavioral finance experiment, subjects have the opportunity to offer an item for sale. In one condition, the subjects have won that item in a contest. In the other condition, the subjects price the item for sale, but it hasn't been given to them. As you might guess, the subjects who owned the item demanded much more money for the item than those who had no ownership. It was the same item: only the fact of ownership made it valuable. So it is with our market opinions: once we own it, we overvalue it.

Other studies suggest that we see only what we expect to see, and thus become blind to new realities -- much like the Florida sellers.

Laurence Gonzales, in his fascinating book "Deep Survival: Who Lives, Who Dies, and Why", describes a research study from Harvard psychologists. They showed people a film of basketball players passing the ball to each other. During the film, a man in a gorilla costume walks into the middle of the action and stays visible on the screen for about five seconds. One group of subjects was asked to count the number of passes among the players; the other group was simply asked to watch the film. Incredibly, 56% of the subjects who counted the passes didn't ever see the gorilla. Of course, everyone asked to simply watch the film noticed the gorilla man on the basketball court.

The point is that the brain is a kind of search engine: a Googler of reality. If we program our search to look for passes among basketball players, that's the output we receive from the brain. What is extraneous to our search (gorillas) is eliminated. When we conduct a broad search, we receive a wider range of outputs. Focused searches work well if we're looking for a specific item, such as lost car keys. They don't work so well when we need to process all of the information needed to survive in an environment of risk and uncertainty.

It is very easy to approach the markets in focused search mode. We develop a hypothesis about the market (bullish or bearish) and we prime ourselves to look for certain chart patterns or indicator readings. In our haste to find what we're looking for, we can miss the gorillas in the market. Afterwards, we might look back on market action and think, "How in the *^#@ could I have missed that??!!"

Gonzales writes, "The practice of Zen teaches that it is impossible to add anything more to a cup that is already full. If you pour in more tea, it simply spills over and is wasted. The same is true of the mind. A closed attitude, an attitude that says, 'I already know', may cause you to miss important information. Zen teaches openness. Survival instructors refer to that quality of openness as 'humility'. In my experience, elite performers, such as high-angle rescue professionals, who risk their lives to save others, have an exceptional balance of boldness and humility..." (p. 91).

Gonzales has provided a concise formula for trading success: boldness and humility. The exemplary trader has the boldness to act with conviction, and the humility to realize that what is apparent may not be all that is there.

Notice how so many of the excellent market bloggers --
and come readily to mind--track a variety of sectors and indices, examining the market from multiple angles. They're not just looking for the passes on the basketball court; they want to make sure they're not missing any market gorillas.

As I recently emphasized on my research blog, TraderFeed, the dominant themes of the equity markets have changed. Everywhere we look, there is evidence of risk-aversion. Look at which sector funds are growing assets and which are losing them. Look at which sectors have outperformed the market, and which have not. Value is trumping growth, and large caps are outperforming the small and Midcaps. This is no longer 2003 and 2004.

We can fail to update our mental models, like those Florida homeowners, and miss the gorilla in the market, or we can have the humility to accept and work within changing realities. When it comes to the markets, an empty mind goes a long way toward ensuring a full pocketbook.

Brett N. Steenbarger, Ph.D. is Associate Clinical Professor of Psychiatry and Behavioral Sciences at SUNY Upstate Medical University in Syracuse, NY and author of The Psychology of Trading (Wiley, 2003). As Director of Trader Development for Kingstree Trading, LLC in Chicago, he has mentored numerous professional traders and coordinated a training program for traders. An active trader of the stock indexes, Brett utilizes statistically based pattern recognition for intraday trading. Brett does not offer commercial services to traders, but maintains an archive of articles and a trading blog at www.brettsteenbarger.com and a blog of market analytics at www.traderfeed.blogspot.com. His book, Enhancing Trader Performance, is due for publication this fall (Wiley).


|


8:49 AM
EURUSD long term pespective 030609 4h

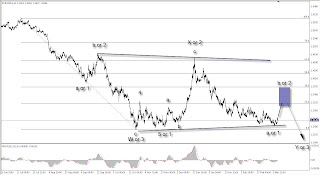
This is the long term perspective, only a probability. The bottom channel needs to be taken out to confirm a deeper correction.
For now we will go up for a while. I am targetting the blue highlighted area.


|

Filed Under: eurusd


9:14 AM
EURUSD update March 5, 2009 1hr chart

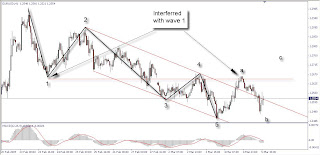
Here is my take. Now remember that B waves are crazy waves, they can go whereever they want to, even a new low, as long as the correction is in 3 waves. My experience the 78.6% fibo usually holds well and it rarely drops below the start of wave A, but this is no guarantee that it will be so in this case. Caution is advised.


|

Filed Under: eurusd


Newer Posts Older Posts Home
金币:
奖励:
热心:
注册时间:
2006-7-3

回复 使用道具 举报

 楼主| 发表于 2009-4-6 07:43 | 显示全部楼层
Dow Jones, will history repeat?

I made a comparisment between the DJ of today to the DJ of '29 - '34.
If history repeats, we are in for a long and deep depression.
Corrections happen in 3 waves A, B and C. We are about to complete a wave A.
Wave B retraced 50% in '30, that would put us at about 10000 today. Then a deep wave C came and a same correction would put us at 3500. Twice as low as we are today. Recovery won't be until 2012.
Hopefully it won't happen...


|

Filed Under: dowjones


4:44 PM
eur/usd update march 4, 2009


After evaluating the 3 scenario's the impulse is the only scenario left.


|

Filed Under: eurusd


8:47 AM
GBP/USD updare March 3, 2009

Update on the cable. Still some room downward.


|

Filed Under: gbpusd


8:41 AM
EUR/USD update March 03, 2009

It will be interesting to see if 2509 holds. If it goes through, we are very bearish.


|

Filed Under: eurusd


Newer Posts Older Posts Home
金币:
奖励:
热心:
注册时间:
2006-7-3

回复 使用道具 举报

 楼主| 发表于 2009-4-6 07:44 | 显示全部楼层
EUR/JPY 4h update 03-01-09 4h

Chart for the EURJPY.


|

Filed Under: eurjpy


5:44 AM
GBP/USD update 03-01-2009 4h chart

Here is an update on the cable.
It looks like the 61.8% fibonacci support at 4067 is holding well sofar, however there is still potential on the downside possibly as far as 3800. The upside is there is C is a flat C which would complete wave B.
Once B is completed there is a potential for 1.6000.


|

Filed Under: gbpusd


3:33 PM
EUR/USD Elliott Wave Update 02-28-09 30m chart

Here is a bigger picture update. I like this probability.
Looks like we need to close the long we entered and wait for an enty near the bottom of the channel.


|

Filed Under: eurusd


9:10 AM
Update EUR/JPY Feb 27, 2009

You have got to love this game...
After I entered long on eurusd it went up 100 pips and down another 100 pips. However, the stop is not out so we are still in and yes, up 30 pips now.

Here is a look at the EUR/JPY notice the alternate count. However given the MACD I prefer the current count as the MACD shows lots of room on the downside still.

Trade safely!


|

Filed Under: eurjpy


Newer Posts Older Posts Home
金币:
奖励:
热心:
注册时间:
2006-7-3

回复 使用道具 举报

 楼主| 发表于 2009-4-6 07:45 | 显示全部楼层
Update Dow Jones Feb 27, 09

[size=85%]Here is my update on the Dow Jones. As I said last week, it will go lower. 7000 was the target and the market has gapped towards that level.
[size=85%]Will be interesting to see if 7000 holds, the 1.618 extension of wave 1 has already been passed. If it holds it will be wave 5 of 3, then a retrace will follow, followed by another run down.


|

Filed Under: dowjones


6:50 AM
EUR/USD update feb 27, 2009

I just entered a long based upon this count.
I kept the stop really close. A break through 78.6% fibo might mean we go back to 100% retrace. Below 1.2509 and we are bearish.


|

Filed Under: eurusd


6:23 PM
Update Feb 26, 2009


[size=85%]Today was a bit of a strange day for trading. Usually the EUR/USD, EUR/JPY and GBP/USD are trading in good corrolation with eachother, today not so.
[size=85%]I was long on EUR/JPY and short on GBP/USD and EUR/USD on the 15m intraday chart and won all 3 trades. Also, the EUR/JPY went down 200 pips, then up 200 pips and down 260 pips again. In other words, the pairs are looking for a direction.
[size=85%]The EUR/JPY looks ready for a bigger correction. The price dropped form 126 to 123.61 which is a 23.6% retrace from the start of wave III at 115.63. The price might drop some more, maybe even to 120. Looking at the MACD we can see that the crossing is very high up which usually means a bigger correction.


[size=85%]The EURUSD is a mess right now. I would stay away. The chart I gave is in very thin pencil. We might also see another wave down. For the price to stay bullish we need to stay above 1.2511. See my earlier chart for that.
[size=85%]A good risk reward is to enter the market when it bounces off the trendline with short stops. The RSI is slightly up and my neuronetwork is about to cross on up.


[size=85%]The GBPUSD has the same story. It might drop to the 78.6% fibonacci to as much as 1.3818, but it might also stay flat at the 61.8% retrace at 1.4067. From there we will go up again in the form of a bigger wave C to as high as 1.6000.
[size=85%]RSI is slightly down.

[size=85%]Stay tuned...


|

Filed Under: eurjpy


9:37 AM
EUR/USD Update Feb 26, 2009


This is what might be occuring on the eur/usd.
A seemingly indecisive eurodollar might be setting up for a big move upwards.
The C wave went flat and couldn't quite reach the low of wave A.
That means a triangle is now forming and in this count it is part of a wave 2 (or B).
If this is correct price might be 'coiling' to reach 1.3400 which is the 1.618 extension of wave 1(or A)


|

Filed Under: eurusd


Newer Posts Older Posts Home
金币:
奖励:
热心:
注册时间:
2006-7-3

回复 使用道具 举报

 楼主| 发表于 2009-4-6 07:45 | 显示全部楼层
EURJPY reevaluating feb 24, 2009

We broke out of the upper trendchannel and tested the upward trendline at 119.55. Resistance held and that means we might have to look at different options.
Wave 1 ends at 123.69. That is the line in the sand for a wave 4 correction. Crossing this price would mean that a bigger correction is ongoing and we might see higher prices. Staying below could still mean another run down to retest the low at 112.29.
We should see a retrace from her but staying above 119.55. If we go below 119.55, we will go further down, possibly to 112 again.

Another option for this is a double zigzag where wave I is in fact a C and II would be an X (notice the 5 wave correction) and we are currently forming wave Y, but that depends on the 123.69 mark, it needs to hold in order for the double zigzag to be true.


|

Filed Under: eurjpy


2:13 PM
EUR/USD update feb 23, 2009

Where are we now?

We are now in a 3 wave correction and depending on which of 3 scenario's described earlier we are in a 2 or B wave.
They can retrace almost all of wave 1 or A. B waves can even exceed the level of wave A.
I marked 2585 as the 78.6% fibonacci level. That is my initial target although we should realize that the price can hold at 2700 which coincides with the 61.8% fibonacci retrace, but I like to see confirmation from the MACD first. Once we have a bottom, a C or 3 wave should form and target there is 3300.


|

Filed Under: eurusd


2:00 PM
Dow Jones Feb 23, 2009

Update on the Dow. As predicted last week, a new low has come. Not only that, it overshot the 161.8% fibonacci extension.
A new resistance can be found at 7000.
Price could retrace from there and set up for a wave 5 and a deeper correction.


|

Filed Under: dowjones


10:28 AM
EURJPY update Feb 23, 2009

Ouch, got stopped out of the EURJPY.
The count might still be valid though, given following Elliott rule:

Wave E almost never stops at the trend line precisely, it either never reaches the trend line or it overshoots the trend line fast and temporarily. For now we need to wait to see if price falls back into the channel.


|

Filed Under: eurjpy


Newer Posts Older Posts Home
金币:
奖励:
热心:
注册时间:
2006-7-3

回复 使用道具 举报

 楼主| 发表于 2009-4-6 07:46 | 显示全部楼层
EURJPY Feb. 22, 2009

EurJPY seems to be trading in the latter stage of wave 4 of 5 of (5).
There is strong resistance at 120.00.
I am short with a stop at 121.00 1st target is 116.50, which is the bottom of the channel.
There is still a little room upward, a patient trader waits a little while to enter closer to the upper resistance line.


|

Filed Under: eurjpy


10:22 AM
EURUSD 4h chart update Feb. 21, 2009


[size=85%]Hello Traders,
[size=85%]
[size=85%]The price is going up, but we are not sure in which scenario we are in the big picture. The scenario where the price should go to at a minimum is the impulse down, where we are currently forming a wave 2. In that case a retreat to the 38.2% fibonacci is probable. We should reevaluate from there.
[size=85%]The price could then continue to the 61.8% fibonacci or even 100% to 1.4700, although not likely. If the price passes 1.4700 then we are in an impulse up, likely to form a new high higher then 1.6000. If the price drops to below 1.2300 we are likely in an impulse down. Critical phase but we should know where we are within the next couple of weeks. Meantime we keep our eye on the intraday Elliott wave developments.


|

Filed Under: eurusd, forex eur/usd elliott wave technical analysis


9:15 AM
EURUSD scenarios Feb 21, 2009

[size=85%]In my mind the following 3 scenarios are most probable.
[size=85%]It is with these scenarios in mind that I will be counting the waves.


|

Filed Under: eurusd


9:40 AM
EURUSD short term update


Well, it went up...and how!
My short term was obviously a little off, because the price was unable to reach the low which implies that we were in a wave 2, but longterm was right, and still is because we can expect more upside.
I am expecting a retrace into the shaded area, 50% or 61.8% fibonacci retrace, to complete a wave iv and more euro gain in the form of a wave v.
We are in a wave 3 of 3 and should be testing 1.30 by next week.
If the price in this setup drops below the stopline of 1.2650, this count is invalid.


|

Filed Under: eurusd


Newer Posts Older Posts Home
金币:
奖励:
热心:
注册时间:
2006-7-3

回复 使用道具 举报

 楼主| 发表于 2009-4-6 07:47 | 显示全部楼层
EURUSD Feb 20, 2009 short term

This is a short term count. In this count we are entering wave v down to retest the lows.


|

Filed Under: eurusd


5:51 PM
EURUSD Feb. 19, 2009 update


These are the 2 remaining counts left. Both suggest a temporary move up. Initial target is 1.3300.
After that we need to re-evaluate. It could go higher, but I am expecting either a wave 2 or a wave C. A wave 2 would not go as high and once we go down, a wave 2 would suggest a much lower eurusd, where a wave C could go flat and range between 1.25 and 1.47.


|

Filed Under: eurusd


5:00 AM
Cable update GBPUSD February 19, 2009

Still holding its textbook count. Going up...


|

Filed Under: gbpusd


4:50 AM
Dow Jones Elliott Waves February 19, 2009

Update on the dow.
In this count I expect more weakness.


|

Filed Under: dowjones


Newer Posts Older Posts Home
金币:
奖励:
热心:
注册时间:
2006-7-3

回复 使用道具 举报

 楼主| 发表于 2009-4-6 07:48 | 显示全部楼层
Cable (GBP/USD) February 18, 2009

A bit lower is still in the charts.


|

Filed Under: gbpusd


5:40 AM
EUR/USD February 18, 2009

Update on the double zigzag.


|


11:59 AM
eur/usd february 13, 2009 30m chart

Here is the bearish view for the EUR/USD.


|


11:22 AM
Cable update february 13, 2009 15m chart

Here is a nice setup. Textbook Elliott Waves really. Take advantage while you can.


|


Newer Posts Older Posts Home
金币:
奖励:
热心:
注册时间:
2006-7-3

回复 使用道具 举报

 楼主| 发表于 2009-4-6 07:52 | 显示全部楼层
GBP/USD February 11, 2009 4h chart

Here is the update for the cable (GBP/USD).


|


3:20 PM
EUR/JPY February 11, 2009 4h chart

Here an update of the EUR/JPY.


|


6:48 PM
EUR/USD February 10, 2009 update

The following triple zigzag is my preferred count. 3070 seems a very strong resistance.
A triangle is forming between 3070 and 2704. Triangles usually break in the direction of the trend.


|


7:39 AM
EUR/USD February 10, 2009

After the russian scare last night and the Presidential speech, the euro has recovered and the bullish count is still intact. This is a possible count, and if correct 1.3300 is the target (1.61 ext. of wave I). A drop below 2891 would eliminate this count.


|


Newer Posts Older Posts Home
金币:
奖励:
热心:
注册时间:
2006-7-3

回复 使用道具 举报

 楼主| 发表于 2009-4-6 07:52 | 显示全部楼层
President Obama Speech

Oh well, EuroDollar (EUR/USD) seems to be falling through the roof, the trendline is broken again and my C wave target has been hit at 1.2900.
But, it retraced 78.6% sofar, still okay for a wave 2, but over 100% (2746) retrace invalidates all bullish counts.


|


1:49 PM
Cable February 09, 2009 hourly

The cable hit the upper trendline at 1.5000 and has been pushing it for the duration of the day.
So far it is holding but a triangle is forming. If the trendline breaks more resistance can be found at the 161.8 fibonacci extension of wave a at 1.5108.
On the downside a wave B might form as deep as 1.4000.
I am sidelined on this pair for now until a clear top forms.


|


7:36 AM
EUR/USD February 9, 2009

Upper channel broken....
I am expecting a decline now, to retest the channel TL.

May go as deep at 1.2900, which will be the 50% retrace from 2747-3093.
Daily pivot is at 2887.


|


8:41 AM
USD/JPY February 7, 2009


Hi Traders,


[size=85%]Looking at the Yen count with Fibonacci relationships, we might see another run towards 93.00.
[size=85%]The 161.8 extension of wave 1 is at 93.00. Wait for the break above wave 3 (92.27) if you are not in the trade already.
[size=85%]Also, on a second chart, see how the Yen crossed a major trendline that has been holding the pair since August 2008, retested it and is now progressing upward.
[size=85%]


|


Newer Posts Older Posts Home
金币:
奖励:
热心:
注册时间:
2006-7-3

回复 使用道具 举报

 楼主| 发表于 2009-4-6 07:53 | 显示全部楼层
EUR/JPY Update February 7, 2009

Hi Traders,

Here an update on the EURJPY:

As I said last week, we are in an ABC correction pattern. The pair has shot through a minor resistance line which was forming a triangle and surged to the 1.2000 area.
I believe we will still get one attempt to break 1.2000 looking at the MACD there might be some more room upward. Looking at the wave count it looks like 1.2000 is the start of wave 4, which could potentially bring us down to 1.1650 the 61.8% retrace of wave 3.
We'll see how it plays out.


|


11:21 AM
EUR/USD and cable (GBP/USD) update February 6, 2009

Both pairs ran into resistance. I closed out my positions.
Waiting for the correctional move.


|


10:29 AM
Cable February 6, 2009

Cable is about to test an important trendline.
The cable went through the first trendline and is now to test another major resistance TL.
The MACD and RSI are at very high levels. I am expecting a correction soon.
For now, monitor.


|


6:41 AM
EUR/USD February 6, 2009

Just to show you that you can make good profits with little risk.

And as I am writing this,
金币:
奖励:
热心:
注册时间:
2006-7-3

回复 使用道具 举报

 楼主| 发表于 2009-4-6 07:53 | 显示全部楼层
Cable update February 5, 2009

Cable has some more room up but is likely to drop a bit again.


|


9:56 AM
EUR/USD February 5, 2009

As of now the wave down looks more like a 3 wave correction, and right now it looks more like a wave 2. The support at 2782 is the 76.8% retrace of wave I. I am still keeping in consideration the break of the TL at 2710, and a wave Y at 1.2500.


|


11:55 AM
eur/usd back to triple zigzag

The impulse 5 wave down is pretty much out.
This is my new count.


|


9:27 AM
EUR/USD wave 1 overlap February 03, 2009

Hmmmm, dilemma...
Wave 4 seems to have overlapped with wave 1 and therefore we need to look at an alternate count.

Prechter tells us that wave 4 in high volatile markets can sometimes overlap, but it is rare and then only in subminuette waves, which is not the case here.
So, relabel. Also, the MACD indicates that there is more room upwards. Sidelined for now as it seems we are in a small correction for now.


|


Newer Posts Older Posts Home
金币:
奖励:
热心:
注册时间:
2006-7-3

回复 使用道具 举报

 楼主| 发表于 2009-4-6 07:54 | 显示全部楼层
EURUSD Follow up February 03, 2009

There it was, the expected wave C.
Initial target of 1.3000 maybe the end of wave III. Remember, passing 1.3030 will invalidate this count as a wave 4 and would imply a longer term bullish move.


|


5:17 AM
EUR/USD February 03, 2009

This is my count. I am expecting a run in form of wave C to the 1.2900 area, which is the 38.2% fibonacci retrace.
It could possibly go higher but should not pass the 1.3030 area. In that case this count is invalid.


|


5:49 PM
EUR/AUD January 31, 2009

This one I picked of from poster Justy at Daily FX, but is in my view the most probable count as well.


|


5:48 PM
EURJPY January 31, 2009

This is my Eur/JPY count.


|


Newer Posts Older Posts Home
金币:
奖励:
热心:
注册时间:
2006-7-3

回复 使用道具 举报

 楼主| 发表于 2009-4-6 07:55 | 显示全部楼层
EUR/USD Probable Count January 31, 2009

This is the most probable count now price had touched 1.2765.


|


7:51 PM
EUR/USD Bearish Alternative January 30, 2009

[size=85%]This is the bearish alternative, which looks good as well. It will imply a wave 4 of smaller degree and a retest of 1.2765.
[size=85%]The top of wave 1 down is at 1.3035. If a wave 4 is forming it cannot go above 1.3035. If it goes above 1.3035, the bottom at 1.2777 was indeed a wave c of 2. If the price stays below 1.3035 and turns down to retest 1.2765 we are bearish again with an initial target at 1.2500.However, there is a catch. If we turn from 1.3035, we can still be in a wave 2 of 3 up, we need a break of 1.2765 to confirm a wave 5 down in order to be bearish.


|

Filed Under: forex eur/usd elliott wave technical analysis


7:36 PM
EUR/USD Elliott Wave Analysis January 30, 2009

This is my count on the 4 hour chart of the EUR/USD.
Today the GDP came out better than expected, but still the worst reading in over 25 years -3.8%.
What did the dollar do? It got a liitle stronger. However, the line in the sand, 1.2765 is still holding.
Wave 2, cannot retrace beyond the start of wave 1, says the Elliott rule book. If it does, then we need to relabel and the bearish target is 1.2500, short term.
The bullish target is at least 1.3500, with a stop below 1.2765, that is a really good risk reward trade.


|

Filed Under: eurusd


5:35 AM
EUR/USD Elliott Wave Analysis January 30, 2009

GDP day today. Big drop expected. Lets see how the market reacts.
[size=85%]For the bullish scenario, the price has to stay above 1.2765 . In that case we are counting this move as a wave 2 of a bullish move to at least 1.3500.
[size=85%]Wave 2 cannot retrace below the start of wave 1, which in this case I labeled as an ABC.
[size=85%]If price drops below 1.2765 we are bearish till 1.2500 and we need to relabel the charts.


|

Filed Under: eurusd


Newer Posts Older Posts Home
金币:
奖励:
热心:
注册时间:
2006-7-3

回复 使用道具 举报

 楼主| 发表于 2009-4-6 08:03 | 显示全部楼层
EUR/USD update january 29, 2009

We could still drop some more, 75-100 pips, and even retrace beyond bottom of 5, B waves, you never know. I will wait for the MACD to start coming up again.


Sidelined for now.


|

Filed Under: eurusd


9:28 AM
EUR/USD stopped out

I got stopped out of the eurodollar after moving my stops to 3085, at least limiting my losses.
The break of 1.3000 implies a new bearish move and could eventually go all the way to the bottom of the channel. Support lies at 1.2800.

The chart shows a possible wave count. There is still a chance that this move down is a 'b' wave of larger degree. For now I am sidelined.


|

Filed Under: eurusd


6:26 AM

Disclaimer:


The technical analysis is provided for informational purposes only. While based on information believed to be reliable, no guarantee is given that it is accurate or complete.
Elliott Wave analysis are seen as highly speculative and trading upon this analysis is at your own risk.


|

Filed Under: Disclaimer


Newer Posts Home
金币:
奖励:
热心:
注册时间:
2006-7-3

回复 使用道具 举报

 楼主| 发表于 2009-4-6 08:04 | 显示全部楼层
Forex Elliott Wave Analysis
Foreign currency exchange eur/usd usd/jpy gbp/jpy eur/jpy technical analysis elliott wave Forex Trading is highly speculative and can cause great financial losses. Elliott Wave trading is highly speculative, trading is a your own risk. Read the disclaimer on this site.

    Blog Archive
金币:
奖励:
热心:
注册时间:
2006-7-3

回复 使用道具 举报

 楼主| 发表于 2009-4-6 08:27 | 显示全部楼层
>>>>>MARKET GEOMETRY<<<<<


[size=100%]- Cup & Handle
WeekendChart, Eur-Usd 30 Minutes Chart
[size=100%]- Cup & Handle

[size=100%]- Expanding Channel BreakOut
[size=100%]- First C wave impulse might be ready soon, need to correct again after it&acute;s finished.
[size=100%]- C as main force seems to pinpoint approximately to the 50% area (1.4150)
[size=100%]- Fifth wave in here likely fills A wave of C, which would lead smaller B corrective, then C up again.
[size=100%]- 600 pips advance (added to the bottom at 1.3120) likely end
[size=100%]- Most Importantly, be aware that we might be very close to mark A wave with this last impulse.


Linkit t&auml;h&auml;n tekstiin


Merkinn&auml;t: Eur-Usd 30 Minutes Chart


EurUsd, DailyChart + 5 Minute Chart


Linkit t&auml;h&auml;n tekstiin


Merkinn&auml;t: DailyChart + 5 Minute Chart, EurUsd


29.3 - 30.3 - 2009, Weekend Charts, Individual Equites


Linkit t&auml;h&auml;n tekstiin


Merkinn&auml;t: 29.3 - 2009, Individual Equites, Weekend Charts


金币:
奖励:
热心:
注册时间:
2006-7-3

回复 使用道具 举报

您需要登录后才可以回帖 登录 | 立即注册

本版积分规则

本站声明:MACD仅提供交流平台,请交流人员遵守法律法规。
值班电话:18209240771   微信:35550268

举报|意见反馈|手机版|MACD俱乐部

GMT+8, 2025-7-28 00:44 , Processed in 0.060696 second(s), 9 queries , MemCached On.

Powered by Discuz! X3.4

© 2001-2017 Comsenz Inc.

快速回复 返回顶部 返回列表