搜索
楼主: hefeiddd

一个笨蛋的股指交易记录-------地狱级炒手

  [复制链接]
 楼主| 发表于 2009-4-5 21:18 | 显示全部楼层
Tuesday, February 3, 2009EurUsd Elliott Waves - 3 Feb
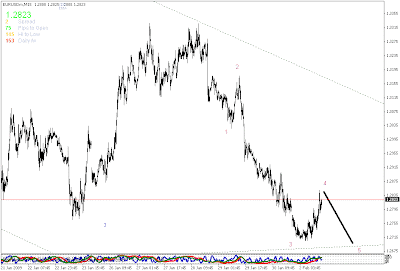

Posted by Blue Bottle at 12:36 AM 0 comments


Monday, February 2, 2009Elliott Wave Analysis GBP/JPY Chart - 2 Feb
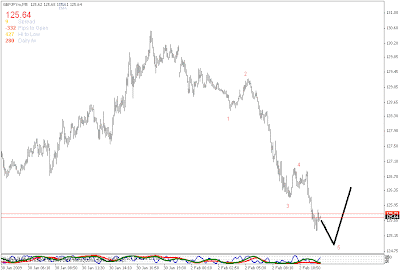

Posted by Blue Bottle at 8:55 PM 0 comments


Elliott Wave Books
[size=180%]Elliott Wave Principle: Applied to the Foreign Exchange Markets
By Robert Balan

"Over many years of experience, I have still to see a method that has consistently beaten the Elliott Wave Principle for its accuracy in the timing of market turns, which it does sometimes with mind-boggling accuracy", Robert Balan.

Links to the Book:


[size=180%]Dynamic Trading: Dynamic Concepts in Time, Price & Pattern Analysis with Practical Strategies for Traders & Investors
By Robert Miner

Clear approach to trading using fibonacci ratios, easy to put in practice, very big book well illustrated, some times a bit difficult, it will take you a few weeks to go through but it is worth the trip

Links to the Book:


[size=180%]Mastering Elliott Wave: Presenting the Neely Method
By Glenn Neely

This book is actually for those who want to "master" the Elliott wave theory. Though Mr Neeley explains his method from the scratch, you have to spend a great amount of time to understand how to identify the waves and how you should apply the rules and guidelines even if you know the theory. After long hours of studying the book and applying the techniques on the price charts, you will surprisingly find out that your view on the technical analysis and Elliott wave theory changed.

Links to the Book:


[size=180%]Elliott Wave Principle: Key to Market Behavior
By Robert Prechter

This is one of the best book to read and get a comprehensive understading on the Elliott Wave. This is for anyone trying to identify the Elliott Wave in any market or just interested in the technical analysis tools. Clear pics with easy to read style of writing.

Links to the Book

Posted by Blue Bottle at 8:23 PM 0 comments


Kiwi EW Analysis - 2 Feb
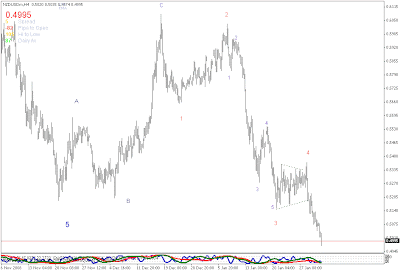


Posted by Blue Bottle at 7:36 PM 0 comments


GBP/USD Elliott Wave Analysis


I m interested to here your commants..


Posted by Alexandrine at 5:30 PM 0 comments


EW Books
[size=180%]Dynamic Trading: Dynamic Concepts in Time, Price & Pattern Analysis with Practical Strategies for Traders & Investors By Robert Miner

Clear approach to trading using Fibonacci ratios, easy to put in practice, very big book well illustrated, some times a bit difficult, it will take you a few weeks to go through but it is worth the trip

Links to the Book:

Posted by Blue Bottle at 4:00 PM 0 comments


EW Books
[size=180%]Elliott Wave Principle: Applied to the Foreign Exchange Markets By Robert Balan

"Over many years of experience, I have still to see a method that has consistently beaten the Elliott Wave Principle for its accuracy in the timing of market turns, which it does sometimes with mind-boggling accuracy", Robert Balan.

Links to the Book:


Posted by Blue Bottle at 3:55 PM 0 comments


EW Books
[size=180%]Mastering Elliott Wave: Presenting the Neely Method By Glenn Neely

This book is actually for those who want to "master" the Elliott wave theory. Though Mr Neeley explains his method from the scratch, you have to spend a great amount of time to understand how to identify the waves and how you should apply the rules and guidelines even if you know the theory. After long hours of studying the book and applying the techniques on the price charts, you will surprisingly find out that your view on the technical analysis and Elliott wave theory changed. "A large portion of market technicians spend their time trying to manipulate price data to find that "magical" key-indicator. How can a transformation of price data be better than the original data?" says Mr Neeley. If you're in the search of the "magical" key indicator(s), this book is not for you, since there's not even a word about the technical indicators, but when you finish studying the book, you will see that you don't need to look for an indicator.
Since Fibonacci numbers and golden ratio are the most important parts of the wave theory, you have to know how to apply them on the charts. This book is the best one I've ever read about how to apply Fibonacci techniques on a price chart. Not only the price distance, but the time elapsed to form the waves are dependant with the Fibonacci numbers and this book teaches you how to use them.
Author also defines clearly how to apply the Rule of Alternation, Rule of equality and Rule of Complexity. Further you read, you learn how to analyse complex wave structures and what to expect when the waves are advancing to form larger waves.
I have to warn those who want to learn some trading techniques using the Elliott Theory or Neeley Method, since there's nothing in this book about trading, but do not forget that this book is mastering the the Elliott Wave. Do you think you still need a pre-made trading technique after mastering the theory? I don't think so. Reviewed By Tuncer Sengoz "tuncers" at Amazon.com


Links to the Book:


Posted by Blue Bottle at 3:44 PM 0 comments


EW Books
[size=180%]Elliott Wave Principle: Key to Market Behavior By Robert Prechter

This is one of the best book to read and get a comprehensive understading on the Elliott Wave. This is for anyone trying to identify the Elliott Wave in any market or just interested in the technical analysis tools. Clear pics with easy to read style of writing.

Links to the Book

Posted by Blue Bottle at 3:30 PM 1 comments


UsdChf H4 Chart - 2 Feb
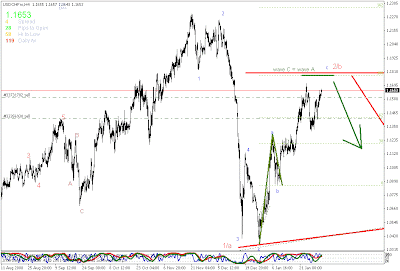

Posted by Blue Bottle at 1:12 PM 0 comments


Newer Posts Older Posts Home
金币:
奖励:
热心:
注册时间:
2006-7-3

回复 使用道具 举报

 楼主| 发表于 2009-4-5 21:20 | 显示全部楼层
Sunday, February 1, 2009UsdCad Possible Triangle - 1 Feb


Posted by Blue Bottle at 10:39 PM 0 comments


Saturday, January 31, 2009Cable Chart - 31 Jan


Posted by Blue Bottle at 4:47 PM 0 comments


Cable Wave 5 in Ending Diagonal?
Hi All,

Since wave 1 of 5 became valid, so i came up with Ending diagonal as wave 5.. So wave 1 is confirmed nicely as Zigzag & wave 2 is in progress..


Posted by Blue Bottle at 4:38 PM 0 comments


GbpUsd Elliott Wave Analysis - 31 Jan
Hi all,

Below count is became invalid after wave 4 overlapped in the range of wave 1.


Posted by Blue Bottle at 4:29 PM 0 comments


Friday, January 30, 2009UsdChf Hourly Chart - 30 Jan


Posted by Blue Bottle at 11:00 PM 0 comments


EurUsd Hourly Chart - 30 Jan


Posted by Blue Bottle at 10:54 PM 0 comments


EurUsd 4Hours Chart - 30 Jan
Last wave down before it shoot up..


Posted by Blue Bottle at 6:17 AM 0 comments


EurChf H4 Chart - 30 Jan


Posted by Blue Bottle at 5:49 AM 0 comments


Thursday, January 29, 2009Triangle in EurGbp?
Hi all,

There is possibility for triangle formation in EurGbp.


Posted by Blue Bottle at 8:17 PM 0 comments


UsdCad Elliott Wave Analysis H4 Chart - 29 Jan


Posted by Blue Bottle at 8:14 PM 0 comments


Newer Posts Older Posts Home
金币:
奖励:
热心:
注册时间:
2006-7-3

回复 使用道具 举报

 楼主| 发表于 2009-4-5 21:21 | 显示全部楼层
Wednesday, January 28, 2009UsdChf Hourly Chart - INVALID 30 Jan


Posted by Blue Bottle at 9:14 PM 0 comments


GbpUsd M30 Chart


Posted by Blue Bottle at 8:42 PM 0 comments


GbpJpy Chart - 28 Jan


Posted by Blue Bottle at 8:16 PM 0 comments


UsdChf Elliott Wave Analysis Hourly Chart - 28 Jan


Posted by Blue Bottle at 1:08 PM 0 comments


Tuesday, January 27, 2009Elliott Wave Analysis Kiwi H1 - 27 Jan
Hi all,

And here also one possible count for Kiwi, where 5 subwaves down are completed in wC.


Posted by Blue Bottle at 11:34 PM 0 comments


GbpUsd M15 Chart - 27 Jan
Hi All,

Cable has finally finished its subwave C up 1.4240, making the end of wave 4 up too.


Posted by Blue Bottle at 11:17 PM 0 comments


Euro setting up for a short trade
EurUSD has rebounded from lows and looks like its forming the corrective 4th wave. Graph would tell you more. Take a look -


1.3380 to 1.3450 looks a good level to go short. Hourly candles have formed a gravestone doji. can keep a s/l above it. Daily graph is looking strong though. Short trades should be swift to cut above 1.35.

Posted by Sahil Kapoor at 10:08 PM 2 comments


Cable chart


Posted by Blue Bottle at 1:49 PM 0 comments


Monday, January 26, 2009
I am not going to post any chart today. This is more of a commentary on what is going to happen in the US Stock market going forward and its impact on the US Dollar. Now i am not going to convince every body that market has bottomed out, the angels are falling from sky to help investors and the Obama is the superman for a nation in debt. Certainly, nothing has changed since Nov 2008. I believe that market is waiting for another leg down. This time, however, its going to be slow and steady downward trend. I see the DJI level of 8000 as medium term bottom/support. The next leg down should cover another 1000 point of DJI. That is expected to happen when the earnings season is fully over, oil drops again to US $ 35 levels, and Obama administration fails to attract Congress.

Now, on FX, as this forum is focused on Forex moves/charts. I am forecasting a one sided view here and not being Technical for a while. Fundamentals suggest that US dollar will be the superhero for the next 6 months as i see Euro to dive to 1.20 or below, GBP down @ 1.20-1.25, CAD 1.35.

This is based on the following. US has already lowered interested rates to near zero. Other are going to follow that soon. By Dec 09, ALL G7 will have zero percent Interest rates. By that time, i believe that the US will start increasing to tighten inflation issues.

The risk aversion continues to dominate.

Euro and GBP loses their charm as safe deposit Assets. I have a feeling if a European nation goes bust, may be the fate of Euro is in doubt and then a dive to parity may be.

More comments to follow soon.

If you like or even dislike, please do comment.

email :
azafar78@gmail.com


Cheers, happy trading


Posted by Addy at 2:06 AM 3 comments


Saturday, January 24, 2009UsdCad Hourly Chart - 24 Jan


Posted by Blue Bottle at 7:31 PM 1 comments


Newer Posts Older Posts Home
金币:
奖励:
热心:
注册时间:
2006-7-3

回复 使用道具 举报

 楼主| 发表于 2009-4-5 21:23 | 显示全部楼层
Friday, January 23, 2009Crude Oil Wave Count
Since crude oil gave a breakdown below the expected tip of primary wave 1 the wave structure has changed dramatically. Long term price damage to crude oil prices is extensive and can lead lower prices over the next few years. Take a look at the current 'altered' wave count for crude oil -


We are now in the first leg down for crude oil. The current move is the wave 'A' of the ABC decline. The lower degree wave 4 ended at level of $25. So it is possible that crude oil prices might decline to this levels before the next bull run emerges. The short term for oil price is looking much more promising. In the wave 'A' we have already formed the wave 3 low and are possibly in wave 4. Take a look -


In the very short term crude oil may reach the expected target of $55 if it is able to cross $46 on a daily close. $38 should serve as a strong support.

For previous posts and analysis see this link - http://www.sahilkaps.blogspot.com/

Posted by Sahil Kapoor at 10:03 PM 3 comments


EurUsd H4 Chart - 23 Jan
Hi all,

my other possibilities for EurUsd, count down move as corrective waves.

Im looking for bottom to go LONG..


Posted by Blue Bottle at 5:03 PM 0 comments


UsdChf Weekly Chart - 23 Jan
Hi all,

I am looking for triangle wave B.


Posted by Blue Bottle at 4:57 PM 0 comments


GbpJpy Daily Chart - 23 Jan
Hi Fijun,

Here is my GbpJpy chart..


Posted by Blue Bottle at 8:04 AM 0 comments


NzdUsd Hourly Chart - 23 Jan


Posted by Blue Bottle at 7:59 AM 0 comments


Thursday, January 22, 2009Cable Yesterday Chart - Update
Here is the updated for yesterday chart. It went well with our wave counts.


Below are the charts posted yesterday. For wave 5 target.


Posted by Blue Bottle at 4:41 PM 0 comments


UsdJpy Daily Chart - At 13 Years Low


Posted by Blue Bottle at 4:10 PM 0 comments


Cable M15 Chart - 22 Jan


Posted by Blue Bottle at 3:34 PM 0 comments


UsdChf H4 Chart - 22 Jan


Posted by Blue Bottle at 7:51 AM 0 comments


UsdChf 30Mins Chart - 22 Jan


Posted by Blue Bottle at 7:49 AM 0 comments


Newer Posts Older Posts Home
金币:
奖励:
热心:
注册时间:
2006-7-3

回复 使用道具 举报

 楼主| 发表于 2009-4-5 21:24 | 显示全部楼层
Wednesday, January 21, 2009Elliott Wave Analysis for GbpUsd


Posted by Blue Bottle at 4:13 PM 0 comments


GbpJpy Monthly Chart - 21 Jan


Posted by Blue Bottle at 1:36 PM 0 comments


GbpUsd Daily Chart - 21 Jan
Hi Pian,

Here is the GbpUsd Chart. Pls feedback.


Posted by Blue Bottle at 12:47 PM 0 comments


How Does Elliott Wave Analysis Work?
Elliott wave analysis is based upon the Elliott Wave Principle, which states that
investor psychology
is the
real
engine behind the stock markets. More>>


Posted by Blue Bottle at 12:30 PM 0 comments


How Can I Apply the Elliott Wave Principle?
When investors first discover the Elliott Wave Principle, they’re often most impressed by its ability to predict where a market will head next. More>>

Posted by Blue Bottle at 12:25 PM 0 comments


Where Did the Wave Theory Come From?
Ralph Nelson Elliott is the father of the Wave Theory, which is commonly called and more accurately described as the
Elliott Wave Principle. Born on July 28, 1871 in Marysville, Kansas, Elliott reached his ultimate achievement late in life by a circuitous route. More>>


Posted by Blue Bottle at 12:21 PM 0 comments


What is the Elliott Wave Principle?
The Elliott Wave Principle is a detailed description of how groups of people behave. It reveals that mass psychology swings from pessimism to optimism and back in a natural sequence, creating specific and measurable patterns. More>>

Posted by Blue Bottle at 12:16 PM 0 comments


Elliott waves - UsdJpy Hourly Chart - 21Jan


Posted by Blue Bottle at 11:59 AM 0 comments


Tuesday, January 20, 2009End of an Empire-Citi Bank Chart

Folks, here you go with Citi bank. Monthly Chart from 1995.

Just wanted to show you what can happen to the world's biggest bank. Strange times, isn;t it.


Posted by Addy at 9:09 PM 0 comments


EURUSD coming under pressure

Hi Guys,


Finally EURUSD went off the key level. 1.3000.


As per my LT view, which was shown in the last EURUSD post, the pair had to break in any one direction. Finally it has done that.


If anyone had shorted as per my earlier chart : @1.3110, he/she is already in Profit. The pair is down almost 2oo pips since morning.


Again , see this chart. Now ST view.


I am being specific now. Sell Short again. But remain in the area. (the yellow highlighted one) . If it breaches upwards, be careful and exit.


happy trading.


Posted by Addy at 8:43 PM 1 comments


Newer Posts Older Posts Home
金币:
奖励:
热心:
注册时间:
2006-7-3

回复 使用道具 举报

 楼主| 发表于 2009-4-5 21:26 | 显示全部楼层
Tuesday, January 20, 2009EurGbp Hourly Chart - UPDATE
Hi all,

Here is the chart is the update of 19 Jan Hourly chart. Had set the target of 0.9210 and it has been reached.

Below is the 19 Jan Chart


Posted by Blue Bottle at 6:43 PM 0 comments


AudUsd Hourly - 20 Jan


Posted by Blue Bottle at 4:36 PM 0 comments


UsdCad 30 Mins Chart - 20 Jan
Hi all,

Correction w B is near to end, so gonna have opportunity to go SHORT.


Posted by Blue Bottle at 9:45 AM 0 comments


EurUsd Hourly Chart - 20 Jan


Posted by Blue Bottle at 9:41 AM 0 comments


UsdChf Reversed Count - 20 Jan

Hi all,

I have reversed my count for UsdChf. New see chart for new count..


Posted by Blue Bottle at 9:35 AM 0 comments


EurChf Hourly Chart - 20 Jan
hi all,

Attached is the Eur/Chf Chart. 5waves impluse waves are formed already, now it moving in corrections ZigZag, Flat or Triangle.


Posted by Blue Bottle at 9:23 AM 0 comments


Monday, January 19, 2009EurUsd Chart
Stay Put and watch the Blue and Red lines. There is ample chance in Eur/Usd to break away in one direction in late Jan 2009


Posted by Addy at 2:19 PM 1 comments


Elliott Waves - NzdUsd 4 Hours - 19 Jan


Posted by Blue Bottle at 9:25 AM 0 comments


5waves - NzdUsd Hourly Chart - 19 Jan


Posted by Blue Bottle at 9:23 AM 0 comments


EurUsd Hourly Chart - 19 Jan

hi all,

Looking for SHORT trade once it complete w4.

Posted by Blue Bottle at 9:17 AM 0 comments


Newer Posts Older Posts Home
金币:
奖励:
热心:
注册时间:
2006-7-3

回复 使用道具 举报

 楼主| 发表于 2009-4-5 21:27 | 显示全部楼层
Monday, January 19, 20095waves - EurGbp Hourly Chart - 19 Jan


Posted by Blue Bottle at 8:44 AM 0 comments


EurGbp 15 Mins Chart - 19 Jan


Posted by Blue Bottle at 8:39 AM 0 comments


Saturday, January 17, 2009UsdCad Hourly Chart - 17 Jan

Im attaching another updated Usd/Cad chart.


Posted by Blue Bottle at 12:29 PM 0 comments


Friday, January 16, 2009Kiwi 4 Hours Chart - 16 Jan


Posted by Blue Bottle at 1:45 PM 0 comments


NzdUsd Hourly Chart update - 16 Jan


Posted by Blue Bottle at 1:43 PM 0 comments


GbpJpy 30Mins Chart - 16 Jan


Posted by Blue Bottle at 12:36 PM 0 comments


Thursday, January 15, 2009EurGbp
Hi BB,
I think retracement from 0.98 to 0.88 is wave A, since its a impulse wave so should not be wave 4. Now its moving in wave B.

Am i making valid point here, BB?

Regards,
Alexandrine.


Posted by Alexandrine at 4:07 PM 0 comments


UsdCad 15 Mins UPDATE - 15 Jan


Posted by Blue Bottle at 10:22 AM 0 comments


Wednesday, January 14, 2009EurGbp Elliott Wave Analysis 4 Hours Chart - 14 Jan


Posted by Blue Bottle at 5:33 PM 0 comments


30Mins Chart for Eur Gbp - 14 Jan


Posted by Blue Bottle at 5:23 PM 0 comments


Newer Posts Older Posts Home
金币:
奖励:
热心:
注册时间:
2006-7-3

回复 使用道具 举报

 楼主| 发表于 2009-4-6 06:05 | 显示全部楼层
Wednesday, January 14, 2009Elliott Waves UsdJpy 4 Hours


Posted by Blue Bottle at 3:13 PM 0 comments


Kiwi Hourly - 14 Jan


Posted by Blue Bottle at 3:11 PM 0 comments


5waves - AudUsd Hourly Chart - 14 Jan


Posted by Blue Bottle at 10:24 AM 0 comments


EurGbp 1mins Chart - UPDATE


Posted by Blue Bottle at 10:21 AM 0 comments


Tuesday, January 13, 2009Elliott Waves Cable 4 Hours Chart - Alternative view


here is my alternative view for Cable.

Posted by Blue Bottle at 11:24 PM 0 comments


UsdCad 15 Mins - 13 Jan


Posted by Blue Bottle at 11:17 PM 0 comments


UsdCad 4 Hours Chart - 11 Jan - UPDATE - 13 Jan


Posted by Blue Bottle at 11:09 PM 0 comments


EurGbp 1mins Chart - 13 Jan

Sorry for so small timeframe chart.

Posted by Blue Bottle at 11:04 PM 0 comments


Cable Hourly Chart - 13 Jan


Posted by Blue Bottle at 10:56 PM 0 comments


UsdChf 15Mins Chart - 14 Jan


Posted by Blue Bottle at 8:22 AM 0 comments


Newer Posts Older Posts Home
金币:
奖励:
热心:
注册时间:
2006-7-3

回复 使用道具 举报

 楼主| 发表于 2009-4-6 06:06 | 显示全部楼层
Tuesday, January 13, 2009EurChf 30Mins Update - 13 Jan

This is update of my previous chart. Triangle formed nicely.

Posted by Blue Bottle at 8:17 AM 0 comments


Monday, January 12, 2009USDJPY Elliott Wave Analysis - 4hours chart - 12 Jan


Hi all,

I have recounted usdjpy chart with latest update.. What you guys think?

Posted by Blue Bottle at 5:41 PM 0 comments


Cable 4Hours Chart.. - 12 Jan


Posted by Blue Bottle at 5:20 PM 0 comments


EurChf 15Mins - Triangle is forming


Posted by Blue Bottle at 1:11 PM 0 comments


GbpJpy 30mins Chart - 9 Jan - UPDATE
Hi all,

Below is the update for my last week GBPJPY 30mins chart.. I had shorted for wC and now in 200 pips in green, gonna close it soon.. Happy trading..


Posted by Blue Bottle at 10:58 AM 1 comments


UsdChf 15Mins Chart - 12 Jan - INVALID
INVALID now.


Posted by Blue Bottle at 10:37 AM 0 comments


Cable Daily Chart


Posted by Blue Bottle at 12:59 AM 0 comments


UsdCad 4 Hours Chart - 11 Jan
hi all,

I have recounted w4 as triangle now.

Posted by Blue Bottle at 12:54 AM 0 comments


Friday, January 9, 2009NzdUsd Daily Chart - 9 Jan


Posted by Blue Bottle at 9:02 PM 0 comments


GbpJpy 30mins Chart - 9 Jan


Posted by Blue Bottle at 8:54 PM 0 comments


Newer Posts Older Posts Home
金币:
奖励:
热心:
注册时间:
2006-7-3

回复 使用道具 举报

 楼主| 发表于 2009-4-6 06:07 | 显示全部楼层
Friday, January 9, 2009UsdCad 5mins Chart


Posted by Blue Bottle at 8:25 PM 1 comments


Thursday, January 8, 2009GbpJpy Daily Chart - 8 Jan


Posted by Blue Bottle at 10:28 PM 1 comments


Tuesday, January 6, 2009EurChf H1 Chart - 6 Jan


Posted by Blue Bottle at 12:36 PM 0 comments


Reversed EurGbp Analysis - 6 Jan


Posted by Blue Bottle at 9:57 AM 0 comments


Elliott Wave Analysis for EurChf 4Hours - 6 Jan
I have reversed my counts.

Posted by Blue Bottle at 9:45 AM 0 comments


Monday, January 5, 2009Elliott Wave Analysis for EurChf 1 mins


Posted by Blue Bottle at 6:26 PM 0 comments


UsdCad 1min Chart - UPDATE

Hi all,

my target for wC has been reached in no time. Took 50pips profit. Trading around small timeframe for fun & kill time.

Posted by Blue Bottle at 6:21 PM 0 comments


UsdCad 1min Chart
Below is my Elliott Wave analysis for 1mins UsdCad pair..

Last few days see less/no movement in this pair :(
So only got 1 min chart..

Posted by Blue Bottle at 6:04 PM 0 comments


Sunday, January 4, 2009UsdJpy Hourly Chart - 4 Jan


Posted by Blue Bottle at 2:53 PM 0 comments


USDJPY 4hours chart


Im expecting this pair to go up until 93.00 before falling down to bottom. Wish you all Happy New Year 2009..
Happy Trading..


Posted by Blue Bottle at 2:49 PM 0 comments


Newer Posts Older Posts Home
金币:
奖励:
热心:
注册时间:
2006-7-3

回复 使用道具 举报

 楼主| 发表于 2009-4-6 06:08 | 显示全部楼层
Sunday, January 4, 2009Cable Daily Chart - 4 Jan


Posted by Blue Bottle at 1:47 PM 0 comments


Thursday, January 1, 2009EurChf 4Hours Chart - 1 Jan


Posted by Blue Bottle at 6:27 AM 0 comments


Wednesday, December 31, 2008EurGbp Hourly Chart - 31 Dec


Posted by Blue Bottle at 8:14 PM 0 comments


UsdChf 4Hours Chart with 2 possibilities


Posted by Blue Bottle at 4:56 PM 0 comments


Tuesday, December 30, 2008EurUsd 5M Chart Update
Hi all,

See below chart for EurUsd update.

Posted by Blue Bottle at 7:04 PM 0 comments


EurUsd 30mins Chart


Posted by Blue Bottle at 6:23 AM 0 comments


EurUsd 5mins Chart


Posted by Blue Bottle at 6:20 AM 0 comments


Sunday, December 28, 2008UsdJpy, looks good for SHORT
hi all,

this pair looks good to me for SHORT..

Posted by Blue Bottle at 11:43 PM 0 comments


Cable 30mins Chart


Posted by Blue Bottle at 3:12 PM 3 comments


Thursday, December 25, 2008EurGbp Hourly Chart

Hi all, i think it will go 1 more wave high as wave 5 before we see big reversal.


Posted by Blue Bottle at 6:17 PM 0 comments


Newer Posts Older Posts Home
金币:
奖励:
热心:
注册时间:
2006-7-3

回复 使用道具 举报

 楼主| 发表于 2009-4-6 06:08 | 显示全部楼层
Wednesday, December 24, 2008NzdUsd Daily Chart


Posted by Blue Bottle at 8:41 PM 0 comments


UsdJpy Monthly Chart
hi all,

Posting this chart for reference purpose..

Source: Fxdaily Forum From User : Brad_1199


Posted by Alexandrine at 2:51 AM 0 comments


UsdJpy 4Hours Chart


Posted by Blue Bottle at 2:44 AM 0 comments


Tuesday, December 23, 2008EurChf 30M Chart


Posted by Alexandrine at 5:44 PM 0 comments


EurUsd Daily Chart
Hi All,
I expect EurUsd processing as wave C. Good place to SHORT


Posted by Alexandrine at 3:48 PM 0 comments


EurUsd 4H chart with 2 possibilities
hi all,

Found 2 possibilities for eurusd pair. Wave C may form as abc or 12345waves, both possible right now.  Gonna wait and see how it forms..


Posted by Alexandrine at 12:20 PM 1 comments


UsdCad 4H chart


Posted by Alexandrine at 12:14 PM 0 comments


UsdCad Daily Chart
Hi all,

UsdCad chart.


Posted by Alexandrine at 12:04 PM 0 comments


Monday, December 22, 2008EurUsd Monthly Chart

Source: http://vault.bz/


Posted by Alexandrine at 7:00 AM 0 comments


GbpJpy Montly Chart


Posted by Alexandrine at 5:13 AM 0 comments


Newer Posts Older Posts Home
金币:
奖励:
热心:
注册时间:
2006-7-3

回复 使用道具 举报

 楼主| 发表于 2009-4-6 06:09 | 显示全部楼层
Monday, December 22, 2008UsdJpy Monthly Chart
Hi all,

Below is the montly chart of UsdJpy. Wave 4 was completed as trigangle and wave 5 is in progress.

Source: www.fxdaily.com

Posted by Alexandrine at 4:42 AM 0 comments


Friday, December 19, 2008Update of early EurUsd chart..
Target reached...

200pips in Green and still counting..:)


Posted by Alexandrine at 5:05 PM 0 comments


Recounted AusUsd Daily chart..


Posted by Alexandrine at 5:02 PM 0 comments


EurUsd Weekly chart..


Posted by Alexandrine at 4:06 PM 0 comments


UsdChf Monthly Chart..


Posted by Alexandrine at 4:04 PM 0 comments


EurChf chart Hourly


Posted by Alexandrine at 3:37 PM 0 comments


5mins EurUsd chart
Good setup for short position..


Posted by Alexandrine at 3:02 PM 0 comments


Thursday, December 18, 2008EurUsd chart
here u go richard..


Posted by Alexandrine at 5:12 PM 0 comments


UsdJpy Monthly Chartt
Hi all,

my monthly chart for UsdJpy..


Posted by Alexandrine at 5:10 PM 0 comments


AudUsd chart


Posted by Alexandrine at 4:49 PM 0 comments


Newer Posts Older Posts Home
金币:
奖励:
热心:
注册时间:
2006-7-3

回复 使用道具 举报

 楼主| 发表于 2009-4-6 06:15 | 显示全部楼层
Tuesday, December 16, 2008EurGbp Daily Chart
Hi all,

My EurGbp Daily chart..


Posted by Alexandrine at 11:36 PM 0 comments


5waves
The Home of Elliott Wave Analysis

Posted by Alexandrine at 7:33 PM 0 comments


UsdChf Daily Chart
Hi all,

My UsdChf daily chart..


Posted by Alexandrine at 6:36 PM 0 comments


EurChf 4Hours Chart


My EurChf chart in 4 Hours time frame..

Posted by Alexandrine at 5:41 PM 0 comments


Newer Posts Home
金币:
奖励:
热心:
注册时间:
2006-7-3

回复 使用道具 举报

 楼主| 发表于 2009-4-6 06:19 | 显示全部楼层
5Waves - The Home Of Elliott Wave Analysis
-----------------------------------------------------------------------------------------------------


Categories

Contributors
金币:
奖励:
热心:
注册时间:
2006-7-3

回复 使用道具 举报

 楼主| 发表于 2009-4-6 06:33 | 显示全部楼层
EW Tutorials1. Elliott Wave Intl. Tutorials
2. Elliott-wave-theory.com
3. ElliottWaveSignals.com
4. Wikipedia.com


EW Books
Elliott Wave Principle: Key to Market Behavior by Robert Prechter

Elliott Wave Principle: Applied to the Foreign Exchange Markets by Robert Balan

Dynamic Trading: Dynamic Concepts in Time, Price & Pattern Analysis with Practical Strategies for Traders & Investors By Robert Miner

Mastering Elliott Wave: Presenting the Neely Method by Glenn Neely


EW NEWS
Elliott Wave

Commodities: Supply & Demand Vs. Elliott Wave Patterns
Elliott Wave
, USA
- 2009 年 4 月 01 日
- 2009 年 4 月 01 日
By Vadim Pokhlebkin This is my latest interview with Jeffrey Kennedy, editor of Elliott Wave International's Futures Junctures Service, which brings you ...
剪切自 Google - 4/2009


Using Elliott Wave to Enhance ETF Returns
Trading Markets (press release)
, USA
- 2009 年 4 月 02 日
- 2009 年 4 月 02 日
Using Elliott Wave analysis and looking at the daily chart of the S&P 500, we see that the primary downtrend ended with the lows of March 9, which was the ...
剪切自 Google - 4/2009


Robert Pretcher Silver and Gold Forecast
The Market Oracle
, UK
- 2009 年 4 月 03 日
- 2009 年 4 月 03 日
Yet Bob alerted subscribers to an approaching top in the March 14, 2008 Elliott Wave Theorist . "The wave count [in silver] is nearly satisfied, though ...
剪切自 Google - 4/2009


Elliott Wave Similarities Between 1938 And 2008
istockAnalyst.com (press release)
, USA
- 2009 年 4 月 02 日
- 2009 年 4 月 02 日
Let’s take a special look now at the Elliott Wave structure as more price bars have developed since that report and the structure is still as eerily similar ...
剪切自 Google - 4/2009


金币:
奖励:
热心:
注册时间:
2006-7-3

回复 使用道具 举报

 楼主| 发表于 2009-4-6 07:34 | 显示全部楼层
Forex Elliott Wave Analysis
Foreign currency exchange eur/usd usd/jpy gbp/jpy eur/jpy technical analysis elliott wave Forex Trading is highly speculative and can cause great financial losses. Elliott Wave trading is highly speculative, trading is a your own risk. Read the disclaimer on this site.


eur/usd march 29, 2009 4h

A double top could be in place, we won't know for sure until we reach the top of wave I (3063). Right now the price is inbetween the 61.8 linear retrace and the 38.2 fibo channel. In theory we could drop a little more but as soon as there is interferance with wave I we need to label this move as a wave 2 and that would mean that we are now in a 3 of 3.
Technically speaking, in that case, we are forming a bear flag right now.
RSI is still very bearish and MACD is flatning but still open.


|


4:49 AM
GBPUSD March 28, 2009

For those of you who have been following the ultra bullish count of the cable, here is an alternative view.
In the ultra bullish count it is expected that the cable will go higher to as much as 1.6000. This is the "perfect" ABC correction view where wave C extends 1.618% of wave A.

This could be true, however, looking at wave A you can count 3 waves. When wave A is 3 waves and wave B is also 3 waves (as it usually is) then we might be looking at a 3-3-5 flat correction.
If that is the case, then we have seen the top already at 1.4780 and are heading to the bottom of the channel.

Also, when looking closer, we can see a head and shoulder pattern might be forming, usually the sign of a reversal.

Happy trading!


|


11:09 AM
Yet another view of the eurodollar
This would mean we will be testing 1.24 again real soon...

http://forexforums.dailyfx.com/attachments/elliott-wave/27075d1238064149-elliott-wave-trading-discussion-eur0-3-16-2009-1.jpg
http://forexforums.dailyfx.com/attachments/elliott-wave/27076d1238064171-elliott-wave-trading-discussion-eur0-3-26-2009-1.jpg


|

Filed Under: forex eur/usd elliott wave technical analysis


7:24 AM
EURUSD daily

[size=85%]The daily chart is indicating that we hit a reversal.
The RSI on the daily chart is indicating a reversal. MACD is about to cross over. If indeed this is an impulse move down, we might see the dollar getting a lot stronger over the next few weeks.


|

Filed Under: eurusd


Older Posts
金币:
奖励:
热心:
注册时间:
2006-7-3

回复 使用道具 举报

 楼主| 发表于 2009-4-6 07:36 | 显示全部楼层
Dow Jones March 27, 2009

Are we in a recovery?
If you look at my earlier Dow posts, we still have ways to go.
This chart I borrowed from a forum, Poster Justy (dailyfx.com), a very good elliotician, sees it the same as I do.
We might see 10.000 even a little higher but about 50% retrace (10,250), before we go down again. And it will be deep.


|

Filed Under: gbpusd


5:07 AM
GBPUSD March 27, 2009

Here is a probability...


|

Filed Under: gbpusd


5:06 AM
EURUSD update Match 27, 2009 30m

Update from the trade of yesterday. Target has been reached. Trade is over.


|

Filed Under: forex eur/usd elliott wave technical analysis


7:25 AM
EUR/USD Trading Probability

Here is a probability. I went short at the indicated price.
See how it works out. To manage the trade I keep moving the stops, so when it goes wrong, I don't lose to much.


|

Filed Under: forex eur/usd elliott wave technical analysis


Newer Posts Older Posts Home
金币:
奖励:
热心:
注册时间:
2006-7-3

回复 使用道具 举报

 楼主| 发表于 2009-4-6 07:36 | 显示全部楼层
EUR?USD March 25, 2009

[size=85%]Looks like a clearer picture is developing. More downtrend to be expected before we will go higher.
[size=85%]We should be close to an intraday base. Pivot is at 3530 today and I am expecting choppy trading.
[size=85%]Buy the dips and ride the bull. We really need a break of 1.3000 to be bearish again.


|

Filed Under: eurusd


7:03 AM
eurusd March 24, 2009

[size=85%]I am going long if 3517 holds as support.
[size=85%]The rally down looks like a 3:3:5 flat correction.


|

Filed Under: eurusd


11:57 AM
eurusd update 15m

[size=85%]Had to relabel after retrace stalled after 3 waves.
[size=85%]We might be looking at a flat correction.


|

Filed Under: eurusd


8:28 AM
EURUSD short term, March 23, 2009

[size=85%]Short term.


|

Filed Under: eurusd


Newer Posts Older Posts Home
金币:
奖励:
热心:
注册时间:
2006-7-3

回复 使用道具 举报

 楼主| 发表于 2009-4-6 07:39 | 显示全部楼层
GBPUSD March 23, 2009 4h

[size=85%]I think we have started a downtrend. Possibly a wave 4 of larger degree. The MACD is crossed.


|

Filed Under: gbpusd


10:17 AM
EUR/USD March 20, 2009 4h

[size=85%]The MACD is closed on the 4h chart. That means we are about to complete a wave A. There will be a run to 1.37 again in the form of a wave B.
[size=85%]Then a deeper correction is expected. Maybe even to 3241.
[size=85%]I labelled the wave ending at 3737 as a wave 5, but it could actually also be wave 5 of 3. If that is the case we should see another run to 1.3800 after this correction. The dollar index chart supports this theory.


|

Filed Under: eurusd


9:59 AM
eurusd big picture update

Here a view from above. This sometimes helps to see where we are going. Cluster resistance is at 1.3800 area.


|

Filed Under: eurusd


7:02 AM
GBPUSD March 19, 2009

[size=85%]4h chart is showing signs of reversal in the candle stick. EW count indicates the same. MACD is still open.
[size=85%]Like to see a cross down before trading down for wave 4.


|

Filed Under: gbpusd


Newer Posts Older Posts Home
金币:
奖励:
热心:
注册时间:
2006-7-3

回复 使用道具 举报

您需要登录后才可以回帖 登录 | 立即注册

本版积分规则

本站声明:MACD仅提供交流平台,请交流人员遵守法律法规。
值班电话:18209240771   微信:35550268

举报|意见反馈|手机版|MACD俱乐部

GMT+8, 2025-7-28 04:13 , Processed in 0.071297 second(s), 9 queries , MemCached On.

Powered by Discuz! X3.4

© 2001-2017 Comsenz Inc.

快速回复 返回顶部 返回列表