搜索
楼主: hefeiddd

一个笨蛋的股指交易记录-------地狱级炒手

  [复制链接]
 楼主| 发表于 2009-4-5 20:48 | 显示全部楼层
Elliott Wave Analysis - GBP/USD H4 Chart


Posted by Blue Bottle at 2:43 PM 0 comments


Monday, March 30, 2009China calls for new global currency system
China has called for a reform of the current global currency system which now relies on the US dollar for international payments. Officials from the International Monetary Fund and developing countries have welcomed the suggestion. Yuan Xiaoyuan takes a closer look into the question of a new currency that's creating quite a stir. More>>

Posted by Blue Bottle at 11:26 PM 0 comments


5Waves - GBP/JPY M30 Chart


Posted by Blue Bottle at 11:12 PM 0 comments


Nzd/Jpy Weekly & H4 Chart


Posted by Blue Bottle at 3:21 PM 0 comments


Sunday, March 29, 2009Another USD/JPY Chart


Posted by Blue Bottle at 11:06 PM 0 comments


5waves - GBP/JPY Daily Chart


Posted by Blue Bottle at 11:05 PM 0 comments


Newer Posts Older Posts Home
金币:
奖励:
热心:
注册时间:
2006-7-3

回复 使用道具 举报

 楼主| 发表于 2009-4-5 20:49 | 显示全部楼层
Saturday, March 28, 2009USD/JPY Other possibility
Hi Tim,

Hers is my other possible USD/JPY chart. If this is the case then it will go up until/around 103. In my early chart with i posted here, took wave 5 as truncated mainly because of Usd/Yen correlation factor with Chf/Jpy and Nzd/Jpy pairs. It mayn't the case, lets see what gonna happen.


Posted by Blue Bottle at 4:35 PM 0 comments


Elliott Wave Analysis NZD/USD Weekly
Hey Guys,

Here is my Nzd/Usd chart. I guess this pair gonna lower for wave 5.


Posted by Blue Bottle at 3:52 PM 0 comments


AUD/JPY Weekly
Hello,

Here is my Aud/Jpy weekly chart with Elliott Wave Counts. I'm not sure how many of you trading this pair, me too seldom look at this pair, but this setup looks well for bearish move.


Posted by Blue Bottle at 3:48 PM 0 comments


Elliott Wave Analysis - USD/JPY Montly
Hello There,

Its Monthly Elliott Wave Analysis for USD/JPY pair. We are in the wave 5..


Posted by Blue Bottle at 3:42 PM 0 comments
金币:
奖励:
热心:
注册时间:
2006-7-3

回复 使用道具 举报

 楼主| 发表于 2009-4-5 20:50 | 显示全部楼层
EW Analysis - USD/CAD Montly


Posted by Blue Bottle at 3:41 PM 0 comments


Elliott Wave Analysis - GBP/JPY MONTHLY


Posted by Blue Bottle at 3:40 PM 0 comments


EUR/USD Monthly


Posted by Blue Bottle at 3:39 PM 0 comments


Cable Monthly
We are near the end of march, so here is the updated GBP/USD Montly Chart.


Posted by Blue Bottle at 3:38 PM 0 comments


GBPJPY M15


Posted by Blue Bottle at 12:39 AM 0 comments


USDJPY H4


Posted by Blue Bottle at 12:38 AM 0 comments


Newer Posts Older Posts Home
金币:
奖励:
热心:
注册时间:
2006-7-3

回复 使用道具 举报

 楼主| 发表于 2009-4-5 20:51 | 显示全部楼层
Saturday, March 28, 2009USDJPY M15


Posted by Blue Bottle at 12:37 AM 0 comments


Thursday, March 26, 2009AUDUSD update
Updated chart

Original Chart posted here on Feb 6, 2009


Posted by Blue Bottle at 11:35 AM 0 comments


EURCHF H4


Posted by Blue Bottle at 11:29 AM 0 comments


USDCAD Update
Hi all,

Here is the initial chart that posted here on March 2.

Below is the updated chart captured today.


Posted by Blue Bottle at 10:34 AM 0 comments


Elliott Wave Analysis - EURCHF H1


Posted by Blue Bottle at 9:39 AM 0 comments


USDCAD 4Hours
Hi all,

My UsdCad Chart, its near completing triangle. Wave E will end near 1.21 range.

Posted by Blue Bottle at 9:35 AM 0 comments


Wednesday, March 25, 2009GBPUSD
Hi all,

Here is the alternate view for cable,
Found this count in forum which was posted by Justy.


Here is

Posted by Blue Bottle at 6:08 PM 0 comments


NZDUSD Hourly


Posted by Blue Bottle at 5:56 PM 0 comments


AudUsd


Posted by Blue Bottle at 8:00 AM 0 comments


Tuesday, March 24, 2009AUDUSD Daily


Posted by Blue Bottle at 7:24 PM 0 comments


Newer Posts Older Posts Home
金币:
奖励:
热心:
注册时间:
2006-7-3

回复 使用道具 举报

 楼主| 发表于 2009-4-5 20:52 | 显示全部楼层
Tuesday, March 24, 2009USDJPY


Posted by Blue Bottle at 7:22 PM 0 comments


Euro Wave Count
Euro is poised to decline from current levels. The following two graphs are self explanatory. 1.43 is the resistance to risk, rewards could be much larger, possible 1.16 euro levels.

Euro Long term wave count -


Short term -


Posted by Sahil Kapoor at 2:06 PM 1 comments


Monday, March 23, 2009Elliott Wave Count on Gold


Gold prices have done nothing in the last six months. Gold is one of the few asset class which has not declined in price compared to massive decline in other asset classes. From being a long term bull in gold and maintaining the view that gold prices are headed to $1200 over a period of time, I have become cautious of the rising bearishness in the underlying gold market. I have expressed this opinion in my intermarket articles which called for a top in gold when it touched $1000 few weeks back. See this link

The continuous flow of funds to ETFs has been taken as a big positive for gold's bullish case. I don't share that view. The mass investments always don't do good in terms of returns. Gold price in terms of Asian currencies have been very strong and especially in terms of INR. Gold priced in INR terms has made higher highs continuously and still looks like it is forming a consolidation inside a flag. The INR depreciation has played a pivotal role in the current rise in gold prices in India.

My last elliott wave count involved the probability that gold was forming an ending diagonal in the double zig zag final upleg 'c'. However that proved dead wrong as gold first declined nearly $80 and then gave a strong upward rally negating the formation.

I am revising my long term wave count in gold. Primarily I think gold is still in the wave four forming the second leg of a ABC-X-ABC double zig-zag pattern. Take a look -


The current move in gold being the intermediate corrective wave can rise disproportionately. The wave structure in gold prices is quite complex and the fall should happen in simple ABC correction once the intermediate 'x' completes.

The view that gold prices might break to new highs before declining comes from the fact that prices have again broken out of consolidation. A giant broadening formation has been successfully tested in gold which gives an expected target price of around $1210. See the graph below -


The short term wave count looks like we have entered the wave 'c' in the double zig-zag abc wave. Take a look -


Gold has been viewed as safe haven and it has risen quite well relative to the financial sector in the US. The S&P Bank index relative performance to the S&P 500 has been quite useful in understanding the short term strength in the risk aversion sentiment. S&PBank Index/S&P500 has been moving inversely to gold prices since the crisis began and shows how market is pricing in the risk sentiment in two different markets.


The financial media and other market participants are focusing attention on making a bullish case for gold. When markets price in deflation expectation, gold prices are 'expected' to rise due to risk aversion and in inflationary expectation buildup it is the inflation hedge that makes gold attractive. However, gold prices have done very little to make that case for itself.

Gold prices stand at $950 at present and a blow-off rally can actually take place if investors run wild in buying all the gold they can. This might happen if gold pushes to new highs, but a large upmove sustaining its head for long looks less probable. From where the market stands, it looks an attractive counter to go short if it breaches $880 again. That would in time lead to the biggest sell-off that the current crisis has unfolded. Meanwhile, let the price resolve out of this trading band

Sahil Kapoor

Posted by Sahil Kapoor at 8:11 PM 0 comments


EurUsd Hourly


Posted by Blue Bottle at 12:03 AM 0 comments


Sunday, March 22, 2009GbpUsd Hourly


Posted by Blue Bottle at 11:58 PM 0 comments


UsdChf Hourly


Posted by Blue Bottle at 11:52 PM 0 comments


EurChf Hourly


Posted by Blue Bottle at 11:49 PM 0 comments


EurGbp


Posted by Blue Bottle at 11:44 PM 0 comments


Saturday, March 21, 2009USDCAD HOURLY


Posted by Blue Bottle at 5:11 PM 0 comments


Thursday, March 19, 2009EURCHF H1


Posted by Blue Bottle at 3:53 PM 0 comments


Newer Posts Older Posts Home
金币:
奖励:
热心:
注册时间:
2006-7-3

回复 使用道具 举报

 楼主| 发表于 2009-4-5 20:53 | 显示全部楼层
Thursday, March 19, 2009AUD/USD Hourly


Posted by Blue Bottle at 3:49 PM 0 comments


GBPUSD m15


Posted by Blue Bottle at 2:49 PM 0 comments


GBPUSD H1 Chart.


Posted by Blue Bottle at 2:43 PM 0 comments


USDJPY 4Hours
Hi Tim,

Here is the usdjpy chart.. Have redraw my chart to wave 4 trinagle.


Posted by Blue Bottle at 2:26 PM 0 comments


AUD/USD 5Mins Chart


Posted by Blue Bottle at 8:21 AM 0 comments


Monday, March 16, 2009Cable Alternative View


Posted by Blue Bottle at 5:16 PM 0 comments


UsdChf


Posted by Blue Bottle at 3:14 PM 0 comments


Aud/Usd M15 & M30 Chart


Posted by Blue Bottle at 3:08 PM 0 comments


Sunday, March 15, 2009Usd/Cad


Posted by Blue Bottle at 9:54 PM 0 comments


AudUsd M15


Posted by Blue Bottle at 9:52 PM 0 comments


Newer Posts Older Posts Home
金币:
奖励:
热心:
注册时间:
2006-7-3

回复 使用道具 举报

 楼主| 发表于 2009-4-5 20:54 | 显示全部楼层
Sunday, March 15, 2009AudUsd Possible Triangle?


Posted by Blue Bottle at 9:46 PM 0 comments


Cable Daily Chart
Expecting BULL movement for wave C..


Posted by Blue Bottle at 9:15 PM 0 comments


Friday, March 13, 2009Usd/Chf H1


Posted by Blue Bottle at 1:19 PM 0 comments


Thursday, March 12, 2009Eurusd


Posted by Blue Bottle at 5:28 PM 0 comments


USDCHF 5Mins


Posted by Blue Bottle at 5:01 PM 0 comments


USDJPY 4Hours Chart - 12March


Posted by Blue Bottle at 12:50 PM 0 comments


Wednesday, March 11, 2009UsdChf


Posted by Blue Bottle at 10:05 PM 0 comments


USDJPY


Posted by Blue Bottle at 7:09 PM 0 comments


EurGbp Hourly


Posted by Blue Bottle at 3:31 PM 0 comments


EurChf M30
Hi all,

I am expecting 1 more leg down as wave C..


Posted by Blue Bottle at 8:48 AM 0 comments


Newer Posts Older Posts Home
金币:
奖励:
热心:
注册时间:
2006-7-3

回复 使用道具 举报

 楼主| 发表于 2009-4-5 20:56 | 显示全部楼层
Wednesday, March 11, 2009EurUsd

This EurUsd getting complicated now.. Anyway its my possible count right now


Posted by Blue Bottle at 8:32 AM 0 comments


Cable - Update

HI all,

Here is the updated cable chart.. Looks like bottom is in place now.


Posted by Blue Bottle at 8:21 AM 0 comments


Tuesday, March 10, 2009AudUsd


Posted by Blue Bottle at 11:57 AM 0 comments


Cable

Something is still pushing cable down, anyway looking for retrace once it complete wave C(black & blue color count).

Below is hourly chart.


Posted by Blue Bottle at 8:54 AM 0 comments


USDCHF 5Mins


Posted by Blue Bottle at 1:12 AM 0 comments


Monday, March 9, 2009EurChf M30


Posted by Blue Bottle at 2:32 PM 0 comments


UsdJpy Alternate Count
Possible triangle in wave 4.. By this count, this pair TOP is still NOT in place..


Posted by Blue Bottle at 2:14 PM 0 comments


Cable M5


Posted by Blue Bottle at 10:03 AM 0 comments


Saturday, March 7, 2009GbpUsd H1
Hi Piano,

here is the cable chart..


Posted by Blue Bottle at 6:25 AM 0 comments


Friday, March 6, 2009EurUsd Revised
Hi all,

Revised green colour counts, from 12345 impulse to corrective abc waves.


Posted by Blue Bottle at 9:55 PM 0 comments


Newer Posts Older Posts Home
金币:
奖励:
热心:
注册时间:
2006-7-3

回复 使用道具 举报

 楼主| 发表于 2009-4-5 20:57 | 显示全部楼层
Friday, March 6, 2009UsdChf M15


Posted by Blue Bottle at 9:36 PM 1 comments


EURCHF 5Mins
Hi Fijon,

Here is the 5mins chart..


Posted by Blue Bottle at 9:10 PM 0 comments


EurChf Daily


Posted by Blue Bottle at 9:09 PM 0 comments


Usd/Jpy Top In Place?


Posted by Blue Bottle at 5:13 AM 0 comments


Thursday, March 5, 2009Gbp/Jpy Daily
Hi all,

Here is my daily chart of GBP/JPY pair. Wave 4 of impulse 12345 is almost near the ending stage, once it complete we gonna go deep down side.


Posted by Blue Bottle at 10:32 PM 0 comments


Usd/Cad Short?
The perfect impulse and correction waves are formed in this Canada pair nicely.


Posted by Blue Bottle at 10:25 PM 0 comments


Gbp/Usd UP Trend?


Posted by Blue Bottle at 9:45 PM 0 comments


EurChf - Update
Hi all,

Here is updated chart of EURCHF. It formed 5waves impulse nicely and retraced with abc waves.


Posted by Blue Bottle at 8:21 AM 0 comments


Wednesday, March 4, 2009Eur/Chf


Posted by Blue Bottle at 7:04 PM 0 comments


USD CAD 5Mins Chart - Update


Posted by Blue Bottle at 3:34 PM 0 comments


Newer Posts Older Posts Home
金币:
奖励:
热心:
注册时间:
2006-7-3

回复 使用道具 举报

 楼主| 发表于 2009-4-5 20:58 | 显示全部楼层
Wednesday, March 4, 2009Usd/Jpy H4 Chart


Posted by Blue Bottle at 3:28 PM 0 comments


USD/CAD M5


Posted by Blue Bottle at 10:02 AM 0 comments


Tuesday, March 3, 2009GBPUSD Daily Chart - 3March


Posted by Blue Bottle at 9:21 PM 1 comments


USDCAD Triangle


Posted by Blue Bottle at 8:35 PM 0 comments


Intermarket Analysis
The US and other western markets are already down substantially from November lows. S&P 500 has fallen steeply and looks set to make new lows today. The Giant double top formation in S&P 500 on a monthly graph doesn’t augur well for stocks in the long term unless it trades above 850 for months.

As USD index edges up through the level of 89 there is strong wave of selling in various markets. Most of the stock market around the world has traded deep in the red today. As mentioned in the last article that gold forms its tops in the first quarter of a year, it is beginning to look that gold might actually be forming a short term top.

To come to a conclusion on any one market thorough different market signals we would need confirmation. The ‘safe haven’ bid which has been in the headlines for most part of the last six months is waning. The USD has risen in spite of a fall in the US bonds and a fall in the safe haven gold. If USD keeps its head above 89.25 on a closing basis this week, we would see a rather strong leg down in all the asset classes in the world other than bonds.

For this to happen we would need evidence that inflationary expectation is weak and is getting worse.

Take a look at the ratio of CRB commodity index to the US 30 yr bond prices.


In the previous market correction of 2000, this ratio declined to 1.4823 which is the low for the last 50 years. A rising ratio indicates the relative strength of commodity prices to bond yields. A rising ratio indicates a rise in inflation and is generally a leading indicator of inflation. Using this as a proxy for inflation expectation, there is little reason to expect that deflationary threat is waning.


Commodity prices generally lead CPI changes by a very small margin


This indicates that commodity prices can continue to remain soft for time to come and bonds are expected to do relatively well over the next few quarters. If we go back in history, the deflationary expectations usually run for 6 to 8 years. Since the fall in commodity prices is very steep we can see bouts of recovery and some volatility in the above ratio.


If the inflation expectation is very weak and markets are still factoring in strong deflationary trend then the underlying strength in the precious metal markets is nothing but a psychological euphoric buying for ‘safety’. As and when market participants start to see value in other asset classes such as equities, there would be a flight out of precious metals to equities.

In the last two articles I have repeatedly mentioned that US stocks might form a cyclical bottom in the next two to three months (may be as early as end of March). This would trigger a strong leg down for gold.

Meanwhile, the downward strength in the US markets is still unabated. Equities continue to remain a ‘sell’ unless the trend reverses i.e. the trend remains down unless proven otherwise.

Currency Markets

USD Index


USD index has broken to the upside. 89.25 is the level to watch for this week’s close. This would lead to USD index testing levels of 93 and 95 in the short term. It is important to mention here that USD is in a long term bear market and this multi year correction rally would take a lot of time to run its course.

EUR, JPY, GBP and all Asian currencies are trading lower against the USD for the last few weeks are the trend is now accelerating in some currency markets. USD index remains bullish on a short to medium term basis and will continue to remain a huge negative for Asian equity markets. Especially for a country like ours which has a huge energy import bill.

US stock market


US stocks are falling without any respite and the last few downticks have been on large volumes. This means that market remains poised to test further lows before starting to recover.

S&P 500 index would see a very strong support at 685 and 640 levels. It would be adventurous to add here that 640 – 685 might be a cyclical low for S&P 500 for a subsequent rally to 800 levels.


US Bond markets

US 30 yr Govt Bond


The US 30 yr Govt bond has broken down from the given levels in the last article. This strengthens the view that bonds made a top in December 2008. US bonds remain bearish in the short term and its long term picture is now starting to change.


Commodity Market

CRB index


Commodity prices have been rather sideways in the last few weeks. There was a strong rebound in the energy prices which led to a recovery last week. Commodity prices remain in a strong bear trend.

As mentioned in the previous updates and other view, S&P bank index is now outperforming the S&P 500. This is a telling sign that we are nearing some important support levels in US stock market.


The Amex Broker’s index has also held up relatively well and shows that market bottom signals are now emerging in the US markets.


The major theme emerging from this market scenario is that deflation threat is still strong but US bonds have started to indicate that markets are beginning to factor in some economic growth. However this has not been reflected into the commodity markets. In the short term, continue to look for weakness in the US equity markets and major commodity markets. S&P 500 would face strong support at 685 and then at 640.

Asian equity markets might break lower due to a stronger USD. Indian markets might face strong selling pressure due to intense INR weakness.

Posted by Sahil Kapoor at 1:30 AM 0 comments


Monday, March 2, 2009USD/CAD Daily


Posted by Blue Bottle at 9:00 AM 2 comments


EURUSD Daily


Posted by Blue Bottle at 9:00 AM 0 comments


GBPJPY 5Mins


Posted by Blue Bottle at 8:59 AM 0 comments


EURCHF Daily - 2 Mar


Posted by Blue Bottle at 8:49 AM 0 comments


USDCHF H4 Chart - 2 March 09


Posted by Blue Bottle at 8:46 AM 0 comments


Newer Posts Older Posts Home
金币:
奖励:
热心:
注册时间:
2006-7-3

回复 使用道具 举报

 楼主| 发表于 2009-4-5 20:59 | 显示全部楼层
Friday, February 27, 2009GBPJPY M15


Posted by Blue Bottle at 8:03 PM 0 comments


GBPJPY Bearish Count


Posted by Blue Bottle at 4:23 AM 0 comments


Eur Usd M5 Updata


Posted by Blue Bottle at 4:13 AM 0 comments


Thursday, February 26, 2009Eur Chf 5Mins Update
Original Chart posted this morning.

Updated Chart..


Posted by Blue Bottle at 8:49 PM 0 comments


EurUsd M5


Posted by Blue Bottle at 8:11 PM 0 comments


EURCHF M5

e

Posted by Blue Bottle at 5:59 AM 0 comments


USD/SGD


Posted by Blue Bottle at 5:07 AM 0 comments


Eur Usd H4 Chart


Posted by Blue Bottle at 5:04 AM 0 comments


USDCHF 30Mins Chart - 26Feb


Posted by Blue Bottle at 4:52 AM 0 comments


Wednesday, February 25, 2009EURCHF 5Mins - Update


Posted by Blue Bottle at 8:02 PM 0 comments


Newer Posts Older Posts Home
金币:
奖励:
热心:
注册时间:
2006-7-3

回复 使用道具 举报

 楼主| 发表于 2009-4-5 21:01 | 显示全部楼层
Wednesday, February 25, 2009Eur/Gbp H1 Chart


Posted by Blue Bottle at 7:33 PM 0 comments


Usd/Jpy M5 Chart - UPDATE
Attached is the USDJPY M5 original and updated chart..


Posted by Blue Bottle at 7:26 PM 0 comments


EURCHF M15 Chart


Posted by Blue Bottle at 6:18 PM 0 comments


UsdChf 5Mins


Posted by Blue Bottle at 6:04 PM 0 comments


Usd/Jpy M5 Chart


Posted by Blue Bottle at 5:54 PM 0 comments


AUD/USD M5


Posted by Blue Bottle at 8:23 AM 0 comments


USDSGD Hourly Chart
I am not sure how many guys trading this pair, but since i live in Singapore i love this pair. Here is the chart..


Posted by Blue Bottle at 7:42 AM 0 comments


USD/JPY weekly
Today we have finally seen the push of wave 4 into the price territory of wave 1, which is the minimum requirement for an ending diagonal . Wave 4 is taking the shape of an elongated flat. Expect a final wave 5 drop below 80.


Posted by monchhichi at 5:57 AM 0 comments


USD/CAD M5 UPDATE


Posted by Blue Bottle at 4:29 AM 0 comments


EURCHF 5Mins


Posted by Blue Bottle at 4:16 AM 0 comments


Newer Posts Older Posts Home
金币:
奖励:
热心:
注册时间:
2006-7-3

回复 使用道具 举报

 楼主| 发表于 2009-4-5 21:02 | 显示全部楼层
Wednesday, February 25, 2009USD CAD 5Mins Chart


Posted by Blue Bottle at 1:14 AM 0 comments


AUD/USD Daily


Posted by Blue Bottle at 1:10 AM 0 comments


Tuesday, February 24, 2009Intermarket Analysis
The last one week has been eventful for the western equity markets. In the last article it was mentioned that there are four major trends emerging.

Long term US bonds have formed a top in the last quarter of the calendar year 2008. Commodity market are now in a major bear market which will last for many years including sharp bear markets upside rallies. USD will continue to strengthen, not on risk aversion though. Equity markets may bottom out by H209.

The equity markets declined sharply in the western world and have made new lows. Emerging markets have remained quite resilient and are far from their lows made in November 2008. Accelerating deterioration in the world banking industry may lead all markets lower in the very short term. Intermarket analysis shows that the current downtrend in equity markets is decelerating but is not reflected in the equity market averages. Momentum studies are oversold but the trend remains to the downside. Equity markets remain a sell as the trend remains down, unless proven otherwise. But caution should be exercised as diverging signals are emerging from bond markets and currency markets.

Gold prices have performed quite strongly in comparison to all other asset classes. Gold has continued to move up even with USD holding onto its strength.

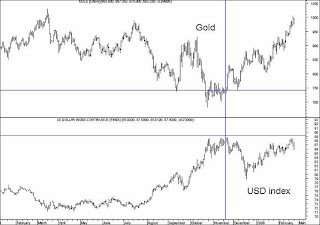
Risk aversion sentiment has worked well in favour of gold prices. The USD has seen lot of inflows as it is the least unattractive of the collection of ugly sisters that populate the world’s major currency markets. Gold has a tendency to give trend reversal in the first quarter of a calendar year. This is quite evident from major market bottoms and top that has been formed over the years. The only thing that can work in favour of gold prices now is the continued selling in world equity markets and deteriorating condition of the world currency markets. Taking a cue from the strength in gold prices it can be inferred that market sentiment in equity markets has touched lows which have not been seen in the last ten years.


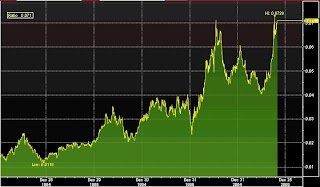
Dow Jones:Gold (Dow Gold Ratio)


Equity markets rally in 1999 made Dow Jones most expensive as priced in gold terms. Currently this ratio is off 3 points from its long term average of 10. This means equity prices are getting cheaper in real money terms. This also means as and when stock prices make a cyclical bottom a lot of money will flow out of gold and into equity markets. The first quarter is just the time that it can happen as bullish sentiment in gold scales new peaks and bearish sentiment in stocks makes new troughs.

Now for this to happen, an early indication can be seen from a rebound in banking stocks. If the markets are to rebound, the financials should bottom out first. This would lead to a return to relatively risky securities and lead the gold prices down. This would also mean the USD will strengthen further as faith in the currency markets return to normal.

Continuing with the assumption that US 30 yr govt bonds have started pricing in some growth expectation, US equity markets can well give a sharp upmove after the current selling is over. However there is little evidence of any price reversal in major market averages in the US other than some oversold readings. Some important indicators to be analyzed are the relative performance of market majors.

Johnson and Johnson (JNJ) to S&P 500 ratio


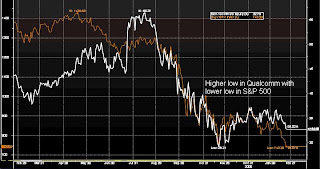
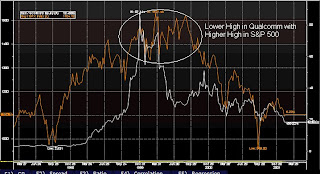
Clearly JNJ to SPX ratio made a high of 0.070 in the bear market of 2000s. The high of this ratio coincided with the bear market low with a lag of 2 months. The stock market did decline by 40% in that bear market and moved up to make new highs. Although the current bear market is much larger in economic deterioration, still the averages would always kick in on a relative basis. There are other sectoral ratios which have gone beyond all previous bear market lows. One such ratio is the relative performance of tech stocks like Qualcomm. In the bull market the major tech stocks like Qualcomm were the first one to make a lower high before the big break came.

2009 bear market non-confirmation


2000 Bull market non-confirmation


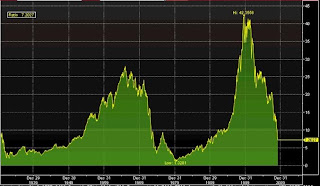
http://www.federalreserve.gov/releases/cp/

The current stats from the Federal Reserve show very little activity in the CP market for Financials. Only Non financial with investment rating of the highest quality has seen some takers. This is in contrast to the rebound seen for financial CP markets ahead to the Dow Jones rally to 9000. The credit market for financial and sub investment securities is still inactive and this is clearly weighing on the market sentiment.

Commodity markets have remained relatively flat in the last one week. Industrial metals have seen a lot of selling along with a fall in the agricultural commodities. Grain markets have seen lot of price erosion and are still looking weak. Commodity index looks set to fall further and make new lows.


30 Year US bonds are consolidating and can continue its downtrend on a break below 125. The activity in the bond market is suggesting that a reversal in stock market is imminent. Equity markets have a tendency to lag by two quarters on an average. This gives us and idea that equity prices in US may find a cyclical bottom in the next few months.


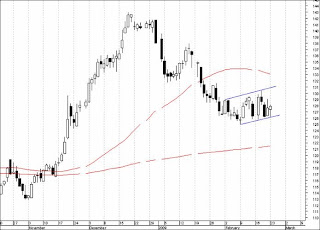
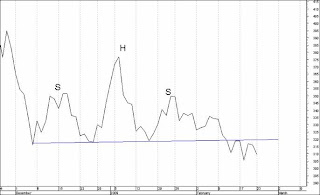
Triangle breakdown in S&P 500 has seen rapid price erosion. Though momentum indicators are quite oversold, there is no indication of a reversal and the trend remains ‘down’ unless proven otherwise.


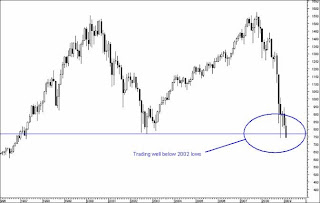
S&P 500 is now trading well below 2002 lows. A giant double top is also forming which shows weakness for equity prices in the long term is it trades below this level for another quarter.

USD index looks strong. Though there has been some short term correction, the trend still remains up. The pivot trend reversal remains 84 for the USD index.

In the current scenario, continue to look for weakness in equity markets across the world. Short term caution is warranted as divergences in market averages are reaching extreme levels. It is important to note that we have conclusively entered the last leg down of the current bear market in emerging market equities and the last leg down for cyclical bottom for western market equities.

Commodity prices will continue to weaken with agricultural prices leading the way down along with industrial metals.

USD looks strong. USD/JPY will give a strong upmove on a daily close above 95. Look for 102 to be tested as market has formed a cyclical bottom.

US 30 Year bond looks set to fall further on a daily close below 125.

Posted by Sahil Kapoor at 11:03 PM 1 comments


USD/CHF


Posted by Blue Bottle at 7:59 PM 0 comments


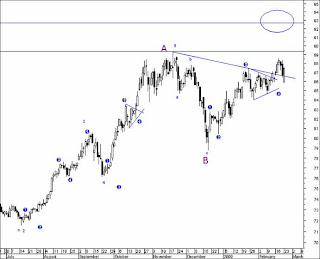
Monday, February 23, 2009GBP/USD HOURLY CHART
HI all,

Cable Hourly...

Yellow color ABC correction is almost near ending stage, think. And this ABC is near the 61.8% fibo of 5 impulse waves..

Wave C from 1.4095 can be subdivided into abc, and sub wave C is equal to 162% of sub wave A.


Posted by Blue Bottle at 8:39 PM 0 comments


USDCHF 5Mins - Update


Posted by Blue Bottle at 7:23 PM 0 comments


Sunday, February 22, 2009EUR/CHF H4 - 22Feb


Posted by Blue Bottle at 11:54 PM 0 comments


USD CAD Weekly - 22Feb


Posted by Blue Bottle at 11:32 PM 0 comments


GBP JPY MONTHLY - 22Feb


Posted by Blue Bottle at 11:28 PM 0 comments


GBP/USD Monthly - 22Feb


Posted by Blue Bottle at 11:27 PM 0 comments


Newer Posts Older Posts Home
金币:
奖励:
热心:
注册时间:
2006-7-3

回复 使用道具 举报

 楼主| 发表于 2009-4-5 21:03 | 显示全部楼层
Sunday, February 22, 2009USDJPY MONTHLY - 22Feb


Posted by Blue Bottle at 11:20 PM 0 comments


GBPJPY Bearish Chart - 22Feb


Posted by Blue Bottle at 11:14 PM 0 comments


USDCHF 5Mins


Posted by Blue Bottle at 11:02 PM 0 comments


Saturday, February 21, 2009EurUsd Chart by Raimund


Posted by Blue Bottle at 7:36 AM 0 comments


EurGbp Chart by Raimund
For EURGBP I`m looking for a major top. At the moment I favor a leading diagonal:

Thanks to Raimund for the chart..

Posted by Blue Bottle at 7:32 AM 0 comments


Friday, February 20, 2009USDJPY


Posted by Blue Bottle at 4:56 PM 0 comments


EUR/USD M30


Posted by Blue Bottle at 7:59 AM 1 comments


The Dow Fall Begins.....


For all those of my critics who were saying that risk aversion is over and the economic indicators are getting positive, please see the chart above and the Dow Close for Feb 19th 2009. I had posted and recommended that DOW must close down 7500 level. This now brings us a more thrilling question. What is next? For Bulls, save your guns, as i think the bounce might come, But not now. I fear, though i don;t want, another leg down and in a massive way. Like 200-300 Points decline in a day, so we come near or at 7000 DJI level. That will finally pull out new bulls and harras bears.
Anyways, i will write more over the weekend, with more interesting charts.
Cheeers.....If you can :)


Posted by Addy at 5:24 AM 0 comments


Thursday, February 19, 2009Aud USD other possibilities


Posted by Blue Bottle at 6:25 PM 0 comments


Cable


Posted by Blue Bottle at 6:20 PM 0 comments


Newer Posts Older Posts Home
金币:
奖励:
热心:
注册时间:
2006-7-3

回复 使用道具 举报

 楼主| 发表于 2009-4-5 21:04 | 显示全部楼层
Thursday, February 19, 2009AUD USD Daily


Posted by Blue Bottle at 6:09 PM 0 comments


USDCHF


Posted by Blue Bottle at 8:28 AM 0 comments


GbpJpy - Update


Posted by Blue Bottle at 8:00 AM 0 comments


Wednesday, February 18, 2009AUD USD HOURLY


Posted by Blue Bottle at 5:01 PM 0 comments


EURCHF DAILY


Posted by Blue Bottle at 4:41 PM 0 comments


USDCHF Monthly


Posted by Blue Bottle at 4:20 PM 0 comments


USDCHF


Posted by Blue Bottle at 4:18 PM 0 comments


EUR GBP H4
Hi all,

There is strong support line at 0.8550 range and i guess that should be the end of wave C.


Posted by Blue Bottle at 2:03 PM 0 comments


Tuesday, February 17, 2009Intermarket Analysis
This is the first article of a series that will be presented on intermarket relationship.

In the last 4 months the US stock market has held its range of Dow Jones 7800 – 9200. Present report shows that we may be very near to a break away from this range. The intermarket analysis generally relies on the following markets correlations.

To summarize the correlations -

Stocks and bond prices are positively correlated, bond prices (note: bond prices and not bond yields are mentioned here) lead stocks in both bear and bull markets.
Bond prices and commodity prices are negatively correlated; commodities lead bond prices by a small margin.
USD is inversely correlated to commodities; its leading characteristics have not been very strong.
A rising USD is good for US stocks, but not essentially for other markets like emerging markets in general (domestic currency strength is actually good for other markets barring few exceptions like China).

US Bonds have rallied strongly along with a fall in stock averages. This is not congruent with the intermarket analysis which says bonds should follow stocks. However the missing piece of puzzle is the previously held disinflation expectation and the deflation expectation. The four important markets have given a clear signal that strong deflationary expectation was built into the system. This is clear in hindsight as US bonds rallied along with the USD as a safe haven of last resort and commodity prices declined at a record pace.

In the current market scenario the US Bonds have started their descent which looks quite strong. My basic assumption now is that the US Bonds formed a top in December 2008 and has started a bear trend. This would be confirmed once the US Bonds Futures (USH9 Bloomberg ticker) trades below the 200 DMA on a sustained basis.

Taking the assumption forward that the US bonds have peaked we can come to the conclusion that the deflation expectation in the markets have reduced and the current USD strength is not based on a safe haven bid. Now put historical market developments into the picture.

L.A. Times article dated March 30, 2000, “The red-hot U.S. economy, powered by heavy spending by consumers and the federal government, was roaring ahead at an annual rate of 7.3% in the final three months of 1999, the fastest growth rate in nearly 16 years.” The US economy grew at the fastest pace and the US 30 yr Bond prices were rising at the time. Crude oil traded at a ‘very high’ price of $37 which lead the US President Clinton to tap the SPR. Every trader and investor was bullish at that time as NASDAQ led rally made higher highs even as DJIA had stopped making new highs.

Compare this to the present scenario. US 30 yr Bonds are falling, crude oil prices are near lows, US stocks are making new weekly lows and USD holding its strength. This suggests that the US Bond market is discounting growth. The positive slope of the US yield curve signifies inflation expectation getting back into the system. Commodity prices are generally the last to reverse after a major market trend. However the current bear trend in commodity prices in USD terms is strong and will take years to end. A stronger USD will lead to weaker commodities and stronger US exports.

Does this mean that the current financial crisis has run its course?

It would be very difficult to pin point a time for reversal but intermarket analysis shows that US stock market is in for a period of unsustainably lower prices. In the past, the US stock market has lagged deflation oriented bond market signals by more than 6 months. If the bond markets peaked in December then we are in for a lot of cyclical strength in the US stock markets. This could well mean that bonds may keep falling with stocks remaining in a range or stocks may rise relative to bond prices.

Stock market movements are not guided of this market correlation on a day to day basis. But over a period of time these correlation kick in and give strong cyclical reversal signals.

Currently the strength in the USD has been viewed as a ‘risk aversion’ rally. This has lead to liquidation in all the asset classes. In following graphs will show that USD is on the brink of a major bull market rally. It has gapped up today and can lead to strong rally if it manages to close above 87.65 today.

US 30 Yr bonds are declining and there is little to say unless they start trading above 131.

Commodity indices have made a H&S pattern and a next downtick can lead to lower levels.

US stocks have formed a major continuation pattern, a triangle which will resolve bearishly on an S&P 500 close below 805. Present index level in 825.

In the short term a rally in USD can lead to a strong down-leg for commodity and equity markets. This would be probably the last leg down for most of the Asian markets but just a bear market intermediate low for Western markets. With USD gapping up today there is an expectation that the trend in most markets will resolve in a day or two. In the medium term intermarket analysis is signaling a cyclical bottom in equity markets. But equity markets have a tendency to lag. If USD breakouts of this range, we would see a sell-off which will mark the low. S&P 500 will see support at 640 after 805 and 780 are taken out. This breakdown in US stocks would be against the intermarket analysis but short term lags cannot be predicted as market sentiment leads the market behaviour.

USD Index


US 30 Yr Govt Bond


GS Commodity Index


US stocks - S&P500


Posted by Sahil Kapoor at 7:35 PM 0 comments


EurUsd Update


Posted by Blue Bottle at 3:15 PM 0 comments


Newer Posts Older Posts Home
金币:
奖励:
热心:
注册时间:
2006-7-3

回复 使用道具 举报

 楼主| 发表于 2009-4-5 21:12 | 显示全部楼层
Tuesday, February 17, 2009USDJPY


Posted by Blue Bottle at 2:40 PM 0 comments


Monday, February 16, 2009GBP USD M30 CHART - 16Feb


Posted by Blue Bottle at 10:25 AM 0 comments


GBP/JPY Hourly - 16Feb
My first target of the week. LONG from 130.56 for the target 134.70. My SL is at 129.65.


Posted by Blue Bottle at 10:15 AM 0 comments


Sunday, February 15, 2009EUR USD H4 Chart
My EurUsd count. Its not my favorite count but just okay.


Posted by Blue Bottle at 2:02 PM 0 comments


Bullish counts on EURUSD


I'm bullish on eurusd for the next few weeks as long as the low at 1.27 on 02 Feb holds. Feel free to comment on them, folks!

Posted by FM at 12:59 AM 2 comments


Saturday, February 14, 2009EurGbp M5 Chart


Posted by Blue Bottle at 5:22 PM 0 comments


GBPUSD M5 Chart
Hi all,

Wave 4 did not overlap with wave 1, so this 5waves impulses are valid one. Expecting a bounce for wave B or 2 to go SHORT.


Posted by Blue Bottle at 5:08 PM 0 comments


GbpUsd - Update
Target reached but not the way i predicted.


Posted by Blue Bottle at 4:59 PM 0 comments


USDJPY Chart - 14 Feb
Hi all,

If it breaks upper line of triangle then it may form FLAT corrective pattern. Blue color count is my alternative count.


Posted by Blue Bottle at 3:26 PM 0 comments


Friday, February 13, 2009UsdCad Hourly - 13 Feb


Posted by Blue Bottle at 6:18 PM 0 comments


Newer Posts Older Posts Home
金币:
奖励:
热心:
注册时间:
2006-7-3

回复 使用道具 举报

 楼主| 发表于 2009-4-5 21:13 | 显示全部楼层
Friday, February 13, 2009Usdjpy M15 - 13 Feb


Posted by Blue Bottle at 4:57 PM 0 comments


USDJPY 5Mins


Posted by Blue Bottle at 3:46 PM 0 comments


GBPUSD H1 Chart - 13 Feb


Hi all,


Here is the cable chart in h1 time frame.

Posted by Blue Bottle at 3:34 PM 0 comments


GBPJPY M30


Posted by Blue Bottle at 3:25 PM 0 comments


Cable H4 Chart


Posted by Blue Bottle at 3:10 PM 0 comments


Thursday, February 12, 2009AUDUSD Chart - 12 Feb


Posted by Blue Bottle at 2:45 PM 0 comments


Wednesday, February 11, 2009EurUsd
Im waiting to go SHORT>.


Posted by Blue Bottle at 6:37 PM 0 comments


EurGbp M5


Posted by Blue Bottle at 6:27 PM 0 comments


EurGbp
Hi all,

Triangle which i predict earlier became invalied now. It went zigzag corrective pattern.

Wave 5 may form as Ending Diagonal.


Posted by Blue Bottle at 5:49 PM 0 comments


Back to Dow Jones- An Insight

Hi Guys and Gals (if any).


i am back and this time i am posting a chart i made some days ago. Precisely on Feb 3rd 2009.

It is on a monthly time period and i have basically predicted a big leg down.


I am keeping fundamentals in view as well. and trust me, ignored the Stimulus Plan altogether.


What has to happen, Has to happen. Neither a President nor a Federal Bank can stop it. They can only DELAY it.


Well, i will write more soon.


To my critics, who thought Risk Aversion is over, please see Daily GBP Charts....


regards:

Addy.

Posted by Addy at 5:36 PM 0 comments


Newer Posts Older Posts Home
金币:
奖励:
热心:
注册时间:
2006-7-3

回复 使用道具 举报

 楼主| 发表于 2009-4-5 21:14 | 显示全部楼层
Wednesday, February 11, 2009UsdChf 5Mins Chart - Update
Hi all,

Updated chart..
Below is the original chart posted earlier.


Posted by Blue Bottle at 5:28 PM 0 comments


USDCHF 5Waves Analysis - 11Feb
Hi all,

Here is nicely formed 5 waves impulse..


Posted by Blue Bottle at 11:20 AM 0 comments


EurUsd Elliott Wave Analysis - H4 Chart


Posted by Blue Bottle at 11:04 AM 0 comments


AusUsd - 11 Feb


Posted by Blue Bottle at 10:55 AM 0 comments


UsdJpy Update
Here is the updated USDJPY chart. Triangle is confirm forming as it retracing after reached wave C. Wave D is my target now.

Below is the original chart i had posted here on 22 Jan.


Posted by Blue Bottle at 10:44 AM 0 comments


Tuesday, February 10, 20095waves Kiwi H4 Chart - 10 Feb


Posted by Blue Bottle at 6:40 PM 0 comments


AUSUSD 4Hours Chart - 10 Feb


Posted by Blue Bottle at 6:17 PM 0 comments


5Waves - AusUsd M15 Chart - 10 Feb


Posted by Blue Bottle at 5:47 PM 0 comments


Elliott Wave Analysis UsdJpy Chart - 10 Feb


Posted by Blue Bottle at 1:13 PM 0 comments


USD/CAD Hourly - 10 Feb
Hi all,

Here is the another USD/CAD chart..


Posted by Blue Bottle at 1:01 PM 0 comments


Newer Posts Older Posts Home
金币:
奖励:
热心:
注册时间:
2006-7-3

回复 使用道具 举报

 楼主| 发表于 2009-4-5 21:15 | 显示全部楼层
Tuesday, February 10, 2009USDCAD - Near End of Triangle?
Hi all,

UsdCad is in the final stage of triangle..
Watching it closely to go LONG...

Posted by Blue Bottle at 12:56 PM 0 comments


UsdChf - Update
Here is the updated chart.. Again looking for right time to sell it..

Below is the original chart posted here yesterday.


Posted by Blue Bottle at 9:26 AM 0 comments


S&P 500 Chart - 10 Feb
Hi all,

Im looking for down side for wave 5. Near the end of wave 5, we gonna get good buy setup.


Posted by Blue Bottle at 9:06 AM 1 comments


Monday, February 9, 2009UsdChf


Posted by Blue Bottle at 12:02 AM 0 comments


Friday, February 6, 2009UsdChf Elliott Wave Analysis - 6 Feb


Posted by Blue Bottle at 9:31 PM 0 comments


EurChf 2 Possibitilies - 6 Feb
Hi all,

Pls see below 2 charts for the 2 possibilities in EurChf. Either way bull move is pretty sure.


Posted by Blue Bottle at 9:00 PM 1 comments


Cable Updated Chart - 6 Feb
Hi all,

Setup looks good for SHORT entry..


Posted by Blue Bottle at 8:21 PM 0 comments


AusUsd - 6 Feb


Posted by Blue Bottle at 6:22 AM 0 comments


GBPJPY Chart - 6 Feb


Posted by Blue Bottle at 6:20 AM 0 comments


Thursday, February 5, 2009GBPUSD H1 - 5 Feb


Posted by Blue Bottle at 6:06 AM 0 comments


Newer Posts Older Posts Home
金币:
奖励:
热心:
注册时间:
2006-7-3

回复 使用道具 举报

 楼主| 发表于 2009-4-5 21:17 | 显示全部楼层
Wednesday, February 4, 2009EurUsd H4 - Reversal?
Waiting for the big reversal.


Posted by Blue Bottle at 9:56 PM 0 comments


GBPJPY H1 Chart - 4 Feb


Posted by Blue Bottle at 3:38 PM 0 comments


USDCHF 4Hours & Hourly Chart - 4 Feb
After triangle is formed, i am expecting it to go higher for wave 5 and wave C (yellow) end.


Posted by Blue Bottle at 1:13 PM 0 comments


USDCAD Weekly EW Chart - 4 Feb


Posted by Blue Bottle at 1:35 AM 0 comments


AusUsd Weekly Chart - 4 Feb


Posted by Blue Bottle at 1:29 AM 0 comments


Tuesday, February 3, 2009Cable EW Chart - 3 Feb


Posted by Blue Bottle at 8:08 PM 0 comments


USDJPY EW Analysis - 3 Feb


Posted by Blue Bottle at 10:53 AM 0 comments


5 Waves GBPJPY Chart - 3 Feb


Posted by Blue Bottle at 10:48 AM 0 comments


5 Waves GBPUSD EW Chart - 3 Feb
Hi all,

Here is my bullish count for GBPUSD.
Yellow color count is the alternative count.


Posted by Blue Bottle at 10:29 AM 0 comments


5 Waves AUD/USD Possible Triangle - 3 Feb


Posted by Blue Bottle at 12:45 AM 0 comments


Newer Posts Older Posts Home
金币:
奖励:
热心:
注册时间:
2006-7-3

回复 使用道具 举报

您需要登录后才可以回帖 登录 | 立即注册

本版积分规则

本站声明:MACD仅提供交流平台,请交流人员遵守法律法规。
值班电话:18209240771   微信:35550268

举报|意见反馈|手机版|MACD俱乐部

GMT+8, 2025-7-28 04:08 , Processed in 0.086081 second(s), 11 queries , MemCached On.

Powered by Discuz! X3.4

© 2001-2017 Comsenz Inc.

快速回复 返回顶部 返回列表