- 金币:
-
- 奖励:
-
- 热心:
-
- 注册时间:
- 2006-7-3
|
|

楼主 |
发表于 2009-4-6 10:22
|
显示全部楼层
Martin A. Armstrong PEI Model (Phi)
[size=130%]Triple Bearish Head Shoulders & Phi 3.14
===========================[size=100%]
I found this chart from my mailbox, Phi 3.14 model created by Martin Armstrong.
[size=100%]Background of Martin is very interesting, but take a look this chart!
[size=100%]Martin Armstrong[size=100%], former chairman of Princeton Economics International.
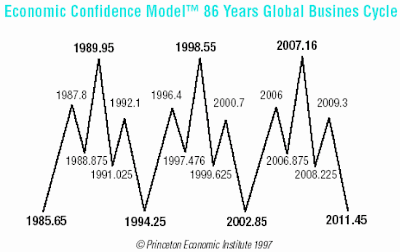
Armstrong called the high of the Nikkei in 1989 months ahead of time—the Nikkei peaked the last week of December as he said it would, then crashed, casting off 40 percent of its value in a matter of weeks. More recently, and again months ahead of time, Armstrong predicted the July 20, 1998, high in the U.S. equities market—to the day. After that morsel of prognostication according to James Smith, a former Princeton Economics employee, the CIA called Princeton, wanting to know how the Institute’s proprietary models worked. Needless to say, Armstrong rebuffed them. The court has since then been demanding that Armstrong hand over his proprietary computer code to them. According to Armstrong's daughter Victoria Armstrong, "It took nearly 30 years for my dad to develop this model and his refusing to turn over its source code to the government is a big reason why he has been held in jail for over 7 years without a trial."
He was indicted in 1999 on criminal security fraud by the U.S. Attorney for the New York, and released on a $5 million bond. He has been accused not of theft, but of misleading clients about financial losses and using new funds to mask those losses. In January 2000, when he failed to hand over corporate files and assets to the court-appointed receiver for his companies, he was charged with civil contempt and incarcerated in the high-rise prison a few blocks from the World Financial Center.
If you´re interested subject or GANN approach more take a look at [size=100%]www.amanita.at
where this chart is also more deeply calculated based for fibonacci math.
It´s market astrology site, he has done more fibonacci & planetary calculation where this cycle could be based. Amanita, an austrian market forecaster free newsletter has estimated most deep market plunges well on time since I had been reading it. Certainly, you can close your eyes and laugh with your CFA´s and Investment advisors who in the earth makes market calls from planet angles, but I bet those pro´s would not beat these market calls. Suggest to subscribe his newsletter, it comes perhaps 3-4 times per year.
Linkit tähän tekstiin
Merkinnät: Martin A. Armstrong PEI Model (Phi)
Chart Industries, GTLS

[size=130%]
When everything looks too good and only sky is the limit
Elliott Wave as forecasting tool is complex, but it´s not as complex as one might think. There´s certain areas where all alternates pinpoints to the same direction meaning increasing your odds to be very high and avoiding mistaken view. Then there´s areas you can end up 13 different scenarios. ZigZags are the one´s which might get so complex one´s that they are really hard to follow up until they ends before massive movements comes again - unfortunately most of the stocks, equities, interests, forex, bonds and financial intruments spends most of the time in some zigzags, simple or complex ones. Impulses are more unusual and allways most wanted one´s as they really put serious movements ahead of them. However, some zigzags breakes for impulses also like famous last "C", it´s agressive movement if you chart have reasonable data history behind.
Some and perhaps most of my charts are too big in timeframe view when I do post them originally thery are not ready for any immediate reaction, but I had started to feed some shorter wave counting, at least to the best setups I think going to work well in the market. Mostly I remember to raise best cases up in the blog (just mentioned CROX and JOSB shortcover panic cases) to get some attention from you. Some stocks doesn´t give any sense at all in elliott wave world, but when you work long enough with charts sooner or later you´ll allways get and spot something which is so perfect it just won´t leave much room for alternates and on the next you´re allready watching if your oscillators confirm the story.
Back to GTLS now, I found this stock originally from other forum where some folks has made brilliat bottom call (not using any TA) but based for fundamendally strong stock and absolute stunning conference call with all the prospects of positive warning for this future and even the next one has been given at the end of february 2008. It looked for me stock has took corrective "C" pattern from full ABC simple zigzag right on there together with earnings.
Stock current valuation is not at the sky either, trailing PE standing standing somewhere around 20 as it´s indursty average also.
I accidently started to look the chart and spotted triangle allmost immediately. Then I looked backed history and again I ended up with full impulse since company IPO (charthistory). I didn´t do fibonacci calculation yet if each waves exacts as perfect as it looks but this comes very interesting indeed when some times has been pasted.
So, where´s the story ? I am technian, I don´t care stories. I don´t buy or sell stories or CFA analyst fundamenal views. I like them and I like read a lot, but I don´t deal with them.
We have reasonable priced stock in here with stunning prospect views. Why do I see only bearish view that stock ends up somewhere 41-44 $ to just top this diagonal at the roof of skyscraper when everyone else are just planning to build more floors for it to get it much higher.
Stories and news comes much later and mostly it´s too late when news comes to react for it, but certainly even for technicans news have confirmation meaning. I don´t think elliott wave international made their forecasting for wheat a few years ago when calculating that it will come to the agressive cycle impulse 3 wave based for bad wheather condinion around the world will hit after few years. That´s a story today or yesterday. That´s a one story also behind of wheat price, but wheat has took it´s impulse much, much earlier.
Certainly, waves can extend and in the veyr long run we could have only wave 1 behind soon and all the rest of the impulses still up and coming in next years or perhaps stock started just a wave 3 from the conference call - in that case I don´t think we could see bearish diagonal. Well, let´s wait and see, perhaps it´s corrective 2 then breakes for at least basic a-b-c formula in here. Stock oscillators are very bullish now and here and there´s not much possibility for immediate turn down. When it starts to get over 40 and 41-42 area you might give a another look for oscillators then. I keep RSI70 as key in here, it´s also one buy signal when it breakes upside and another when it comes down - but do not underestimate for how long indivudual stock can stay as overbought condinition.
These charts are made by stockcharts and there´s no any deeper numerical crush behind of them, so be aware, but I think this will come exellent test for elliott wave theory, it certainly looks very good for me so stay duded. Another interesting stockpattern which might start to work now from my portofolio is Genzyme, so I will pop it up from downstairs for you eyes to consider. Fundamendal details of Chart Industries included below.
In addition I updated Flowserver, FSL + GENZ - Genzyme bearish cases as FSL deals in the same business together with GTLS it starts to look alike oil stocks heading for correction.
Then off the topic if anyone knows any interactive stockcharting which you can add to the blogger please let me know and just drop me a quick message, it would require a huge work to upside these by hands (oscillators).
Btw. what in the earth is the reason all marketing letters and each company presentation in US starts with words; this company is LEADING in this and that business - there´s very few leading companies exist and even the few one´s who really are leaders today are laggers tomorrow....for me it would make better approach and raise my interest if someone would honestly tell that their position in the marketplace...leave the analyst determine who´s colgate nro. 1 or second one behind the corner, because that second one can still grow and achive something as LEADING one only stays at war to try to keep it´s position.
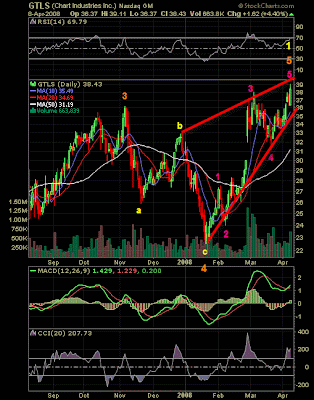
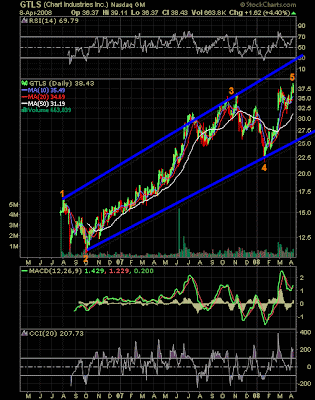
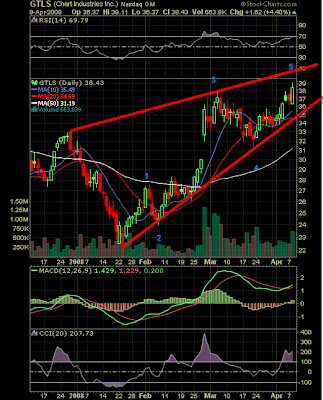
Chart Industries, Inc. (Nasdaq:GTLS), a leading independent global manufacturer of highly engineered equipment used in the production, storage and end-use of hydrocarbon and industrial gases, today reported results for the fourth quarter and year ended December 31, 2007. * Fourth quarter net income up 91% on net sales increase of 26%
* 2007 net income up 64% on 24% increase in net sales to
$666 million
* Backlog increases to $475 million based on strong fourth quarter
orders of $233 million
* Company provides positive 2008 outlook
Net sales for the fourth quarter of 2007 increased 26% to $182.7 million from $144.4 million in the fourth quarter of 2006. For the year, net sales rose 24% to $666.4 million from $537.5 million in 2006. Net income for the fourth quarter of 2007 was $16.4 million, or $0.57 per diluted share, an increase of 91% compared with $8.6 million, or $0.33 per diluted share, in the fourth quarter 2006. For the year, net income was $44.2 million, or $1.61 per diluted share, compared with net income of $26.9 million in 2006.
For 2007, pre-tax income and net income included $7.9 million and $5.7 million, or $0.20 per diluted share, respectively, of non-cash stock-based compensation expense and offering expenses related to the secondary stock offering completed during the second quarter of 2007. The Company's diluted earnings per share, excluding these expenses, was $1.81 per share for 2007.
"We were very pleased with our operating results in the fourth quarter, which was led by our Energy & Chemicals segment," stated Sam Thomas, Chart's Chairman, President and Chief Executive Officer. "We finished the year on a very strong note with fourth quarter orders of $233 million and backlog of $475 million, up 49% compared with the end of 2006. Order quotation activity in our Energy & Chemicals segment has been increasing significantly to reflect the global growth in the industrial gas market and ramp-up of clean coal technologies, including Coal to Liquids ('CTL') and integrated gasification and combined cycle ('IGCC') power projects. Clean coal processes, whether to produce synthesis gas for petrochemical feedstock or power generation, utilize large quantities of oxygen produced by air separation plants that use our equipment."
Mr. Thomas continued, "Overall, 2007 was another successful year for Chart as we continue to demonstrate our ability to navigate profitably through continued rapid growth. All of our business segments achieved strong operating performances, reflecting continued robust demand in our markets, most notably the liquefied natural gas ('LNG') and natural gas segments of the hydrocarbon processing market, but also the global industrial gas market, which has been on an upswing."
Fourth quarter gross profit improved $10.6 million, or 25%, to $53.0 million from $42.4 for 2006. This gross profit improvement was driven primarily by volume increases and favorable project mix in the Company's Energy & Chemicals segment.
Selling, general and administrative ("SG&A") expenses for the fourth quarter were $23.7 million, or 13% of sales, compared with $18.8 million, or 13% of sales, for the same quarter in 2006. The increase in SG&A expenses was mostly attributable to higher employee-related and infrastructure spending to support business growth, and variable compensation expenses due to improved operating performance.
Net interest expense and financing costs amortization for the fourth quarter was $5.2 million compared with $6.6 million for the same quarter in 2006. This decrease reflects lower long-term debt outstanding as a result of $40.0 million of voluntary principal prepayments in the second quarter of 2007, and greater interest income as a result of a higher cash balance during the fourth quarter of 2007.
Income tax expense was $5.0 million for the fourth quarter of 2007 and represented an effective tax rate of 23.3% compared with $4.2 million for the fourth quarter of 2006, which represented an effective tax rate of 31.8%. The full year effective tax rate for 2007 was 28.2% compared with 32.3% for 2006. This decline in the fourth quarter effective tax rate was primarily due to an increase in foreign investment tax credits, and lower foreign tax and domestic state tax rates.
Cash provided by operating activities for the fourth quarter was $28.3 million compared with $2.9 million for the same quarter of 2006. Cash generated from net income and changes in working capital contributed significantly to this strong operating cash flow performance. Capital expenditures for the fourth quarter were $3.5 million compared with $8.8 million in the fourth quarter of 2006. Capital expenditures for both periods consisted primarily of continued strategic expansions at our primary manufacturing facilities. The fourth quarter of 2007 investing activity also included $2.1 million of proceeds from the sale of the Plaistow, NH facility that was closed in 2004.
SEGMENT HIGHLIGHTS
Energy & Chemicals ("E&C") segment orders for the fourth quarter were $118.8 million, an increase of 66% compared with $71.5 million for the third quarter of 2007. This growth was driven by a fourth quarter order in excess of $25 million for an ethylene cold box in the Middle East and orders in excess of $20 million for large brazed aluminum heat exchangers for air separation plants in China and Southeast Asia. E&C segment orders for 2007 were a record $408.0 million and year-end backlog was $358.8 million, which represents an increase of 73% compared with the end of 2006. The record orders for 2007 reflect strong global demand across many of E&C's target markets, including LNG, petrochemicals, natural gas processing and industrial gas. E&C segment sales improved by 61% to $84.9 million for the fourth quarter compared with $52.6 million for the same period last year. This increase was primarily due to higher sales volume for large brazed aluminum heat exchangers, cold boxes and process system projects. E&C gross profit margin increased to 27% in the fourth quarter compared with 22% in the same period last year, reflecting a favorable shift in project mix for process systems and a wind-down of the two large installation projects mentioned in prior quarters.
Distribution & Storage ("D&S") segment sales for the fourth quarter increased slightly to $74.1 million compared with $73.5 million in the 2006 fourth quarter. The improvement reflects volume increases in most product line markets, price increases and foreign currency translation offset largely by lower U.S. bulk storage volume, which was anticipated due to recent consolidations in the industrial gas business. D&S segment gross profit margin was 29% in the fourth quarter compared with 33% last year and reflects higher raw material costs and a product mix change within bulk storage systems.
BioMedical segment sales for the fourth quarter grew by 30% to $23.7 million from $18.3 million in the fourth quarter last year primarily resulting from further penetration of international markets. For the fourth quarter, the gross profit margin increased to 37% from 34% for the same period last year, reflecting higher sales volume and improved manufacturing productivity.
2008 OUTLOOK
Based on current market trends and the strength of backlog, the Company is establishing guidance for 2008 as follows:
* Net sales are expected in a range of $730 million to
$765 million.
* Diluted earnings per share is anticipated in a range of $2.28 to
$2.40 per share based on approximately 29.0 million weighted
average shares outstanding.
Similar to historic trends, the Company expects its 2008 results to be stronger in the last three quarters of the year.
Linkit tähän tekstiin
Merkinnät: Chart Industries, GTLS |
|
|
 [复制链接]