搜索
楼主: hefeiddd

一个笨蛋的股指交易记录-------地狱级炒手

  [复制链接]
 楼主| 发表于 2009-4-1 06:55 | 显示全部楼层
October 19th, 2008 3:19 pm Market Forecasts 28 Comments

There are two basic scenarios that are on the table right now, and I am using the $NDX to represent the options.  The first one is that a counter-trend rally is complete, and that we are heading immediately lower, as displayed by this chart.  In this option, there are two choices, we are falling in a smaller degree [v], or a larger degree [V].  If we are falling in the smaller degree, we would target around 1100, maybe a little below, and then most likely chop of a few weeks before the larger degree wave V of 3 decline.  If we are already complete with wave IV, then this decline is the last move down in our precious wave 3 decline.  If this is the case, then we should be targeting 900 to start, and possibly lower than that.
of w[V]“]
The other set of counts revolves around a counter-trend rally not being complete.  If this is the case, there are two main count options at the moment, a flat, and a triangle.  A triangle should not have us pushing above Friday’s high, while a flat would be targeting the range between 1470 and 1525.  A flat would target similar ranges as if the immediate decline scenarios, however, a triangle offers a number of preliminary targets depending on how it would count.  Should it be the larger degree wave V decline, and we use [w1]=[w5] equality, we would target just under 700.  If we use the width of the triangle to get our projected target, we would get almost 950, regardless of whether is was wave v or V.  And if this would just be iv, and the following decline wave v of III, we would target about 850 with a [w1]=[w5] equality.
or w[IV] flat”]
$NDX triangle

The reason that I favor the smaller wave v vs. the wave V is that we have yet to put in a divergence (in either MACD line or histogram) in all the indexes.  Normally, a wave [V] of a wave [3] would produce a single divergence, while a the final wave [5] would produce a double divergence at the low.  As you can see on the $INDU chart, the MACD and MOMO are not divergent to this point.  I still do not believe that the markets are putting in a lasting bottom at this point due to the weakening breadth.
$INDU non-divergence

The $VIX seems to be testing a resistance around 70.  The next two closest levels I could call horizontal support are 57, which I have been buying around, and 47, and 40 would be a close 3rd.  I don’t think we will see much of 40, and am highly doubting that 47 will even come into play, but I would not be surprised to see us bounce in the range of 70 - 57.  If you are trading options, you should keep a very keen eye on the $VIX right now, as lower levels offer great option prices, while selling when it is at all time highs makes it easier to profit.
Watch 57 - 70 for option players

That is it for this weekend.  I am going to spend the rest of my weekend revisiting my trading rules.  As I said, the market rules have changed, and it is about time that I make sure I am not using out-dated material myself.
Skål!
金币:
奖励:
热心:
注册时间:
2006-7-3

回复 使用道具 举报

 楼主| 发表于 2009-4-1 06:55
October 18th, 2008 3:59 pm Intraday Update 35 Comments

Boy, am I glad expiration week is over - those coke snorting Prozac popping market makers turned the whole affair into a veritable roller coaster ride on steroids. First the bulls got squeezed early in the morning, then the bears got their turn - and in the end the $SPX closed 2 points away from where it opened. Now, that’s what I call progress!
So, for the people who voted on our latest poll here’s the answer: A stack of 100 Dollar bills worth $1 Trillion would measure 678 miles high - it would basically reach low earth orbit. The current tab on the bailout considering all  (but not even counting the creation of those alphabet soup lending windows) are already adding up to about $1.8 Trillion. Therefore Ben Bernanke, our fearless Fed chairman who has so valiantly fought to lead us out of this credit mess, should be rightfully awarded his set of astronaut wings. After all he has thus far handed out a stack of 100 Dollar bills 1220 miles high. We should be so proud, as his accomplishments are truly reaching gallactic proportions.

Anyway, Berk will do the weekend update, probably sometime Sunday, in the interim take a look at this little dance the Bear enjoyed recently on Wall Street. I for one find this type of exhibition completely tasteless - that’s why I’m posting it - to share my outrage.

Churn From Hell ZoneOctober 16th, 2008 5:33 pm Market Forecasts 148 Comments

Berk has some business to attend to this evening (probably spending his ill gotten gains on his floozies), so I’m doing a quick update today:
The empty box said 'DANGER' - I didn't feel like redoing it again. Jing is so broken.

The score went to the bulls today after much whipsawing - the range on the DOW was a whopping 815 points and the breadth closed at 9:1 positive. I was actually pretty successful with a few daytrades early on, but took a step back once the churn range started to narrow and even ITM option profits got eaten by the insane bid/ask spread. My longer term short positions held up surprisingly well even as we were going up late in the day. For the record: this is exactly the kind of day I expected as the market makers were inflicting maximum pain in their favorite week of the month. In the end the DOW got pinned to 9000, which was the only thing that surprised me as I expected it to be 8000 after the early morning drop.
So what will tomorrow bring? Well the bad news is that things are not going to be easy going forward as we are probably going to trace out that dreadful triangle I suggested yesterday. We are now smack middle in the ‘Yellow Churn From Hell Zone’ I’ve indicated on the chart above. The good news is that this should calm down Mr. Vix a little bit. The worse news is that we might overshoot tomorrow as this market is desperate for any good news and this might lead to some monster rally. I just saw a positive earnings report from GOOG after the market closed and thus I expect a bit more upside tomorrow morning. I’m going to take on a little more pain but will start cutting my short positions once I see the 1000 mark breached with confidence, which would represent the upper boundary of the proposed triangle formation. If we slow down ahead of or bounce off the 1000 mark I will be tempted to start loading up on additional Nov puts. No balls, no babies.
One more thought: Let’s not forget that it’s option expiration week and in the last few months the MMs nefariously drove the markets up on Thur/Fri after which it dropped massively the following Monday. So, we might want to keep that in mind tomorrow. Of course everyone has a different risk tolerance, and I encourage that you trade according to your system and make no exceptions. At the same time, try your best to not yield to emotion as this exactly how you wind up selling at the top.
That’s it for tonight - hope you guys did okay today.
Cheers!
UPDATE: Here’s my favorite quote of the day, courtesy of :
In truth the fundamental fallacy at work here is a belief that you can put a fox in with a dozen chickens at night and wake up to both fox and the same dozen chickens in the morning.  Anyone with an IQ larger than their shoe size knows what the outcome of such an experiment will be in advance, but we continue to allow the foxes in with the chickens and then are surprised when we wake up to an empty pen and a stuffed fox.
Please go and read his latest post - a rare voice of competence and reason in this dirty mess.

Intra-Day Update: Pivot Bounce DayOctober 16th, 2008 10:18 am Intraday Update 59 Comments

UPDATE 10:12am EDT: Berk and I are daytrading some tech options today, as it’s a perfect opportunity. FYI: During the last few days of expiration week front month options turn into little mini futures contracts as they become extremely gamma sensitive. We grabbed some FSLR, GOOG, and MA - so far so good. Anyway, this takes some of my attention, but I will keep checking in here during the smooth cruising periods.
UPDATE 10:38am EDT: Mr. VIX now at 76.5 - that’s insane!
UPDATE 11:14am EDT: Mr. VIX now at 81.13 - that’s even insaner! How are my stainless steel rats doing out there? So far Berk and I are having a good day.
UPDATE 1:09pm EDT: Boy, I was spot on with that headline - LOL. Bouncy bouncy!! The market makers are just having too much fun today - right now we’re in the mid day chop and I’m playing it downhill again. I expect some turbulence around the 1240 area on the NQ, but if that breaches we should re-test today’s lows. The Yen looks a bit sickly right now though, so I remain on guard and am prepared to cut my ‘mini futures contracts’ (i.e. IMT options) on any sign of a new bounce.
UPDATE 1:50pm EDT: For the last 1.5 hours the NQ has been chopping between 1265 and 1240 -  it’s getting a bit annoying, but I chalk it up to a typical mid-day chop. I’m playing this to the downsite right now as the Yen’s stochastic is slowly crawling to the upside.
UPDATE 2:44pm EDT: of how the MMs are whipping the market between pivots.
金币:
奖励:
热心:
注册时间:
2006-7-3

 楼主| 发表于 2009-4-1 06:56 | 显示全部楼层
October 18th, 2008 3:59 pm Intraday Update 35 Comments

Boy, am I glad expiration week is over - those coke snorting Prozac popping market makers turned the whole affair into a veritable roller coaster ride on steroids. First the bulls got squeezed early in the morning, then the bears got their turn - and in the end the $SPX closed 2 points away from where it opened. Now, that’s what I call progress!
So, for the people who voted on our latest poll here’s the answer: A stack of 100 Dollar bills worth $1 Trillion would measure 678 miles high - it would basically reach  The current tab on the bailout considering all (but not even counting the creation of those alphabet soup lending windows) are already adding up to about $1.8 Trillion. Therefore Ben Bernanke, our fearless Fed chairman who has so valiantly fought to lead us out of this credit mess, should be rightfully awarded his set of astronaut wings. After all he has thus far handed out a stack of 100 Dollar bills 1220 miles high. We should be so proud, as his accomplishments are truly reaching gallactic proportions.

Anyway, Berk will do the weekend update, probably sometime Sunday, in the interim take a look at this little dance the Bear enjoyed recently on Wall Street. I for one find this type of exhibition completely tasteless - that’s why I’m posting it - to share my outrage.

Churn From Hell ZoneOctober 16th, 2008 5:33 pm Market Forecasts 148 Comments

Berk has some business to attend to this evening (probably spending his ill gotten gains on his floozies), so I’m doing a quick update today:
The empty box said 'DANGER' - I didn't feel like redoing it again. Jing is so broken.

The score went to the bulls today after much whipsawing - the range on the DOW was a whopping 815 points and the breadth closed at 9:1 positive. I was actually pretty successful with a few daytrades early on, but took a step back once the churn range started to narrow and even ITM option profits got eaten by the insane bid/ask spread. My longer term short positions held up surprisingly well even as we were going up late in the day. For the record: this is exactly the kind of day I expected as the market makers were inflicting maximum pain in their favorite week of the month. In the end the DOW got pinned to 9000, which was the only thing that surprised me as I expected it to be 8000 after the early morning drop.
So what will tomorrow bring? Well the bad news is that things are not going to be easy going forward as we are probably going to trace out that dreadful triangle I suggested yesterday. We are now smack middle in the ‘Yellow Churn From Hell Zone’ I’ve indicated on the chart above. The good news is that this should calm down Mr. Vix a little bit. The worse news is that we might overshoot tomorrow as this market is desperate for any good news and this might lead to some monster rally. I just saw a positive earnings report from GOOG after the market closed and thus I expect a bit more upside tomorrow morning. I’m going to take on a little more pain but will start cutting my short positions once I see the 1000 mark breached with confidence, which would represent the upper boundary of the proposed triangle formation. If we slow down ahead of or bounce off the 1000 mark I will be tempted to start loading up on additional Nov puts. No balls, no babies.
One more thought: Let’s not forget that it’s option expiration week and in the last few months the MMs nefariously drove the markets up on Thur/Fri after which it dropped massively the following Monday. So, we might want to keep that in mind tomorrow. Of course everyone has a different risk tolerance, and I encourage that you trade according to your system and make no exceptions. At the same time, try your best to not yield to emotion as this exactly how you wind up selling at the top.
That’s it for tonight - hope you guys did okay today.
Cheers!
UPDATE: Here’s my favorite quote of the day, courtesy of
In truth the fundamental fallacy at work here is a belief that you can put a fox in with a dozen chickens at night and wake up to both fox and the same dozen chickens in the morning.  Anyone with an IQ larger than their shoe size knows what the outcome of such an experiment will be in advance, but we continue to allow the foxes in with the chickens and then are surprised when we wake up to an empty pen and a stuffed fox.
Please go and read his latest post - a rare voice of competence and reason in this dirty mess.

Intra-Day Update: Pivot Bounce DayOctober 16th, 2008 10:18 am Intraday Update 59 Comments

UPDATE 10:12am EDT: Berk and I are daytrading some tech options today, as it’s a perfect opportunity. FYI: During the last few days of expiration week front month options turn into little mini futures contracts as they become extremely gamma sensitive. We grabbed some FSLR, GOOG, and MA - so far so good. Anyway, this takes some of my attention, but I will keep checking in here during the smooth cruising periods.
UPDATE 10:38am EDT: Mr. VIX now at 76.5 - that’s insane!
UPDATE 11:14am EDT: Mr. VIX now at 81.13 - that’s even insaner! How are my stainless steel rats doing out there? So far Berk and I are having a good day.
UPDATE 1:09pm EDT: Boy, I was spot on with that headline - LOL. Bouncy bouncy!! The market makers are just having too much fun today - right now we’re in the mid day chop and I’m playing it downhill again. I expect some turbulence around the 1240 area on the NQ, but if that breaches we should re-test today’s lows. The Yen looks a bit sickly right now though, so I remain on guard and am prepared to cut my ‘mini futures contracts’ (i.e. IMT options) on any sign of a new bounce.
UPDATE 1:50pm EDT: For the last 1.5 hours the NQ has been chopping between 1265 and 1240 -  it’s getting a bit annoying, but I chalk it up to a typical mid-day chop. I’m playing this to the downsite right now as the Yen’s stochastic is slowly crawling to the upside.
UPDATE 2:44pm EDT: of how the MMs are whipping the market between pivots.
金币:
奖励:
热心:
注册时间:
2006-7-3

回复 使用道具 举报

 楼主| 发表于 2009-4-1 06:56 | 显示全部楼层
Churn From Hell ZoneOctober 16th, 2008 5:33 pm Market Forecasts 148 Comments


AIG Scams the MarketsMar.30, 2009 in Stock Market Commentary Leave a Comment
As if AIG hasn’t screwed tax payers enough already,  now they have elaborately schemed to screw investors creating false pretenses that have indicated banks have once again turned profitable.
But last month’s profitability was all just a one and done deal that jammed the shorts and is now likely going to trap new investors at higher prices once again.
Read on if you can stomach it.  Blah!
Exclusive: AIG Was Responsible For The Banks’ January & February Profitability


Berk has some business to attend to this evening (probably spending his ill gotten gains on his floozies), so I’m doing a quick update today:


The empty box said 'DANGER' - I didn't feel like redoing it again. Jing is so broken.

The score went to the bulls today after much whipsawing - the range on the DOW was a whopping 815 points and the breadth closed at 9:1 positive. I was actually pretty successful with a few daytrades early on, but took a step back once the churn range started to narrow and even ITM option profits got eaten by the insane bid/ask spread. My longer term short positions held up surprisingly well even as we were going up late in the day. For the record: this is exactly the kind of day I expected as the market makers were inflicting maximum pain in their favorite week of the month. In the end the DOW got pinned to 9000, which was the only thing that surprised me as I expected it to be 8000 after the early morning drop.
So what will tomorrow bring? Well the bad news is that things are not going to be easy going forward as we are probably going to trace out that dreadful triangle I suggested yesterday. We are now smack middle in the ‘Yellow Churn From Hell Zone’ I’ve indicated on the chart above. The good news is that this should calm down Mr. Vix a little bit. The worse news is that we might overshoot tomorrow as this market is desperate for any good news and this might lead to some monster rally. I just saw a positive earnings report from GOOG after the market closed and thus I expect a bit more upside tomorrow morning. I’m going to take on a little more pain but will start cutting my short positions once I see the 1000 mark breached with confidence, which would represent the upper boundary of the proposed triangle formation. If we slow down ahead of or bounce off the 1000 mark I will be tempted to start loading up on additional Nov puts. No balls, no babies.
One more thought: Let’s not forget that it’s option expiration week and in the last few months the MMs nefariously drove the markets up on Thur/Fri after which it dropped massively the following Monday. So, we might want to keep that in mind tomorrow. Of course everyone has a different risk tolerance, and I encourage that you trade according to your system and make no exceptions. At the same time, try your best to not yield to emotion as this exactly how you wind up selling at the top.
That’s it for tonight - hope you guys did okay today.
Cheers!
UPDATE: Here’s my favorite quote of the day, courtesy of :


In truth the fundamental fallacy at work here is a belief that you can put a fox in with a dozen chickens at night and wake up to both fox and the same dozen chickens in the morning.  Anyone with an IQ larger than their shoe size knows what the outcome of such an experiment will be in advance, but we continue to allow the foxes in with the chickens and then are surprised when we wake up to an empty pen and a stuffed fox.
Please go and read his - a rare voice of competence and reason in this dirty mess.


[ 本帖最后由 hefeiddd 于 2009-4-1 08:04 编辑 ]
金币:
奖励:
热心:
注册时间:
2006-7-3

回复 使用道具 举报

 楼主| 发表于 2009-4-1 06:58 | 显示全部楼层
October 16th, 2008 12:12 am Market Forecasts 34 Comments

Boy, I love the smell of crushed bulls in the morning. Today’s tape continued to take the express elevator downwards and at the closing bell managed to extract over 90 points from the SPX and 733 points from the DJI. Not bad for a day’s work. If you had any math skills extending the scope of those ten bacteria infested claws you call fingers, you would realize that this represents almost a 70% retracement of the PPT induced rally that started on Friday and ended early morning on Tuesday.


SPX most likely in wave 5 of (3).

Some of my lab experiments indicate that you vapid leeches respond well to colors, so I have taken the liberty to indicate the degrees of various subwaves in that fashion. Now, even if you are unable to follow what I’m trying to convey you can at least enjoy the aesthetics of the chart above. It also might make for a great X-Mas present for your mother-in-law - all you need is a cheap frame and an inkjet printer. As a matter of fact, if you have been ignoring the trades Berk and I have been throwing out to you, this may be all you’ll be able to afford this holiday season.
But enough of the pleasantries - let’s talk about the bottom line for your reptilian trading brains, as members of the Swedish mud wrestling team are waiting in my jacuzzi and I’m also in desperate need of a few bottles of Teutonic wheat brew. It seems that we have completed the high of wave 4 of (3) and are now proceeding downwards in minor 5 of intermediate (3). I see two main possibilities going forward: We either proceed down in merciless bull hopes crushing fashion - or we start gyrating inside that ‘yellow goo from hell zone’ which I have highlighted on the chart. EWT and traditional technicians would call that a triangle and it is a valid possibility at this stage. The former would get us to the target drop zone a bit quicker, while the latter would give us the opportunity to keep selling the rips, either in daytrading or accumulative fashion.
I’d prefer door # 1 of course, but it’s possible that the triangle scenario may actually turn out to be more profitable, in particular for the evil leeches among you who enjoy to bounce the pivots up and down. It seems quite easy as well as profitable these days as we’re becoming accustomed to seeing 400 - 700 point moves on the Dow. Some ‘extremely evil readers’ of this blog (you know who you are) have even begun to daytrade the e-mini futures, with very favorable results. Again, this is only for the big boys - I encourage the noobs among you to stick with either options or stock if you can afford them. Actually, even options are expensive as hell as of late as Mr. VIX has decided to set up basecamp at the 69.25 elevation.
Either way we wind up playing it - the end result remains the same. We should drop quite a bit more and complete intermediate wave (3) either around the psychological support area of 800, or - if those bulltarts manage to aggravate me again - decent all the way to about 720 just out of spite.


Gold stuck between a rock and a hard place.

Not much to add in regards to Gold - it’s going down to 600. Do yourself a favor and grab some puts or go short GLD or GDX - or if you’re a big spender like that super evil bear who shall remain nameless (and who happens to run an insignificant trading blog nobody ever visits) you might be interested in selling ZGZ8 futures.
The U.S. Dollar showed us a bit of consolidation today but will soon continue its ride up into the Alpine Peaks of fiat currencies. I’m looking at 85 to 88 as a target zone there.
I think I just heard an impatient call from my jacuzzi and it sure doesn’t sound like my pet goat. Got to run - Inga and Gertrud want their back rubs. Until tomorrow, my stainless steel rats! May the trading Gods have mercy on you.
Cheers!
Check this out!October 15th, 2008 7:36 pm Intraday Update 18 Comments

Tim Knight beat me to the punch but I wanted to make sure everyone sees this. 2sweeties has created a new site called :

It’s still a bit rough around the edges, so make sure to watch the . However, this is cool stuff and I truly believe it has a lot of potential. I even think that several ‘TA strategies’ could be worked into this. Great work, 2sweeties!

« Older Entries
Newer Entries

[ 本帖最后由 hefeiddd 于 2009-4-1 07:01 编辑 ]
金币:
奖励:
热心:
注册时间:
2006-7-3

回复 使用道具 举报

 楼主| 发表于 2009-4-1 12:03 | 显示全部楼层
Heads spinning!October 14th, 2008 9:25 pm Market Forecasts 32 Comments

Let me preface with the statement that Mole and I have a difference of opinion on where the market goes in the near term.  He believes that the market will rally a little more from here, while I believe that we will continue falling, much like we did after the Sep 18-19 rally.
Mole here: Not true - see the I posted a little while ago where I line out two possibilities.
So, I will start off with a daily chart of the $NDX, my working count, and some evidence to back it.  A 4.5% decline is pretty good for the bearish case right after the largest single-day market rally EVER, yesterday.  When that  daily candle goes from opening 40 points higher to fill the gap, and dropping almost immediately afterwards for a total of an 8% change on the day, it makes a strong backing of the bearish engulfing signal.  Finally, I am targeting a few ranges as preliminary targets, unless the markets just fall out.  Those levels surround the range of 1300 and 1250.  Should those levels break with little contest, I would be looking for 1100 as a next target.

Here is the intra-day count that allows for the [ABC]-[X]-[ABC] I mentioned to CC earlier.  Let me also mention that when I use [brackets] I am using a generic count, and not specifying the exact degree.  Oftentimes that is not easy to do in real time.  That said, here it is, a flat, zig-zag, zig-zag.  It is a little weak, but is does not violate any rules, and follows quite a few guidelines.

So, how did the market react today, internally, in respect to yesterday’s rally?  Well, let me go through the daily breadth with you, to give you a frame of reference.  We have:
10/9 Breadth

10/10 Breadth

10/13 Breadth

10/14 Breadth

So, we have10/9: Negative, 10/10: Mixed (Negative), 10/13: Positive, 10/14: Negative.  The internals do not appear to be gaining in strength, rather responding like a junkie to its dope…  We’ll know tomorrow if the market starts to flatline…
The $VIX produced another failed buy signal today, the second failed, of 5 buy signals during this decline.  This one, being the fifth, and coming from a $VIX peaking at 77, is a little harder to dismiss.  I told Mole yeterday that we needed to use the $VIX as a trading signal until it settles out in the 30-50 range.  That said, when it spiked into the mid-forties this morning, I used it as a chance to buy a few pieces of second month paper at, what could likely be, a nice discount.  I think that we all agree that whether the markets move a little bit higher from here, or don’t, that the general direction is still nearly straight down.  Until the  $VIX settles into the above range, I recommend buying stock to reduce your volatility risk while going long.  The BX trade I showed earlier was part of a long term investment, but when I saw the gains I made in 3 trading days, I needed to take it.  There are two sides to this coin, but in a market like this, when you get nice winners, you need to make sure you capitalize on them.
That said, I hope all of you have been surviving, and hopefully profiting from this market.  It has been rough, and will get worse, but if you can trade through this (and we still have a market left), you can trade through anything.
Skål!
金币:
奖励:
热心:
注册时间:
2006-7-3

回复 使用道具 举报

 楼主| 发表于 2009-4-1 12:05 | 显示全部楼层
October 14th, 2008 9:12 pm Market Forecasts 14 Comments

I think Berk is posting tonight but I wanted to throw this in the mix for my legions of evildoers as you must be aching for a sign to storm the beaches. Fortunately, today brought much needed clarification and here’s the chart that says it all:
$DJI on cross road.

Again, this is still a bit preliminary but at this point we know a few things. First up, this rally is running out of steam and the 300 point drop today must have been disappointing for the bulls. If you look at the chart above you’ll see that there are two possibilities at this stage:
  • We just painted and (a),(b),(c) of {4} of 4 and just embarked on {5} to the upside.
  • We just traced out four minor degree waves of a motive {1} of 5, which would mean downside from here.
Now, the news is all over that Intel announcement and it’s possible that we get a pop up tomorrow and breach the ‘green slime zone’ I have also marked on the chart. If we push through that the averages should be on their way to ‘New Short Lasting High City’, which would be a an awesome opportunity to load up on more shorts and maybe some puts, if we can get Mr. Vix to give up his vacation in the Swiss alps
I really hope it’ll be door # 1, as I don’t like to load up on puts - you all know why at this point. Can’t we bears get a decent bull rally lasting more than two days for a change?
Nevertheless, I will start to hunt for overbought victims we can mount, saddle and ride all the way into the abyss Ride of the Valkyrie style:
Yes, the bulls will feel like someone just dropped the big one. Mmmmh, I love the smell of crushed bulls in the morning.
Stay tuned - I will start posting some of my first victims starting tonight, and there will be more throughout the coming days.
Cheers!
UPDATE: I just looked at the DJI futures over at CME and they’re down. Asian exchanges also don’t seem to be impressed by Intel’s 12% third quarter earnings and are heading lower. So, it’s a good chance we will continue the sell off. I still believe it’ll be whippy throughout the day, so use the rips to load up on positions, as this might be our last chance.
Intra-Day Update: Picture FormingOctober 14th, 2008 2:00 pm Intraday Update, Trade 37 Comments

UPDATE 2:00pm EDT: So, I have been watching today’s gyrations a little and it seems that a picture seems to be emerging slowly. Now again - this is all a bit preliminary - but it’s worthwhile throwing out to you leeches. Let me present the evidence I have collected thus far.
  • We are most definitely in a consolidation rally as the wave pattern so far is behaving according to a minor wave 4 scenario. We should have dropped a lot more today if this were a simple retracement of wave {4} of 3 of (3). Yes, it’s possible we drop steadily from here and the day isn’t done yet, but the climate is still quite bullish right now, in my not so humble opinion, and we could push higher from here. As a matter of fact I hope we do.
  • On Monday, the Fed said it would provide limitless dollars through its swap lines with foreign
    central banks in an effort to unfreeze inter-bank lending. The Fed has been increasing those swap lines in the last few weeks, most recently raising them to $620 billion earlier this month. So, where is the Dollar TED spread today?

    It has hardly moved, further indicating that the major players in the credit markets still do not trust each other. Unless we see a considerable change here the pressure on the equity markets will continue. Which means that we can expect further down potential in the longer term. However, judging by the last two days the bull had quite a run on hope and prayers - let’s not forget that. The market can stay irrational a lot longer than we can remain solvent.
  • Meanwhile the NYSE bullish percent index is still at 10; the NYSE McClellan oscillator is at -50. So despite my short term momentum indicators pointing downward right now, the risk is clearly to upside as of now. I tell you when I want to load up on puts - when we see the $NYMO at -10 and above and the $BPNYA at anything better than this (30 would traditionally be oversold, but were at 2 on Friday).
  • Mr. VIX is still in fear mode and I need to see something below 35 at least.
  • It’s expiration week - everyone but MMs gets hurt during expiration week.
So, if this did not clear the situation up for you - GOOD! Because that’s kind of my point here. The market may swing either way any second and it seems picking a direction right now is playing Russian Roulette. Plus, as it’s expiration week and volatility is high the market makers are having their devious fun with you. I scalped a few points today with some tech options but unless you can daytrade I recommend you stay away from that. In the meantime I’m not trying to force the situation - this market still has not come to me. And I have zero confidence in loading up on puts right now and holding anything overnight.
UPDATE 3:34pm EDT: Market just retraced by quite a bit in the last minutes (can you say institutional buying?), making my point above. Anyway, I don’t have a crystal ball either, but one of my favorite analysts, Nouriel Roubini, chilled the market today when predicting the worst recession in 40 years:
Roubini Predicts Worst U.S. Recession in 40 Years, Market Rally `Sputter’
I only disagree with him on the level of severity. In my mind this recession is going to turn into a depression and it’ll probably be as bad as the 1929 Great Depression.
金币:
奖励:
热心:
注册时间:
2006-7-3

回复 使用道具 举报

 楼主| 发表于 2009-4-1 12:11 | 显示全部楼层
October 14th, 2008 11:45 am Intraday Update 21 Comments

Yesterday, Mole said that it is often the day or two after an ungodly rally (or drop, but moreso rally) that really paints the picture.  As we all know, the $NDX opened up, but was looking down immediately and has been dropping since it’s opening peak.
As Mole said yesterday, breadth was hugely bullish yesterday, but the whole   900+ point move was done on very low volume, compared to the previous selling days.  I maintain that for going long, stock picking is the way to go.  I would NOT buy call options here, unless the individual IV is very low, and that has been rare.
Just to show you that buying stock can work, I will detail my latest BX trade…I grabbed 100 shares @ $8 on 10/10 as BX closed at a spike support.  Today, when BX pushed up to 11.50, I was thinking about selling.  After I saw the $NDX head to the toilet after having too much sugar yesterday, I decided to sell of my 100 BX @ 11.25.  That’s a gain of $3.25 on $8, or about 41%.  Take commissions out, and I will be looking at about a 40% gain in 4 days, and 2 of those were weekends.  MTW, OI, and CCC worked out also if you were able to catch an entry.

With a $16 drop in $VIX, call options could have gained yesterday, but the easiest way to bank coin was grabbing some cheap, beaten stocks.  Since I don’t expect the $VIX to take a  real break anytime soon, I maintain that this is one of the safest, easiest ways to trade when option prices have exploded.
Right now, I think lower is still the name of the game.  We have hit appropriate retracement levels, and the $NDX has been kind enough to fill its gap, which is one of the reasons I added to my tech shorts this morning.
Hopefully I will be back in later to add a few more quips, but if not, I will be doing the update tonight, and we will discuss today’s action.
Skål!
Slingshot!October 14th, 2008 12:44 am Market Forecasts 32 Comments

Quite historic times we live in. Last Friday we witnessed a 1000 point range in the Dow and today, after a whole weekend full of bailout announcements on a international scale, we actually were bestowed a historic 936 point rally! Wow - I wonder if beanie threw his hat in the ring for this one, as for once one of his predictions actually came true - got to mark that calendar. However, as they say, even a stopped clock is right twice a day
This is going to be brief as today’s tape leaves two main options available to us. In order to narrow the probabilities more conclusively down to one, we need to wait until at least tomorrow night and probably Wednesday. Either we are done with minor wave 3 of intermediate (3), in which case we are now deep inside minor wave 4 of intermediate (4). Or we are tracing out minute {iv} of minor 3 of intermediate (3), which means that this rally would be followed by more significant downside action in a short amount of time.
Historic 936 point rally on the DJI.

I’m actually giving the minor wave 4 scenario a bit more credence as today’s strength was significant by all standards - breadth on the NYSE closed nearly 19:1 on the side of the gainers. If we’re dealing with a minute wave {iv} here we should be dropping almost right away - the limit is around 9615 on the DJI. However, the Dow futures are already trading above that on the after market ticker, so I’d be surprised to not see the cash average follow suit in the morning, maybe even with a opening gap. Therefore, as indicated on the chart, I’m giving the minor wave 4 scenario a higher probability at this point. I didn’t want to leave the minute {4} wave scenario off altogether, as the market has a habit of punishing evil analysts eager to jump to conclusions.
We are extremely overbought at this point and one would expect some profit taking and a bit of a sell off. However, as on the short side when we were going down, considering the extreme conditions of late it’s in the realm of possibility to see the momentum to hold and continue. So, I would caution anyone to blindly start dipping into short positions or to go long puts until the situation clarifies a bit. I also want to warn everyone from expecting much reward from playing the long side, should additional upside momentum develop tomorrow. Mr. VIX is still enjoying his vacation in the Alpine regions, shedding a few points today but closing at 55. Thus I recommend that you heed Berk’s advice of sticking to stock positions if you want to go long. I probably won’t touch a call option until I see Mr. VIX at 40 and below, preferably 35 and below (which traditionally is still considered high).
I’m very curious to see an update on LIBOR, the TED spread, and the TNX tomorrow - as none of these were available due to the bank holiday. If we see significant changes on that end, it might also bolster one of the two scenarios.
And yes, Gold had another Rodney Dangerfield day - no surprise there. No matter where the market is going, Gold seems to want to go down lately.
Finally, here’s a headline I caught this evening on Bloomberg:

1930s - mmmh - somehow that rings a bell. Can’t remember, meh - probably not important…
That’s all I got for tonight. I will be in touch as the day unfolds tomorrow - I think by watching the wave pattern we will be able to narrow things down in a day or two. If you must take trades in the interim, keep it clean and contained. This is still a very erratic and violent market, and there is little doubt that it can turn on a dime.
Cheers!
金币:
奖励:
热心:
注册时间:
2006-7-3

回复 使用道具 举报

 楼主| 发表于 2009-4-1 12:12 | 显示全部楼层
October 12th, 2008 11:53 pm Market Forecasts 31 Comments

This IS the wave 3 of 3 we have been talking about for some time.  We said it would be quick.  It is moving very rapidly, ask anyone on the sideline looking for a traditional entry.  The problem now is that we have indicators at extreme oversold conditions, some at historical highs/lows, warning that a bounce could form at any second.  Friday’s action was a great example of that.  We opened and the elevator was heading straight down.  In the first 1/2 hour, rallied sharply in an [A] wave, declined in an [ABC] corrective action of a [B] wave, and finished the day with a [C] wave which is either complete, or has one more gyration higher, which the futures are now indicating.  What does that mean?  That means that despite the indicators SCREAMING for a bottom, we will continue to lean down on the short term trend.  My main reason for this is that the indicators are still pointing down (or up, $VIX).  So, even though the BPA is a 2.67, it is still heading to 0.  Once these indicators turn back up, a sustained bounce could ensure.  However, here is a close up of wave 4 of 3 of 1, from the first leg of this decline.
This is a quick short term view, before the wave 4 chart.


Keep a close eye on the $NDX as tech and small caps are beginning to have some buying.  As the first chart shows, the market will still be playable if your timeframe is small, but the intra-day swings are going to only get worse, not better.  The good things though, it that we would expect a “trading range” type of movement during a standard wave [4].  Right now I like the range between 1200 and 1325 for the $NDX, and it would take a break of the upper of those two boundaries for me to rethink my downside scenario.
That said, when the ever-immenent bounce does occur, how will you trade it?  The $VIX is TRADING above ranges most people can comprehend, and right now, is probably the hardest part about trading options.  I said before that the game has not changed, and it hasn’t.  It has been sped up and a 4-year old just changed the rules, besides that, nothing has changed.
That is for while the market is dropping.  Playing the bounces are not easy.  With a $VIX at 70, buying calls at the bottom, likely when the $VIX spikes the farthest, is only going to leave you with empty bags.  Selling puts, through a spread would work, but I don’t like to limit my reward.  I WOULD NOT sell naked puts on ANYTHING, because right now, it is just not worth the risk.  With that, I have two strategies I think will work fairly well, and I will discuss the one that any of us can do.  One option to trade this safely is trade diagonal/calender spreads.  I don’t like spreads very much, and they would take some time to explain.  Therefor, I will concentrate on buying stock as short term trades..
Yes, Berk said “buy STOCK.”  I never thought I would, but here are my reasons.  1) Stocks are cheap right now, many have lost 20-50% in the past few weeks.  2) Longer term money is looking at stocks with a “value” eye right now, and moreso as we continue to decline.  3) No $VIX.
Here is the basic criteria I am looking for:
  • Badly beaten stock.
  • 10%/day (or more) ATR.
  • 1 or more divergent indicators.
  • Exhaustion or reversal candle (preferably on high volume).
I have a few good examples right now…some of relative strength (believe it or not) and some of strong relative weakness.  I will start with the weak ones…
We have MTW…Nice cheap little machinery stock.  ATR could make for some quick gains.

Then there is OI.  Now that it has reached our open gap targets, we can look for a little bounce.  That exhaustion candle sure does look nice on a divergent MACD line.

Or NYT.  This little newspaper printed some coin on Friday.  I’d take some down on a break of 14.

Some of the dry-shippers are also showing similar candles, and could be good buys.
Finally, the best relative strength candidate. I already own this gem in my IRA… Will be grabbing some more shortly… CCC.

Hopefully this gives you something to work with, and an idea to pursue on your own accord.  This week will be interesting for sure.  We will continue to take it swing by swing basis.
Skål!


« Older Entries
Newer Entries
金币:
奖励:
热心:
注册时间:
2006-7-3

回复 使用道具 举报

 楼主| 发表于 2009-4-1 12:13 | 显示全部楼层
October 9th, 2008 11:52 pm Market Forecasts 92 Comments

For the last few months Berk and I have been preaching the gospel of what we (and several other EWT aficionados out there) commonly refer to as a 3 of (3) motive wave. However, reading and talking about it is one thing - experiencing it is quite another, especially if you are actively trading the markets. Let me illustrate what actually has transpired in the first 7 trading days of this month:
Massive Destruction of Wealth

What we are witnessing here is the destruction of wealth on a massive scale. The first 7 trading days bestowed the market with a continuous series of losing days - and that my dear evildoers is the good news. The bad news is that those 7 days also managed to wipe out a combined 2 years worth of equity gains. The prior 2 months managed to relieve the bulls of ‘only’ 3.8 years of equity gains - not bad but amateurish compared with what we’ve seen this week (and it’s not over yet). Being on the receiving end of such a wipeout must be rough, but then again - as some of you remember, I swore on the eve of Sept. 19th that my revenge would be brutal and merciless - and as you can see, I wasn’t kidding. BTW, I’m just getting warmed up.
So, let’s look at today’s stats, which warrant closer examination (plus I know you’re a bunch of math nerds). NYSE breadth was absolutely horrible today - the Dow closed at 30:0, the $SPX at 33.9:1, and the $OEX at 96:1. NYSE volume was slightly over 2 Billion, not bad but not in record territory either just yet. Mr. VIX marked a new record today, closing at 63.92 (and temporarily trading at over 64) - exactly 10 years and 1 day after marking the last record at 60.63.
Those numbers reflect the state of panic that is now finally starting to permeate markets worldwide as investors are starting to realize that they can run but they cannot hide. I am sure many of them are licking their collective wounds right now, and are looking forward to a slingshot bounce which must surely be overdue right after such a sell off.
WRONG!
More downside expected

Little do they know that a wave 3 of (3) cares little about technical support zones and has the nasty habit of simply punching through them without ever looking back. Although we are nearing the bottom of 3 of (3), its wave count is not complete at this point and probabilities favor further downside. I have tentatively pointed out some target zones for the SPX in the chart above, but they are rough approximations, so please use them only as a guide.
Corrective wave {4} is probably a few days away, and should eventually lead us back towards the peak of the prior fourth wave of its next lower degree (which is wave iv) at around 1070. Do I expect a slingshot rally all the way up to that point? Not necessarily, it is possible that we’ll gyrate around for weeks and make only little progress, but it should give us all plenty of opportunity to load up on shorts and put positions. Towards the peak of {4} I expect Mr. VIX to have simmered down a little, if we’re lucky we’ll see it at below 30 again, which would make option buying a lot more fun.
Gold most likely spiking before continuing descent

Gold missed out on most of today’s fun, and closed at 920 - remember that the GC futures pit closes at 1:30pm EDT. I’m pretty sure we’ll see a bit of a pop tomorrow morning but it’s clear that there is a seller lurking at the 925 level (guess who that is) that would need to be taken out in order to continue an uptrend. I’m actually glad that a more clearer {a},{b},{c} has been forming, after which I expect the downside journey towards 700 to continue. I know all this is a bit hard to believe at this point, but Gold represents a clear and present danger to the PPT’s effort to maintain a strong Dollar and to prep up our equity markets. Those unenviable gold bugs already had to endure six months of extensive market manipulation, as there is little doubt that Gold should be trading at well over 1500 at this point. However, against the backdrop of a financial meltdown, o.i. in Gold futures today sunk to nearly 321,000, which is the lowest level in two years. It is clear that many gold speculators have been leaving in droves at this point, rightfully fearing further price manipulations by the PPT through bullion banks and primary dealers.
All attempts of shoring up investor confidence and to unfreeze the credit markets have been a complete and utter failure as I have been predicting. Similarly, the current currency manipulations by calling in treasury debt which must be paid in U.S. currency will soon come to an end as well, which should result in a free-falling Dollar. But in the interim we still expect there to be plenty of upside for the Dollar and inversely plenty of downside for the Euro. As a sidenote - the Yen has been going strong despite the smack talk it has received in the last few days. It managed to surge 19 percent versus the Australian dollar, 14 percent against New Zealand’s currency and 8 percent against the euro in the last month, that is some real action and fortunes were made in the FOREX markets. It’s also at the psychological 0.01 level right now - which means you can get one Yen for one U.S. penny.
That’s all I have for tonight. It’s been a fantastic day for us bears but I encourage you to stay humble and stick with the program (i.e. keep your exposure limited and don’t get greedy). If you haven’t cashed out today I would recommend that you continue to at least reduce your positions starting tomorrow. Yes, we could be falling a bit further here, but obviously we’re getting closer to a snapback.
Congrats to everyone who banked coin today - making money in a bear market should be considered an art form. If you managed to do so in the last few weeks and in particular today then you are part of a very small and exclusive minority. Count yourself lucky but bear your gains with humility and don’t get too excited. After all, overconfidence is a trader’s Achilles Heel.
And finally, on a more serious note, please read this new posting by Karl Denninger. Our country is in deep trouble right now and unless our ‘leaders’ take appropriate action immediately we will face the next Great Depression. Yes, one can only hope our government chooses the ‘right path’ for a change - but who am I kidding?
Cheers!
金币:
奖励:
热心:
注册时间:
2006-7-3

回复 使用道具 举报

 楼主| 发表于 2009-4-1 12:14 | 显示全部楼层
October 9th, 2008 11:52 pm Market Forecasts 92 Comments

For the last few months Berk and I have been preaching the gospel of what we (and several other EWT aficionados out there) commonly refer to as a 3 of (3) motive wave. However, reading and talking about it is one thing - experiencing it is quite another, especially if you are actively trading the markets. Let me illustrate what actually has transpired in the first 7 trading days of this month:
Massive Destruction of Wealth

What we are witnessing here is the destruction of wealth on a massive scale. The first 7 trading days bestowed the market with a continuous series of losing days - and that my dear evildoers is the good news. The bad news is that those 7 days also managed to wipe out a combined 2 years worth of equity gains. The prior 2 months managed to relieve the bulls of ‘only’ 3.8 years of equity gains - not bad but amateurish compared with what we’ve seen this week (and it’s not over yet). Being on the receiving end of such a wipeout must be rough, but then again - as some of you remember, I swore on the eve of Sept. 19th that my revenge would be brutal and merciless - and as you can see, I wasn’t kidding. BTW, I’m just getting warmed up.
So, let’s look at today’s stats, which warrant closer examination (plus I know you’re a bunch of math nerds). NYSE breadth was absolutely horrible today - the Dow closed at 30:0, the $SPX at 33.9:1, and the $OEX at 96:1. NYSE volume was slightly over 2 Billion, not bad but not in record territory either just yet. Mr. VIX marked a new record today, closing at 63.92 (and temporarily trading at over 64) - exactly 10 years and 1 day after marking the last record at 60.63.
Those numbers reflect the state of panic that is now finally starting to permeate markets worldwide as investors are starting to realize that they can run but they cannot hide. I am sure many of them are licking their collective wounds right now, and are looking forward to a slingshot bounce which must surely be overdue right after such a sell off.
WRONG!
More downside expected

Little do they know that a wave 3 of (3) cares little about technical support zones and has the nasty habit of simply punching through them without ever looking back. Although we are nearing the bottom of 3 of (3), its wave count is not complete at this point and probabilities favor further downside. I have tentatively pointed out some target zones for the SPX in the chart above, but they are rough approximations, so please use them only as a guide.
Corrective wave {4} is probably a few days away, and should eventually lead us back towards the peak of the prior fourth wave of its next lower degree (which is wave iv) at around 1070. Do I expect a slingshot rally all the way up to that point? Not necessarily, it is possible that we’ll gyrate around for weeks and make only little progress, but it should give us all plenty of opportunity to load up on shorts and put positions. Towards the peak of {4} I expect Mr. VIX to have simmered down a little, if we’re lucky we’ll see it at below 30 again, which would make option buying a lot more fun.
Gold most likely spiking before continuing descent

Gold missed out on most of today’s fun, and closed at 920 - remember that the GC futures pit closes at 1:30pm EDT. I’m pretty sure we’ll see a bit of a pop tomorrow morning but it’s clear that there is a seller lurking at the 925 level (guess who that is) that would need to be taken out in order to continue an uptrend. I’m actually glad that a more clearer {a},{b},{c} has been forming, after which I expect the downside journey towards 700 to continue. I know all this is a bit hard to believe at this point, but Gold represents a clear and present danger to the PPT’s effort to maintain a strong Dollar and to prep up our equity markets. Those unenviable gold bugs already had to endure six months of extensive market manipulation, as there is little doubt that Gold should be trading at well over 1500 at this point. However, against the backdrop of a financial meltdown, o.i. in Gold futures today sunk to nearly 321,000, which is the lowest level in two years. It is clear that many gold speculators have been leaving in droves at this point, rightfully fearing further price manipulations by the PPT through bullion banks and primary dealers.
All attempts of shoring up investor confidence and to unfreeze the credit markets have been a complete and utter failure as I have been predicting. Similarly, the current currency manipulations by calling in treasury debt which must be paid in U.S. currency will soon come to an end as well, which should result in a free-falling Dollar. But in the interim we still expect there to be plenty of upside for the Dollar and inversely plenty of downside for the Euro. As a sidenote - the Yen has been going strong despite the smack talk it has received in the last few days. It managed to surge 19 percent versus the Australian dollar, 14 percent against New Zealand’s currency and 8 percent against the euro in the last month, that is some real action and fortunes were made in the FOREX markets. It’s also at the psychological 0.01 level right now - which means you can get one Yen for one U.S. penny.
That’s all I have for tonight. It’s been a fantastic day for us bears but I encourage you to stay humble and stick with the program (i.e. keep your exposure limited and don’t get greedy). If you haven’t cashed out today I would recommend that you continue to at least reduce your positions starting tomorrow. Yes, we could be falling a bit further here, but obviously we’re getting closer to a snapback.
Congrats to everyone who banked coin today - making money in a bear market should be considered an art form. If you managed to do so in the last few weeks and in particular today then you are part of a very small and exclusive minority. Count yourself lucky but bear your gains with humility and don’t get too excited. After all, overconfidence is a trader’s Achilles Heel.
And finally, on a more serious note, please by Karl Denninger. Our country is in deep trouble right now and unless our ‘leaders’ take appropriate action immediately we will face the next Great Depression. Yes, one can only hope our government chooses the ‘right path’ for a change - but who am I kidding?
Cheers!
金币:
奖励:
热心:
注册时间:
2006-7-3

回复 使用道具 举报

 楼主| 发表于 2009-4-1 12:15 | 显示全部楼层
October 9th, 2008 10:44 am Intraday Update 68 Comments

UPDATE 10:43am EDT: We didn’t believe in this supposed rally and thus far we enjoy being on the right side. Of course it’s early in the game, so things can turn around on a dime. Not much to say at this point, we’re watching the ticker and holding on to our short positions. In the meantime I might just be crazy enough to drip into CNS once it breaches 21:
CNS

We are also waiting for GOOG to breach 331.55 (previous low in 2006) - this might happen today, tomorrow, or 3 weeks from now. But when it does, make sure you’re in there.
GOOG

Just got back…October 9th, 2008 2:31 am Market Forecasts 35 Comments

This is what I have drafted from before I left this evening.  I will fill it in tomorrow.  My apologies, as my plans went far longer than I had anticipated.
BOTTOM LINE:  More decline in the very short future.  At some point a bounce will form, but we don’t think it will be without another low (or so).
We continue to head lower, producing low after low.  The $VIX is on the rise, and continues to poke around nearly record levels, even the people say it is high.  Sentiment indicators continue to fall and are still pointing down.  Doesn’t this SOUND like a wave 3.  For the most part, it hasn’t FELT like a wave 3 until this week, so I don’t think we are done falling yet.
However, the question on EVERYONE’s mind is “what about the bounce?”  Well, what bounce?  When the media gets ahold of a story, it is hard not to get away from it, especially in a time like this.  But this is when we need to step back from the tube and make sure we trade the entries on the charts.
That said, let me explain a little about being oversold (or overbought).  Some of the indicators you might be looking at right now are most likely in oversold territory.  Some of them are even pushing the extremes of range.  Indicators/Osciallators can remain overbought/sold for a very long time.  A few of the things you should look for before taking a position against the trend, no matter how SURE you are about it, are direction, level, and divergence, no matter what timeframe.

This is the $NDX.  Notice how the MACD, while very low, is still pointing down, as well as being at a new relative low.  That means that trend is still strongly down.  The stochastics tell a different story, being slightly divergent.  Not to say it is done, but only that we should watch for momentum to build on the upside before jumping in.
Again, I will fill in tomorrow, but it is late on the East Coast, and I need to grab some Zzzzzs.
Skål!
金币:
奖励:
热心:
注册时间:
2006-7-3

回复 使用道具 举报

 楼主| 发表于 2009-4-1 12:16 | 显示全部楼层
October 8th, 2008 12:33 pm Market Forecasts 32 Comments

Okay, I’m going to start adding things here - keep checking back. First one:
SAN

PNG

XOM

IRM


Bullish Delusions CrushedOctober 7th, 2008 7:03 pm Market Forecasts 52 Comments

Today’s update will be pretty brief for two reasons: First I’m pretty beat as I only got a few hours of sleep last night. Secondly, there is not too much to report and I’m tired of repeating the same info over and over again. Yes, wave {3} of 3 of (3) is nearing its end, but 3 of (3) is in full force and should complete towards the 3rd week of October.
Say again?
Approximate SPX wave count plus projections.

Okay, here’s the only chart I will post today - it took me a while to product this Michelango, so study it with the awe it surely deserves. It seems that after putting in a series of one-twos we completed a iii and then a iv yesterday. We then bounced off 1070 (as expected, which also is about 50% of iii) and then embarked on subminuette v today. That one offers two scenarios now (i.e. our fork in the road):
  • Scenario A: It completed today (thereby also terminating (v) and {iii} ), and we push into {iv} from here.
  • Scenario B: It will terminate tomorrow - in that case 950 should represent considerable support. We would then push into {iv} from wherever the low occurs.
I have also highlighted the ‘drop zone’ for minor wave 3 of intermediate (3). Again, short of a crystal ball (which is still in the shop) we can only extrapolate from what we’ve seen thus far. If you measure wave 1 of (3) it is reasonable to project that the downside potential can extend up to 1.618 times its (fib measure) height. However, I think that a conservative target is the 925 area, in particular if {5} is preceded by a {4} that retraces to the 1100 area.
Well, I hope all that didn’t make your head spin - studying the chart for a while should make things clear to you. However, please try to not to drool with your mouth open while you’re trying to figure it out. We’re trying to run a classy joint here.

Breadth was extremely negative today - the $NDX was only able to produce one single positive symbol, and the $SPX closed at 24.5:1 - now that must be some kind of record - is anyone besides us tracking this? The Dow got hammered into the ground - just the way we like it. Those permabulls had it coming a long long time - and after Sept 18 I did promise that my revenge would be painful and merciless. Well, I’m just getting warmed up - there’s a lot more pain to be inflicted before I have my fill. Yeah, that’s right - better try to stay off my blacklist.
That’s about it for me this evening. The Dollar pushed up - as expected - however corrected down later in the day. Gold is consolidating upwards but a bit further than I anticipated. Frankly, the tape of the last two weeks is starting to look like a furball my cat coughed up, and I rather not deal with it until it figures out what it wants to do. Gold does that though - and I can speak from experience - it drives you nuts for weeks on end and then makes a 100 point move in two days. So, yes - I’m keeping an eye on it but have no exposure at this time.
I’m going to pop a bottle of Hefeweizen now and enjoy the rest of a hot day in sunny L.A. If you made profits in this crazy market you obviously were inspired by our forecast and thus deserve a ‘Mass’ (one liter glass) of your favorite lager. May I suggest you pick among my favorite candidates - Whole Foods in the U.S. carries many of those beauties:

Cheers!

« Older Entries
Newer Entries
金币:
奖励:
热心:
注册时间:
2006-7-3

回复 使用道具 举报

 楼主| 发表于 2009-4-1 12:18 | 显示全部楼层
October 7th, 2008 12:13 pm Intraday Update 80 Comments

UPDATE 12:10pm EDT: Well, thus far this rally has no meat on it, but I think we may be in for a little surprise in about an hour. Remember FED chair Bernanke gives a speech at 1:15pm EDT, the FOMC minutes are released at 2:00pm EDT, and the Consumer credit report is released at 3:00pm EDT. So, maybe we shoot up an then drop as the market digests that the mean FICA score of U.S. consumers is dropping below 300?
Stay on your toes today - this market is about to either pop or drop.
UPDATE 1:48pm EDT: Folks, if you’re delta negative (as I hope you are you might want to start taking profits. Yes, we get the CCR later today which should be ugly. But I’ve taken down some big winners like FSLR, GOOG, DRYS, etc. I’m also cutting anything commodity/agricultural related (MON, POT, etc.).
UPDATE 2:09pm EDT: Feast your eyes on the chain of fools:
Chain of fools.

CLOSING BELL: This was a good day for the masters of evil. Hope you guys banked some coin today. Your homework for tonight is to reflect on the fact that ES was the only blog projecting a drop last night. Everyone else was bullish to the hilt.
REKOGNIZE!!
More Wave 3 to come…October 6th, 2008 10:38 pm Market Forecasts 77 Comments

Today felt like a blur to me, I don’t know about you.  To start off with, Jim Cramer jumped on the tube today to warn everyone that their investments could lose 20%.  Another 20%!!  What about the first 30%?  Nobody seemed to see that coming.  If only we could have profited on the way down…Oh wait.
Anyway, Cramer issuing a sell-signal is a short term buy signal for us.  Unfortunately, the rally is at LEAST half over.  Good news though, is the rally should be about half over, so a little more pain, and a chance to get loaded again, and we should be off to lower levels.  We could rally for a couple of days, but I can’t see the $COMPQ getting much past the open gap at 1950.  Ya, that’s about 90 points off, but if the rally DOES last more than 1 day, that’s the max I would expect.

We have been stressing a weekly timeframe (of sorts) to help eliminate the intra-day noise.  IF you can day-trade and are comfortable doing it on those timeframes, great, this is the market for you.  But if not, KNOW that the current trend is down, we expect for at least another 2 weeks for a couple of reasons.  Of the 135 weeks of the Tech Bubble (Wave A down), 83 of them finished lower.  27 out of 49 weeks, including corrective waves, have finished lower so far in the Financial Bubble (Wave C down).  61.5% (thanks Leonardo) of the weeks in Wave A closed down, IF we get 135 weeks for Wave C, we should expect more along the lines of 75%-80% of weekly declines, looking at LEAST 100 weeks of decline, so we are “roughly” a quarter of the way done using this estimate.  I was looking at the $COMPQ for this, which we are targeting 1471-1400 for a target, and monitoring our level around 1852 and 1950 for current resistances.
Not much else to say…$VIX was up, markets were down, TNX was down, 90% of stocks were down (EVEN after a FOUR-Hundred point rally.  The $INDU closed beneath 10K for the first time since the 26th of this month 4 years ago, volume across the board was 11x more to the downside than upside (on closing issues).

That going to be it for tonight folks.  Rumors of manipulation are spreading at almost all times.  It could be just to deter people like us, speculating on the dark side of the market, or it could be truth.  I maintain that you should use rallies to position yourself for more downside, and manage your risk like a hawk.  But don’t be afraid to nibble.  Shit, throw some of YOUR stuff out there.  Let us see what you got…
Skål!
金币:
奖励:
热心:
注册时间:
2006-7-3

回复 使用道具 举报

 楼主| 发表于 2009-4-1 12:20 | 显示全部楼层
October 5th, 2008 5:25 pm Market Forecasts 92 Comments

When I was a kid one of my favorite SciFi novels was ‘ written by Harry Harrison. The protagonist is a futuristic con man, thief and all-round rascal. He is charming and quick-witted, a master of disguise and martial arts, an accomplished bank robber, an expert on breaking and entering, and (perhaps most usefully) a skilled liar. A master of self-rationalization, the Rat frequently justifies his crimes by arguing that he is providing society with entertainment; and besides which, he only steals from institutions which have insurance coverage. He displays a strong morality, albeit in a much more restricted sense than is traditional. (For example, he will happily steal, but deplores killing.)
From the original publisher’s blurb:
…We must be as stealthy as rats in the wainscoting of their society. It was easier in the old days, of course, and society had more rats when the rules were looser, just as old wooden buildings have more rats than concrete buildings. But there are rats in the building now as well. Now that society is all ferrocrete and stainless steel there are fewer gaps in the joints. It takes a very smart rat indeed to find these openings. Only a stainless steel rat can be at home in this environment…
The main character, Slippery Jim DiGriz, is one of those likable bandit type characters whom you want to root for even though they are technically breaking the law. Not surprisingly I was able to identify with that sort of a character - my evil genius was just waiting for the right kind of inspiration. What was particularly intriguing about Slippery Jim was his ability to beat the establishment at its own game. Evil Speculator in some ways is the embodiment of that very notion - an opportunity for the little guy to extract a few pennies from the privileged few who know how to play the system.
Anyone who comes here is invited to become part of our cause, no matter what color, creed, or culture. We play by the rules, even if they change them on us midstream we simply learn and adapt. We work hard to develop a system that offers us an edge, and it is our system - we play by no other person’s rules. The market is a cruel mistress and as such we pay for and acknowledge our mistakes and weaknesses, doing so makes us better traders. We strive to be disciplined and resist emotions like fear or greed, and we reject cognitive biases tempting us to bend or even break our own rules. We recognize that despite the fact we all compete against each other there is strength in numbers - therefore we choose to collaborate and share our insights. After all, what we are up against are extremely well organized institutional traders with access to considerable resources as well as intimate knowledge of how to play ‘the game.’ Finally, we don’t hesitate and take action as as soon as the opportunity represents itself - nothing you do or know matters if you can’t pull the trigger when the time is right.
Well, guess what - the time is right, and the opportunity you have waited for is here and it is now. The stakes are high and this time, the gloves are off. The bulls had their fun and they got every single break in the book and then some. Now our time has come - we are all stainless steel rats and will milk this market all the way to the very bottom of the abyss.
Okay, let me climb off my soap box now - hope you’re still with me. I usually prefer to stick to the facts and don’t revel in lengthy philosophical lectures. But this nation is heading into extremely difficult times and many innocent and hard working people all around you, maybe even your friends or your family, are going to suffer as we witness the complete unraveling of our financial system. While the pirates are busy looting our country and planning their escape to their tropical islands, the rest of us will be handed the bill for their decades long exploits. I have to respect their devious endeavor but I vehemently refuse to be the one paying for it.
Therefore I call upon my legions of stainless steel rats to join me in my nefarious cause to beat the incumbents at their own game. Do it for yourself and for the well-being of your family. Now, that I’ve painted the picture, let’s get on with business:
Difficult market? Maybe not!

If nothing else I want you to burn a picture of this chart into your cerebral cortex (look it up). Quite frankly, this is all you need to know. The market is in a clear down trend, and it’ll get a lot worse before it’ll get any better. Yes, we will see intra-weekly gyrations that will challenge our resolve, but the numbers speak for themselves. If you would have gotten into index puts on Monday and blindly sold on Friday, you would have banked a profit 7 out of 8 times. Now, of course we can do a lot better than that, and the chart indicates that there is additional profit potential by timing your exits through the use of momentum indicators like for instance a simple stochastic. As of late I also watch daily pivots in combination with the TNX and the Yen. Again, for the folks who missed my previous excerpts on the subject, the TNX moves with the market, while the Yen is an inverse indicator. You can actually set up a left chart between the @YMZ8 and the $TNX, switch it into hummingbird mode and then watch this happen in real time.
PPTPL finally breached.

Here’s a more elaborate view of the DJI cash index, which shows the wave count and how it has been bouncing off of what I termed the PPT panic line, or PPTPL. After the bailout boondoggle was finally rammed through Congress Friday afternoon (as I predicted) the market surprised even the most cynical among us by refusing to rally and instead made a u-turn pushing through the PPTPL and closing at new lows. For the record, I wish Congress would have exhibted the same sense of urgency when asked to increase the minimum wage for low income workers - that took them about 10 years. They should be so proud!
I expect there to be a retest of that line but barring any major stunts by the PPT I expect it to be brief and tepid. Over the weekend I’ve been perusing the news worldwide and it seems that Europe is pouring an unprecedented amount of funds into salvaging a number of their own banks and financial institutions. Here are some of the headlines:
Obviously, all that action will introduce renewed volatility into the market as investors slide the slope of hope. But rest assured that none of these panic moves will do much in stemming the continuous descent of equity markets domestically and abroad. We might see some brief and violent rallies, which I encourage to use to load up on your favorite puts or short positions.
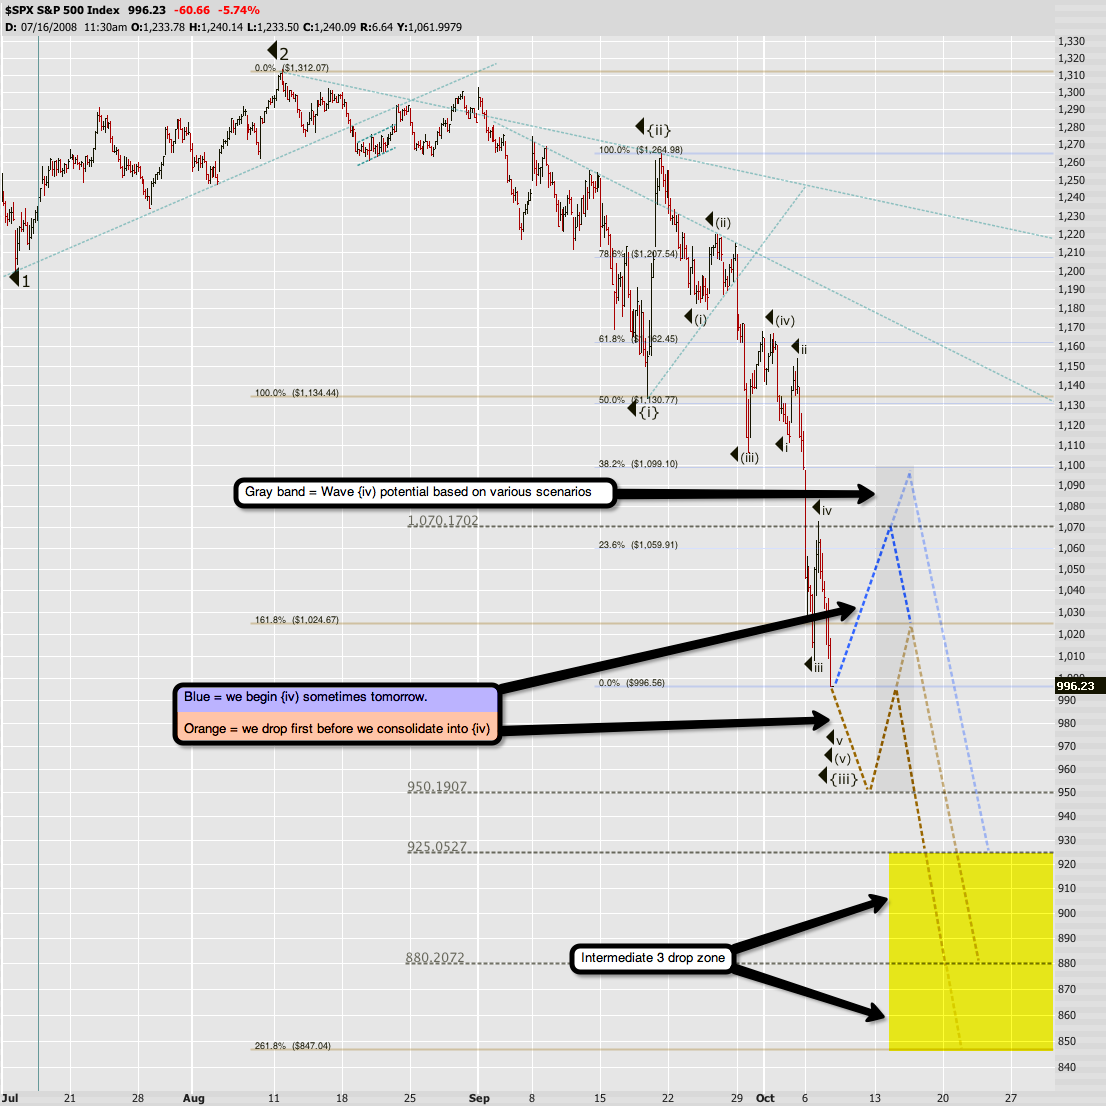
SPX painting a series of 1,2.

My preliminary target is the 950 area on the SPX, and I expect the DJI to slide to between 9600-8800 before we will see a counter wave that lasts more than a day or so. As marked on the chart, there is the potential that we rally - I’d give it about 35% - if we see some major concerted action by the world’s central bank. However, I don’t think that even a move at that scale would be good for much more than 30-60 points on the SPX (and maybe 200-400 points on the DJI - at minimum that diagonal resistance line on both indexes should hold). There’s the obvious psychological 10,000 line and once we breach that I do expect a retest before we continue with our descent.
Gold back on track.

It seems Gold finally picked a direction and it’s down. The wave count is still a bit premature, but it seems that it’s completed an {a},{b},{c} and we’re in the first wave down that should take us to nearly 600 in the coming weeks. I’m waiting on a little bounce up above 800 to load up on puts in GLD and possibly some Gold related stocks like ABX.
BTW, in case some of you wonder. My long term plan is to wait for Gold futures to find a bottom and then load up on physical Gold. The timing may just wind up to be perfect as we should reach the end of intermediate (3) around the same time Gold should find its level. Incidentally, I have come across various news reports that the rich and wealthy are loading up on an unprecedented amount of physical Gold (not related paper) - obviously those cats know what time it is. Unfortunately for them however they are unable to read a chart, which may serve us well as many of them might engage in panic selling once we’re pushing towards 600. But again, that is several months out, so let’s not worry about any of that for now. In the meantime we’ll short the heck out of the precious metals. A word of caution regarding Silver - don’t trust any reports pointing towards shortages in Silver, and anticipating a sudden surge in value. The gold/silver ratio is increasing, which is natural during economic deflation (also look at copper, which is a great indicator) as investors are seeking out protection from risk.
Dollar continuing its upward trajectory.

The U.S. Dollar is continuing its path upward, as expected. We should see a small corrective wave soon, but nothing major. The European and Asian central banks in collaboration with the U.S. Fed continue their currency manipulations to push the Dollar higher. I guess they want their U.S. treasuries to be worth something once they begin dumping them en masse.
In conclusion I want to introduce our new theme song for wave 3 of (3). It’s the perfect soundtrack for watching the market drop into oblivion and your portfolio burst at the seams. BTW, it’s meant to be cranked up - and remember to keep young children and pets out of hearing range
金币:
奖励:
热心:
注册时间:
2006-7-3

回复 使用道具 举报

 楼主| 发表于 2009-4-1 12:20 | 显示全部楼层
October 2nd, 2008 9:38 pm Intraday Update, Market News 26 Comments

Senate passes, market drops.  BUY the RUMOR, SELL the NEWS…  That’s how we’ve played the game twice now, will it be that way tomorrow?  As Mole’s weekly chart pointed out at the beginning of the week, you short on Monday, and close on Thursday or Friday.  It has been that way for about 6 weeks now, I hardly suspect that to change.  Mole has been slipping me some info about the TOMO and POMO auctions, and there seems to be quite the supply waiting on the sidelines.  Volume has been fairly light for the past two days, and trading has not been as fluid as it usually is.
$VIX has had 3 confirmed buy signals, and now, 1 failed buy signal, and very, very close to being able to issue yet another buy signal.  This is serious proof that wave 3 of 3 is underway.  So about options trading…Yes, the $VIX is absurdly high, and puts are expensive, and calls are even more ridiculously overpriced.  However, there are a few things you can remember.  Expensive options can always get more expensive, and the $VIX can always go higher.  The game has changed, but it can still be played.

Here is the $NDX.  Notice a lower low, but divergent MACD Histogram and Stochastics.  Not to say that these cannot catch up, but right now, I am wary of a reversal around 1450.  Still about 3% away, but seriously, that is an typical day right now.

I maintain that puts on tech companies is the way to go, but Ag stocks are really pushing the envelope.  Fortunately, I have been all over CF.  Other ideas are BG, MON, MOS, TRA, POT.  Yes, they are a little far gone, but as I said, the can go further…
Also, if you have not seen this beautiful gem, check out this graphic from the NYT…

Tomorrow will likely be slow, at least until the vote happens, IF it happens.  The trading climate is difficult still, make sure your timeframes are short, and your risks are managed.  That’s it, a short update tonight…We will be sure to keep you posted…in fact Mole is posting some of his choice picks as the night goes on…Be sure to check them out if you have not thus far.
Skål!
金币:
奖励:
热心:
注册时间:
2006-7-3

回复 使用道具 举报

 楼主| 发表于 2009-4-1 12:22 | 显示全部楼层
October 2nd, 2008 7:14 pm Trade 24 Comments

So, the trannies ($TRAN) started to finally cave in, after being the most stubborn of all the Dow indexes - just like in 1929. A lot of the stocks in it are already shot to hell, but I some jewels for you:
CHRW

R

UNP

Now for some technology - there should be plenty to pick from:
IIVI

CEL

ESE

IDC

HITT

金币:
奖励:
热心:
注册时间:
2006-7-3

回复 使用道具 举报

 楼主| 发表于 2009-4-1 12:23 | 显示全部楼层
October 2nd, 2008 6:17 pm Intraday Update 17 Comments

Today’s selloff was nothing but a message by Hank Paulson to the House:
Visual representation of market.

Pass the bill - or I’ll kill this puppy!! I’ll DO IT!!
Intra-Day Update: Cui Bono?October 2nd, 2008 3:01 pm Intraday Update 56 Comments

UPDATE 2:48pm EDT: So, the market is in a tumble obviously and everyone is assuming the impending doom. Now, bearish as you all know I am, I cannot help but suspect a ruse, or let’s call it a bear trap. Are we making new lows? Well, not yet at least. I also don’t see any indication that the Feds are stepping in to stem the drop, which would be relatively easy considering today’s low volume. So, maybe I’m going on a limb here but I have doubts that this one is for real. Why?
Cui bono? (in the spirit of Tim’s latin lessons) - literally “as a benefit to whom?” Or in English - who benefits? Tomorrow we’ll have a big vote in the House - would a stable market or even a rallying market benefit the PPT’s cause? Or would it make more sense to let the market fall, or even worse, engange in robotic selling, which seems what it is happening today. Your guess is as good as mine, but I wanted to throw it out there.
UPDATE 3:10pm EDT: Just saw this on the slope - it seems at least BofA is preparing for a nationwide one week shutdown. Is this for real? Does this only affect BofA? Should we all go and grab our cash from our other banks? Input/Insights appreciated. FYI: my wife is already on her way to grab all her cash out of her BofA account.
UPDATE 4:19pm EDT: Here’s a short term chart of the NASDAQ futures (NQ) - does this look ‘real’ or does it look like a systematic sell off to you? And where’s the panic selling in the last few minutes? I actually see a spike up!
Real or Faux?

that the market dropped on economic slowdown fears - yeah right! After months of bad news and a House vote the next day that is expected to ease the credit crunch investors are dropping everything today? I know the average lemming out there is pretty vacuous but this just smells like a huge bear trap to me. Perhaps I’m wrong - and even if - wouldn’t matter. Nobody can afford puts at a VIX hanging at 45 anyway. Maybe I’m going to regret it tomorrow when we drop like 600 points again, but I just don’t trust this and the risk/reward ratio does not add up.

« Older Entries
Newer Entries
金币:
奖励:
热心:
注册时间:
2006-7-3

回复 使用道具 举报

 楼主| 发表于 2009-4-1 12:58 | 显示全部楼层
October 2nd, 2008 6:17 pm Intraday Update 17 Comments

Today’s selloff was nothing but a message by Hank Paulson to the House:
Visual representation of market.

Pass the bill - or I’ll kill this puppy!! I’ll DO IT!!
Intra-Day Update: Cui Bono?October 2nd, 2008 3:01 pm Intraday Update 56 Comments

UPDATE 2:48pm EDT: So, the market is in a tumble obviously and everyone is assuming the impending doom. Now, bearish as you all know I am, I cannot help but suspect a ruse, or let’s call it a bear trap. Are we making new lows? Well, not yet at least. I also don’t see any indication that the Feds are stepping in to stem the drop, which would be relatively easy considering today’s low volume. So, maybe I’m going on a limb here but I have doubts that this one is for real. Why?
Cui bono? (in the spirit of Tim’s latin lessons) - literally “as a benefit to whom?” Or in English - who benefits? Tomorrow we’ll have a big vote in the House - would a stable market or even a rallying market benefit the PPT’s cause? Or would it make more sense to let the market fall, or even worse, engange in robotic selling, which seems what it is happening today. Your guess is as good as mine, but I wanted to throw it out there.
UPDATE 3:10pm EDT: Just on the slope - it seems at least BofA is preparing for a nationwide one week shutdown. Is this for real? Does this only affect BofA? Should we all go and grab our cash from our other banks? Input/Insights appreciated. FYI: my wife is already on her way to grab all her cash out of her BofA account.
UPDATE 4:19pm EDT: Here’s a short term chart of the NASDAQ futures (NQ) - does this look ‘real’ or does it look like a systematic sell off to you? And where’s the panic selling in the last few minutes? I actually see a spike up!
Real or Faux?

that the market dropped on economic slowdown fears - yeah right! After months of bad news and a House vote the next day that is expected to ease the credit crunch investors are dropping everything today? I know the average lemming out there is pretty vacuous but this just smells like a huge bear trap to me. Perhaps I’m wrong - and even if - wouldn’t matter. Nobody can afford puts at a VIX hanging at 45 anyway. Maybe I’m going to regret it tomorrow when we drop like 600 points again, but I just don’t trust this and the risk/reward ratio does not add up.

« Older Entries
Newer Entries
金币:
奖励:
热心:
注册时间:
2006-7-3

回复 使用道具 举报

 楼主| 发表于 2009-4-1 15:26 | 显示全部楼层
October 2nd, 2008 12:28 am Market Forecasts 48 Comments

Apologies for the late post, but manipulating Senate votes via my remote hypnotic-rays isn’t as easy as I make it look. But evil prevailed as usual, thanks to yours truly - now send me a few bags of cash (non-series NZ Dollars please) as the premise of a once again functioning option market has just slipped closer into our greedy grasps. If you just were released out of jail or were busy urinating into your neighbors yard - yes, the U.S. Senate approved a slightly porked out Bailout Boondoogle Bill and the House is supposed to vote on the new monstrosity on Friday.
It’s been a long day and I’ll make this uncharacteristically short tonight as my wife is standing by with her pinroller to administer my weekly punishment for being a petty husband. My paltry pleas attempting to blame the broken option market are falling on deaf ears and I better get this done while I’m still physically capable.
SPX probabilities for the coming days.

I have little doubt that we’re pushing up in the coming days, as the market is a psychological basket case and is trading Washington, not Wall Street right now. Besides we’re still pretty oversold on the bullish percent indicator and Mr. VIX is picking out wall paper at the 40 point mark. But the eviction order should be presented in a short order as we’re most likely will see a bit of profit taking in the morning (buy the rumor, sell the news) as Tim Knight will be selling his 10 Million Cubes options. After that I expect a slight mock rally followed by more sideways grinding but a lot less fun than what I’m used to at our local nudiebar.
Friday or Monday (depending when the House snails are done casting their vote) I see three possibilities, and all three of them have propabilities attached to them based on the fact that Intratrade predicts a 90% chance that the House will put this new bill into law (see chart below):
  • House rejects the new bill - probability 20% (I’m being generous). In this case we would most likely make a U-turn wherever we’re trading and subside into hell. I think the 50% fib line is a realistic upper boundary for that case, plus there is some strong diagonal resistance as indicated on the chart.
  • House approves bill A: probability 40%. We rally (of course) but it fizzles out around the 61.8% fib line. I would give this a bit more of a chance if there was some kind of resistance line based on traditional TA.
  • House approves bill B: probability 40%: Same vote but we rally and bust through 61.8% fib - next resistance is the 78.6% fib with added overhead resistance from a diagonal touching the peaks of 2 and {ii}.
MPrice for US Government bailout plan to be passed by Congress at intrade.com

Of course it is possible that we bust through all the lines, but then all bets are off and I would have to go back to the old drawing board and change the wavecount. As for the timing of these scenarios - we’re talking days at this point, and maybe 2-3 weeks at the very most. There are some analysts out there who are considering the possibility that minor wave 3 of intermediate {3} finished on the 29th and that we are now embarking on a multi-week consolidation rally of wave 4 of {3}, but I great doubts that this is the case here. This would have been a very disappointing and greatly abbreviated wave 3, which is more than doubtful. Looking at basic equity and credit market fundamentals it is abundantly clear that there are some very ugly events on the horizon, no matter of many hundreds of Billions the PPT and their henchmen throw at the problem. This is a worldwide event which will exert continuous downward pressure on our markes, and I’m convinced that wave 3 of 3 will accompany us well below the DJI 10,000 mark.
I have no opinion on Gold right now, except that it’s a loser and that it should be pushing towards 1000. It’s so bad it doesn’t even deserve a chart tonight. Perhaps it’s being manipulated, but who cares - there’s nothing we can do about that anyway. I don’t see an entry and it can go either way right now, so best to just stay away from it. My personal sentiment leans towards the bearish side.

The Dollar completed its {a},{b},{c} and never looked back, just as predicted. The chart is painting a gap there, which I don’t think is for real - it’s either the Prophet feed or it’s because I’m showing the DXY index and not the actual futures. Either way, the Dollar has embarked on his 5th motive wave and should meander up into the 85 region and possibly beyond. Meanwhile the Euro is still getting the Rodney Dangerfield treatment - no respect there. A strengthening Dollar is of course not good for crude which was getting hammered again today and closed below the 100 mark at 99.1. Keep those relationships in mind as a rising Dollar plus a deflating economy exerts pressure on the commodity markets. Copper is traditionally a great indicator on the health of the economy.
While you’re at it, also keep an eye on the TNX (30 year treasury yields) and the Yen in the coming days - the correlation is alive and well and offers you a nice ‘tell’ into what the market may do next if you’re trading on a short term basis. (Yen down - Dow up; TNX up market up).
For the record - I’m pretty excited about the vote tonight while being exasperated about having to wait until Friday or perhaps even Monday for a resolution of this Mexican Market Standoff (patent pending). I’m running out of naughty websites for crying out loud! But as they say - all evil deeds take time, so in the interim I keeping my stance of staying mostly in cash with a few selected positions here and there. Hopefully a rising market will heal some wounds on this busted options market, as the current bid/ask spreads make us evil speculators look like boyscouts compared with those market makers.
Cheers!
UPDATE: The SEC extended the short selling ban until three days after the $850 billion financial rescue legislation is enacted into law. It won’t extend beyond 11:59 p.m. on Oct. 17.
金币:
奖励:
热心:
注册时间:
2006-7-3

回复 使用道具 举报

您需要登录后才可以回帖 登录 | 立即注册

本版积分规则

本站声明:MACD仅提供交流平台,请交流人员遵守法律法规。
值班电话:18209240771   微信:35550268

举报|意见反馈|手机版|MACD俱乐部

GMT+8, 2025-7-27 12:34 , Processed in 0.062111 second(s), 8 queries , MemCached On.

Powered by Discuz! X3.4

© 2001-2017 Comsenz Inc.

快速回复 返回顶部 返回列表