搜索
楼主: hefeiddd

一个笨蛋的股指交易记录-------地狱级炒手

  [复制链接]
 楼主| 发表于 2009-4-1 06:38 | 显示全部楼层
November 10th, 2008 10:25 am Intraday Update 199 Comments

UPDATE 10:20am EST: First up - if you haven’t done so, read the  - I put a lot of work and time into that one. Secondly, I didn’t sell into the open and was actually encouraged to see 951 hold despite its low probability rating over at  Yen is a bit overshot right now - guess currency traders don’t give a hoot about the Yuan and the supposed relaunch of the Yen carry trade. What keeps me from cutting and running right now however is this:

We are approaching overbought levels on a short term basis at least and I think I’ll hold and see if we get a nice swing down. As I’m typing this the Yen is getting it up the rear again - expect some choppiness in the next hour or so. For the record - I still don’t trust this market further than I can throw it. My line in the sand is 952 - we push beyond that and I will dump my remaining puts.
UPDATE 11:03am EST: Yen is shooting up right now but will hit a pivot around 1.0185. TNX is dropping as well - so far so good for the bears. I still don’t trust this market though. Maybe I’m jaded after Friday’s mess.
UPDATE 11:45am EST: I just took profits as the Yen is approaching that pivot again but looks generally overbought at this point. IF it breaches it with confidence I might jump back into some puts again, but I need to see some clear signals here.
UPDATE 12:37am EST: CRUDE ALERT - it just dropped below 60.
UPDATE 12:45am EST: Yen just punched through R1 pivot at 1.023 - can’t believe it. TNX still hovering around lows. Crude fighting for its life around 60. I just picked up some FSLR and GOOG puts but am keeping both on a hare trigger.
UPDATE 1:53pm EST: You guys all know I’m ranking pretty high on the evil meter, but the is starting to get out of hand. As Barry put it so aptly: Opportunism knows no sense of decency. Is any of our elected ‘leaders’ willing to put an end to the continued illegal actions of those banksters? It seems every day they find yet another way to put their greedy paws on more of our hard earned tax money. You guys have no idea how tough it is for me to sign those tax return checks - for I know where they wind up. Not in the hands of teachers educating our children and construction workers fixing our infrastructure - no, it goes all to pirates and gnomes who take private helicopters to work every day. DISGUSTING!
Karl
UPDATE 2:31pm EST: FYI - market is testing the S1 pivot on the ES which is 917.5. If that one falls we drop like a rock.
UPDATE 2:44pm EST: Yen looks ready to push up but the ES pivot is holding. I just don’t trust this market right now - will step aside for today.
UPDATE 3:32pm EST: I think here comes the end-of-day-market-maker-short-squeeze.
金币:
奖励:
热心:
注册时间:
2006-7-3

回复 使用道具 举报

 楼主| 发表于 2009-4-1 06:38 | 显示全部楼层
November 9th, 2008 6:18 pm Market Forecasts 58 Comments

According to the Chinese Zodiac, 2008 is the Year of the Rat (Earth), which began on February 7, 2008 and ends on January 25, 2009.  First in the cycle of 12 Animal signs, Rat Year begins the sequence and recurs every twelfth year. It is a time of renewal in so many ways.
Yeah - no kidding!

Let me add to that - when reflecting back on the past ten months it has become abundantly clear that 2008 has been the year of a particular breed of rat - the stainless steel rat. What sort of rat is that? It’s a rare type of creature which seeks out and ruthlessly exploits opportunities when others only see chaos and adversity. Unlike its more commonly known rodent cousin it does not live in packs but often collaborates to assure its survival or to gain an advantage. Shunned and execrated by society at large the stainless steel rat operates out of sight, behind the walls of the system, unseen, silent, and mostly ignored.
Restless and inquisitive, we are are active, both physically and mentally, tending to lead busy lives. Challenge is essential to us for we love the thrill of living dangerously. With clairvoyance, intuition and an eye for detail, we are formidable problem solvers, finding workable solutions to the knottiest problems.
As this year slowly draws to a close I must say that I am proud of what we rats have accomplished so far. After all, we have flourished where others have failed miserably. Is it because we are so much smarter than the average trader out there? I would love to say yes, but that would probably be a bit complacent - it’s quite natural to overestimate one’s own intelligence, but chances are most of us are of the average variety. What however separates us foremost of all is a heightened sense of distrust and suspicion regarding any information we receive from the propaganda machines that command the masses of lemmings commonly referred to as the ‘average investor.’
The bubble heads on financial news networks have been assuring us for over a year now that ‘everything will be fine’, and that there is little chance of a recession, contrary to all the facts of course. Then, when it was clear that this all was a stinking heap of lies (big surprise) we were told that any recession will be ’shallow’ and will last a few months at most. Now the roaring debate is over whether or not this ‘was the bottom’ and exactly when those rosy times are ahead again.
Of course, what did we do all along? The opposite of what we were told to do - stainless steel rat style - and thus shortened the heck out of the market at every turn. Has it been easy? Of course not - the powers that be run the show and we are merely lowly rats that feed off the crumbs that fall between the cracks when the tectonic continental shelves of finance begin to shift into reverse. But despite numerous surprise interventions by those high priests of finance, and several setbacks caused by a sudden change of the rules, we are still alive and kicking. For we are extremely difficult to eradicate - we can smell disaster miles ahead due to a highly developed sense self preservation mixed with paranoia. Thus we have no compunction about jumping ship at the slightest sense of trouble and we are proud of that fact. After all we are no heroes - for those die in battles at the command of generals who only have their own selfish interest in mind. Stainless steel rats know that true advantage and fortune stems from preservation and being able to fight another day. We also understand that at the end of the day, we are alone in our quest and that we cannot and must not put our prosperity and future into the hands of others.
Unlike the pirates and gnomes running our financial system who happily enrich themselves at the disfortune of the working class, we rats mainly benefit when greed and hubris are in oversupply. Those are the times when our ranks swell and we flourish in numbers. We don’t really recruit as those who accept our truths and perception of reality usually find us. You can’t become a stainless steel rat - you are either one at young age or you will never understand our way. Like our distant cousins, the vulture, we also know when to sit and wait - and we only strike when the advantage has shifted clearly in our favor. How do we know when that moment has arrived? For we are insatiable when it comes to the evaluation of probabilities in market trends. We use only select tools that are proven to reliably measure the tides of the market - and unless we feel the wind in our backs we do not make a move. Finally, we do not take sides - and we are happy to ride on the tails of bears and bulls alike.


With all that in mind I would like to talk about what the coming week might have in store for us rats. There are arguments that lead us to both the bearish and bullish side of things and the emphasis for us will be on not making a decisive move until we find the odds strongly in our favor. Trading ahead of a clear resolution is simply motivated by greed and wishful thinking, and runs contrary to our stainless steel rat creed. The wave count remains to be inconclusive, but despite all criticism I have received in the past week, it does start to resemble the triangle pattern I suggested in mid October. Although the chart looks messy, it’s not that hard to understand and I have tried my best to point out the three scenarios I give the highest probabilities as of now. As part of the triangle Scenario A points down after a little pop to the upside. Scenario B indicates that {d} of 4 has alread bottomed and that the first turning point should be at the upper triangle border. Both A and B lead us to the downside around 750 on the SPX, our preliminary target. Due to the strength of the preceding downside move and the overwhelming negative breadth on Wednesday and Thursday I give Scenario A the highest probability rating of 40% as of now. It would also give the triangle pattern additional credence. Scenario B receives 30%, as I consider it a possibility but it’s not ideal in terms of the wave count. If we actually wind up tracing this one out over Monday/Tuesday, I would have to add a higher chance to Scenario C.
C is the bullish runner up and would of course require an adjustment of the wave count. Coincidentally this would be minor wave C of intermediate (4) or perhaps even minute wave {iii} of A of (4).

The reason why I am giving this one also a high probability of 30% is due to the continuously narrowing TED spread. Then there’s the narrowing of the spread between the Moody’s BAA bond yield and the 30 year T-Bond yield ($TYX), which has now slimmed to 4.94% (it was 5.3% a few days ago). Again, a slight narrowing does not always assure a bullish counter trend move but if it keeps narrowing we need to seriously consider this is a possibility. What also concerns me is not so much the $TYX, but the Moody’s yield that has started to descent.


The bubble on this chart was supposed to say ‘on the rise but flattening’ - but after three attempts I gave up on jing. The message remains clear here and also continues to support the potential for a bullish rally. Unless I see the weekly stochastic flatten further and perhaps even below the 25% line I remain on code yellow for the bearish case.


You have probably seen this chart floating around in the last few days - I also posted it last week myself. Although the pattern is not super clean we might have ourselves the potential for a massive inverse Head & Shoulder formation here, which if it would play out would present us with a monster rally leading us up to 1120 on the SPX.
Which brings me back to the first chart I posted. Based on various conflicting signals it may be wise to stay out of the market unless we see some much needed clarification. Thus, I have attempted to label that chart with good entry and exit points, as those represent moments in the price pattern that would give us the highest probability for defensible positions. We would also know in a relatively short amount of time if we were wrong and that it is either time to move to the sidelines again, or to reverse our positions. For those of you who were caught on the short side of the stick last Friday I have also marked the point where I would start cutting those positions, as the probabilities for a reversal would be greatly diminished past those thresholds.


For your convenienece here is a slightly magnified chart with the new weekly retracement levels, courtesy of 2sweeties over at  - a friend of the blog. The prior chart still has the old ones on there as I made it yesterday evening. Incidentally, we were told this morning that 2sweeties also added a daily USD/JPY retracement calculator, which is a wonderful and much needed addition to the current choices. Once I figure out which values to enter, I will report back here. Usually I look at the Yen futures in the ‘raw’ which currently is the @6JZ8 symbol in Prophet charts or the Yen index ($XJY) over at stockcharts.com. So, if 2sweeties could post a tutorial including some symbols/sources of what to look at I’m sure many here would appreciate it.


My apologies for being so obsessed with triangles as of late (earlier this year it was wedges - LOL), but I think that’s what we are tracing out in Gold right now. If that is what’s happening then the wave count above would change a little bit as {iv} would move to the end of wave (d) at the completion of the triangle. In continue to believe that we will see more downside in Gold in the coming weeks, and this remains in effect unless I see 778 being breached.

Zigzag posted about the Rydex Nova/Ursa ratio, which I have never used but appears to be a good indicator for actual bullish/bearish sentiment in the market. Investopedia offers this:

A sentiment indicator based on the Nova and Ursa funds from the Rydex Fund Group. The Nova fund is bullish with a target beta of 1.5. Whereas, the Ursa fund is bearish with a target beta of -1.0. This ratio can be used as a proxy for the direction of market sentiment. More specifically, a high value represents a bullish sentiment and a low value represents a bearish sentiment.
Looking at the current chart above it seems that investor sentiment remains clearly bullish right now - perhaps too bullish for their own good.

The more longer term NYSE Bullish Percent Index seems to support that - we are in bullish territory but not exactly super overbought. But then again - just like 40 is the new 20 in the VIX - perhaps 40 is the new 60 in the $BPNYA.

The more shorter term McClellan Oscillator also remains in bullish territory, however more upside is possible here as well. Perhaps that gives Scenario B more credence?
There you have it my dear stainless steel rodent leeches - this should give you all something to chew on for the evening. Let’s keep it clean and in the spirit of the approach that has worked for us so far. If we have to wait a week to get clarification, then be it! I for one made the mistake to take a few trades on Friday before one of my indicators gave me a clear signal and I dearly paid for it at the close. We all get seduced by the dark side every once in a while, but if we want to survive and continue to swim with the sharks then we need to acknowledge mistakes, swallow our pride, and continue to stick with the system. I for one will remain mostly in cash until I see the stars align clearly for some much needed resolution. It will happen - but no matter how bad we want it we have no impact on which way the market is going to swing. Best we can do is to read our tea leafs and jump into the fray when we see a clear advantage. I don’t see that right now, so let’s not do anything stupid until we do. I hope I have been crystal clear here - remember, no matter how smart you think you are - the market is always smarter.
Cheers!

« Older Entries
Newer Entries

[ 本帖最后由 hefeiddd 于 2009-4-1 07:05 编辑 ]
金币:
奖励:
热心:
注册时间:
2006-7-3

回复 使用道具 举报

 楼主| 发表于 2009-4-1 06:39 | 显示全部楼层
November 7th, 2008 11:12 am Intraday Update 240 Comments

UPDATE 10:45am EST: I got up a little bit late today as I needed to catch up on sleep - also, I did expect this rally. Now the first thing I see when looking at my Bloomberg feed on my iPhone is this:
Stocks in U.S. Advance on Rate-Cut Speculation; Wal-Mart, Home Depot Rise
Now let me tell you that the effective Fed Funds Rate has been 0.23% in the past few days. What do those banksters want - free money? Pathetic! May I also point out what happened two days ago when they cut rates abroad? The market dropped by over 400 points.
Anyway, Berk and I are loading up on the usual candidates (FSLR, GS, BIDU, AAPL, GOOG, MA) - if the Yen pivot at 1.0217 breaks it’s rock & roll time!
UPDATE 11:21am EST: Here are some retracement levels for you leeches:


UPDATE 11:31am EST: Someone asked for a Yen chart - here is a good example of the inverse correlation to the Dow and how to time tops in combination with other indicators of course.

UPDATE 12:42pm EST: I’m on the fence right now. IF we breach today’s highs I will probably cut my open puts and take a step back. The Yen seems to have a hard time breaching its pivot.
UPDATE 1:16pm EST: I have to confess, I don’t like this tape at all today. Cut my puts about 10 minutes ago - personally, I don’t like how the Yen keeps bouncing off that pivot. I have no compunction about jumping back in if we finally breach that pivot but so far no dice.
UPDATE 2:23pm EST: Okay, the Obama presser is coming up - this should be interesting. I still have no clue as to where this market wants to swing. Might just call it an early weekend if this chop chop chop continues.
UPDATE 3:25pm EST: Well, I jumped back into my puts on the NQ 1264 pivot retest. So far so good - market seems to have picked a direction, but I’m still on guard.
BTW, I want ALL of you leeches to point up Berk today, who has been a stone-cold SOB of a trader and stood strong despite the market punishing him hard while it was racing up. I’ve said it before and I say it again - I still have to meet a better trader. PERIOD
UPDATE Closing Bell: As you may have suspected, I got whipsawed to hell in the last hour. Today’s market has almost been impossible to trade and was busy chewing up bears and bulls alike. I didn’t heed my own line in the sand to wait for that pivot in the Yen to break. Thus, I ended up down for today, not that much but enough to really piss me off. Need to pour over my charts and see where we’re at. Will post later this weekend.

[ 本帖最后由 hefeiddd 于 2009-4-1 07:07 编辑 ]
金币:
奖励:
热心:
注册时间:
2006-7-3

回复 使用道具 举报

 楼主| 发表于 2009-4-1 06:40 | 显示全部楼层
November 6th, 2008 11:53 pm Market Forecasts, Trade 84 Comments

It is my personal view that wave [V] down has indeed started.  However, at this juncture, I am not sure if it is the final move in the intermediate [(3)] down, or the last stage of the infamous [3] of [(3)]. Either way we would expect some more consolidation after the move is complete.  My view is that the move is most likely [V] inside of [3] of [(3)], due to the lack of divergence on the daily chart.  I will be watching closely for a divergence on BOTH the daily and hourly before I think the decline is done.  Right now, I believe we are almost complete with wave down of [V] of [3] of [(3)].


For anyone that does not believe in Fibonaccis, take a close look at the past 2 charts.  Notice how the fan I have drawn acts as support and resistance at almost every single major pivot.  I am looking for a 400-600 point rally coming in after another low.  This rally would be either wave [ii] or wave of [D] of the triangle (which I find the less likely count).
The breadth on the past 2 days has been 9:1 (or more) negative, and with selling volume absolutely crushing buying volume.  My view on this is that the breadth most likely indicates that this is still an impulse wave down, and not part of a corrective move of any sort.  We shall know soon enough, but the final piece of evidence that supports the wave [V] down scenario is that we are falling in 5s.
Here is a little chart of FSLR in case any of you missed my thinking on this move.  I sincerely hope you all cashed in dearly on this, as it has been one sweet move….so far.  More to go?  My targets are working their way down in $10 increments, projecting a final low into the low 90s.

And this is the same thing on MA.  Entries at support (resistance) and exits at resistance.  Final target on this puppy is into the 110 range.  Now don’t go bonkers here if you have missed these moves.  MA would offer a great entry around 150, or even better at 155 as there are very strong resistance levels there.

That should do y’all for tonight.  Expect a nice rally after those horrible  economic numbers tomorrow.  I will be fading it as soon as I seen waning momentum.
Skål!
金币:
奖励:
热心:
注册时间:
2006-7-3

回复 使用道具 举报

 楼主| 发表于 2009-4-1 06:41 | 显示全部楼层
November 6th, 2008 10:15 am Intraday Update 179 Comments


UPDATE 10:15am EST: Take pofits now - we are at an strong retracement level. We can always grab more contracts if this one is being broken.
UPDATE 10:43am EST: I just grabbed a GOOG Nov 300P.
UPDATE 11:00am EST: I closed GOOG for a $10.- profit - LOL
UPDATE 11:07am EST: I feel like I’m on fire today - this market reads like a book (except the TNX, that faking out little bitch). Anyway - watch the 930 pivot/retracement on the SPX today. If we breach that it’ll go to 913, otherwise I think we are either going sideways or put in a little rally later in the day.
UPDATE 11:24am EST: I just want to point out that the market DROPS after consolidated rate cuts in Europe and Australia. We have slowly shifted down from a rate cut (here or in Europe) causing a month long rally, to a weekly rally, to a one day rally, and now to a drop on the very same day. The market now knows that rate cuts make zero difference in affecting economic fundamentals. And that is what the market is focused on right now - GOOD - that’s how it should be.
UPDATE 12:24pm EST: Well, what do you know - we actually made it to the 913 pivot - wow! Yes, would have been nice to hold all the way to here, but I’m happy with what I got. Now, my focus is on that particular pivot for there is not much to hold if we drop through this one. If we do I’ll probably load up on some index puts.
UPDATE 1:14pm EST: 913 on the SPX broke and there’s not much underneath. So, I’ll be adding puts here as we drop. Yen also seems very strong today and the TNX keeps dropping right now - probabilities are in favor of market dropping further (right now).
UPDATE 2:06pm EST: FYI - once/if the Yen breaches its lower pivot around 1.0226 I’m buying index calls. Things seem to be lining up for a late day rally, but I’m not super confident just yet (see above ;-)) Let’s see what the Yen does - it’s pretty overbought on a short term basis and if it drops the market should try a little reversal here.
UPDATE 3:28pm EST: I wish I could do that for real - the whole Parkour movement has me fascinated:

In other news - we just made new lows on the Dow - I’m not holding anything as I don’t see an entry. I might do a quick scalp with some DIA puts, that’s all.
UPDATE Closing Bell: Great day everyone - hope you leeches banked some coin. Kudos to Gumbo for proving me wrong on UA - nice job - seems short term stochastics didn’t matter after all. Hey, remember all the crap we were getting for being ‘negative’ just 3 days ago? Well, the market has dropped 1000 points since then - who’s your daddy now?
Anyway, I’m all in cash now - don’t really care what happens to the job report as I think we might get some kind of rally. Berk will do the update tonight and it’ll be a good one.
UPDATE 6:35pm EST: This one is a tribute to T.B. Aurelius

Just kidding of course - we’re all glad you keep coming back.
Decision Time!November 5th, 2008 11:17 pm Market Forecasts 51 Comments

Yes, I am aware the presidential election is over, but we are nearing an important fork in the road that will reveal the direction of the market for the weeks to come. As you might suspect, the choice is between bearish (my favorite) or bullish (my second favorite).


Berk and I have been trading fairly lightly in the past week as the wave count offered various possible scenarios as to the medium term direction of the market. Monday we recognized exhaustion in various trend indicators and entered into a few short positions, which we rode through yesterday’s rally. Our fortitude was of course rewarded today, although today’s tape (despite offering no surprises) was a bit annoying.
Anyway, at this point I think we can simmer it down to two main probabilities - not too much has changed since my last forecast on Monday. Scenario A means that we still tracing out the dreaded triangle, which would indicate that we are completing {d} of minor 4 of intermediate (3). Scenario B means that we are already in minor B of intermediate (4), which of course is an extended bullish consolidation. In short term the direction is down as we should descent a bit further tomorrow. As I mentioned on Monday, the point of the reversal will give us some indication as to which of the two scenarios is unfolding. If we break earlier (the orange line) and breach through the upper border of the triangle (about 970 on the SPX) then there is a very good chance that we are tracing out Scenario B. If we continue downward (blue line) and bounce off the lower triangle border (about 880-890, plus there is  a weekly long retracement level around 886) then I would give more credence to Scenario A. Right now, my dear steel rats, the probabilities on both scenarios are about equal.

We of course knew that the market was insanely exuberant on Tuesday as that rally was running on fumes. First money was clearly moving back into bonds, as 10 year T-Note yields were plummeting. Today, this trend happily continued, which in part helped drive equities lower. Note that we are below the psychological 3.7% line again. This is good for the bears.

Then there was the McClellan Oscillator painting record highs - it’s come down a little today, but we are still officially in overbought territory. My medium stochastics on all averages have however burned down into the 20s today, which is also giving credence to the little bounce I expect sometime tomorrow. Obviously, if you are an avid user of stochastics, you know that the indicator can crawl around below the 20 mark for quite a while, which is exactly what happened during the large drop in the first half of October. But you can interpret all those indicators in various ways right now as conditions have been extreme on both spectrums in the past few weeks. So, I am very careful to read too much into them, but they do help me to point to high probability entries and exits.
There is however one indicator that has been very reliable when it comes to determining the medium term trend and it’s the spread between the Moody’s BAA Corporate yield and the 30-year T-Bond yield. Well, it has been widening again and is back at 5.35%, which supports the bearish case.


The one big fly in the bear soup however is the chart above which also reveals the ‘mystery indicator’ I teased you leeches with the other day. It’s a plain old weekly stochastic (5,3,5), and as is apparent by connecting all recent lows with bottom crossovers it’s extremely accurate in predicting turning points (on the tops as well I might add). For some reason I rarely see traders use the stochastic on a weekly chart, don’t ask me why. I personally spend much of my time experimenting with charts and indicators (yes, I need to get a life), and I am almost fanatic in my never-ending quest of finding the ‘holy grail’ of all indicators. Perhaps truth is in simplicity however - and unless my trusted stochastics is wrong this once then it might just be that we bears will be greatly disappointed. For the signal right now is clearly pointing upwards and we would need to see this line swing downwards in a very short order to assure us Scenario A presented above.
So, yes - I’m admit that I’m a bit torn right now - not sure which side will win out here. There is a lot of evidence supporting the bearish case, but that weekly stochastic is rarely wrong. Well, I hope this time around it is - would be fun to get one more slide to the downside, wouldn’t it?
This is all I have for my disciples today - it’s been a long day for me and I actually planned to make this a lot shorter. Yeah, that never works out it seems - LOL. Berk and I will keep you guys in the loop tomorrow as we still have various puts in the run which we plan to close out shortly. Let’s however not forget that we are getting the  on Friday, which should be very ugly. Thus, being the vultures that we are, Berk and I would prefer to hold our puts into Friday morning, but depending on what transpires tomorrow we might have to cut and re-entry.
Cheers!
P.S.: If you are not too tired after reading all this, please go over to Karl Denninger’s place and peruse his  on who exactly responsible for the mess we’re in - it’s a must-read it.

[ 本帖最后由 hefeiddd 于 2009-4-1 07:10 编辑 ]
金币:
奖励:
热心:
注册时间:
2006-7-3

回复 使用道具 举报

 楼主| 发表于 2009-4-1 06:41 | 显示全部楼层
November 5th, 2008 10:07 am Intraday Update, Trading 184 Comments

UPDATE 10:01am EST: Hope you guys all enjoyed yesterday’s election coverage. Today’s weather chart indicates that we’re in for a churn in the morning, following by some descent in the early afternoon:


Watch the ‘churn zone’ which is caused by the 990 retracement level, as well as the 996.5 and 986 pivots in the SPX. In the NQ we have 1353 and 1366, in the YM 9454. The lighter lines are weekly retracement levels, and the bolder lines are the daily ones. Of course there are the fibs to watch as well, which were conventiently added for your lazy leeches.
Check in regularly as Berk and I post our favorite victims - the first one I grabbed this morning was PBR. IN the previous post Berk also suggested some of our old favorites: BIDU, MA, GOOD, CF.
UPDATE 10:31am EST: Here we go again - TNX has pulled back a little and we continue to push up on fumes. If we breach 1000 on the SPX the next reversals are indicated on the chart. But I would have no compunction about grabbing some DIA calls if we do - no sense in fighting the market. Let it rally if it wants and use it.
UPDATE 11:14am EST: Berk and I just grabbed BIDU, we also think MA is good once it drops a bit more (developing into a nice island top).
UPDATE 12:47pm EST:Berk here, and this is the chart that I posted last night.  And here is what the chart actually was.  Yes, I was a little tricky, but it was BLATANTLY apparent to me when I sat down last night to check it out.  Thanks for the few of you that tried.  I give you a lot of credit making conjectures off of charts with little or no data.  Well Done!!  And special thanks to CC, who not only had a good answer, but had a comeback question for me.


And after today’s 300 point drop, it becomes more apparent what I was trying to illustrate.  Again, thanks for playing.
UPDATE 2:53pm EST: Okay, the last two hours having been a bit frustrating as all we’re seeing is chop chop chop. Berk mused that we all will be chefs by the end of the day - LOL. Many of you leeches might be wondering if we should take profits here. I frankly am not sure right at this point - I would probably want to buy some DIA/SPY calls instead if we don’t breach the 1326 NQ and 970 ES pivots. However, if we keep chopping all the way toward the closing bell I might be tempted to grab my profits and wait things out.
UPDATE Closing Bell: Today was a good day in terms of profits but I absolutely hated the tape of the last three hours. Not only did I get faked into buying a DIA hedge which I wind up dumping too late as I had to step out for five minutes - but WYNN also suddenly spiked up towards the end, taking out 50% of its profits in a matter of 2 minutes. Berk and I decided to dump it, the spread widened massively, and I got a very lousy fill, after which it made a u-turn and dropped again. What a pisser! I really start disliking those options as the MMs are crack smokers and you can be assured of being able to drive a truck through their put spreads when WYNN pushes to the upside.
I didn’t have enough time to take profits on MA, BIDU and FSLR due to the last minute fake out action. I knew we would drop further and thus didn’t want to sell on the spike and was burning time. I’m okay with MA as the island top looks very juicy - if it goes against me tomorrow I think the gap below is worth the risk. BIDU and FSLR seem to have some downside left in them but the market is getting very close to a bounce so if we don’t push up overnight on the ECB news then I’ll be quick to trake profits.
That’s it for now - I’ll do a very brief market update later tonight. It’ll be short as I’m burned out - need to hit the gym and recharge my batteries.

[ 本帖最后由 hefeiddd 于 2009-4-1 07:12 编辑 ]
金币:
奖励:
热心:
注册时间:
2006-7-3

回复 使用道具 举报

 楼主| 发表于 2009-4-1 06:44 | 显示全部楼层
November 4th, 2008 10:24 pm Market Forecasts, Trade 53 Comments

We got a nice election rally today.  $INDU rose up 305 points, right into diagonal resistance, and just cracking into my target range.  What is even more exciting than that is the divergent momentum on which we are rallying (had to edit that for my English teacher (holla!)).  What momentum indicators are those?  Well, you should know my “standard” MACD is divergent (both histogram and 2-lines), ATR is horribly divergent (this could be due to the boring action we have been having, but can also be used to support waning strength), as well as a few others I won’t mention.
$INDU 60d/60m

We are also poking the upper bollinger band, and with this amount of divergence, another close inside (assuming we get back outside) would be a quality entry.  I will touch on that most likely sometime this week.

There are similar conditions in the $NDX… Outside 2.0BB, divergent MACD, divergent ATR, approaching resistance, and barely into target range.  As it stands to me, the $NDX is painting the most clear wave pattern, and that is a simple flat.  As you can see from there chart, the lines hardly need moving.   I do expect a push higher, likely to 1400, and we will take it (most likely down) from there.  Should the $NDX manage to scrape above 1430-1450, it will be very hard for me not to resist shorting (buying puts) some high fliers.
I want to put in a little blurb about the $VIX, but I do not have a chart prepared.  I have gone back to all data and gauged the weekly (using closes) range of the $VIX in the 2000 Bear market.  The UPPER boundary of that range is right around the 46 level (i.e. we are are retesting resistance from the topside before it becomes support).  The most notable thing by far that happened today was with the $VIX however.  We pushed outside of the 2.0 BB, but failed to close with that level.  What does this mean?  This is the precursor to my standard sell signal (which is immensely more accurate than the buy signals).  Should we get a close outside the 2.0, I will be the first to let you know.  But, sell signal or not, the $VIX confirms that the emotions of the herd have swung very quickly from the most extreme fear we have seen in decades (if not ever), to levels now considered “under the norm.”  Though the $VIX has been cut in half in less than 10 days, so it is quite remarkable that the BBs have allowed mid-40s to be considered sub-normal.  As I said, no chart now, but should we get the sell signal, I will be extremely happy to post my standard $VIX chart.
Okay…Nobody call me crazy.  I am seriously going out on a limb here so you guys can see how my brain works.  I am going to post a “chart” below, and you guys let me know if you can follow my logic, or if I am completely bonkers.  Think about this from a fractal perspective, knowing that markets move in similar “patterns” of different “size” with slight variance in time or “shape.”  That said, put you beer goggles on and gaze in wonder (Note: Beer goggles are NOT required).  If anyone can tell me what ticker and what days I am looking at, I will be modestly impressed (I would like to think I have made it a little tricky).
Chart Comparison (Beer goggles optional)

So what is it?  Can you see the similarity, or are you all currently fleeing from the blog because you think I am a complete nut (if you flee now, you will miss some good trade ideas)?
And now to assure you that I am not REALLY crazy, check out CCJ.  Fits the same bill I have been laying out all through this post… divergent (MACD, ATR, Volume), outside BB, at resistance, and is also rallying in a nice channel.  A push up towards 20, and I will be buying up puts.  If we don’t make it that high, I will be forced to trade the break-out move.
CCJ - Bounce or Break!

One last gem for the road is CHK.  Nice ascending triangle in a downtrend (i.e. bearish wedge).  Stiff resistance around 24, and highly divergent on MACD, ATR and volume (are we starting to see a pattern?).  Again, two buying ranges here, one is the aforementioned resistance at 24, the other would be a break of the rising resistance line which should pass through 21  (and higher) tomorrow.  Two targets on this guy too.  A secondary resistance cutting through the 17.50 range, and the previous low of 12, which would represent a 50% decline from an entry at 24… Any takers?
CHK - 60d/60m - Rising Wedge

Given all the ideas we have thrown out there today, y’all should have plenty of homework to do.
Skål!
金币:
奖励:
热心:
注册时间:
2006-7-3

回复 使用道具 举报

 楼主| 发表于 2009-4-1 06:45 | 显示全部楼层
November 4th, 2008 10:54 am Intraday Update, Trade 203 Comments

Update 9:45am: I saw some nice upside this morning.  Momentum seems pretty weak (as we would expect), and many stocks, as well as the indexes, have traded nicely into resistance.  The one that stuck out the most to me is BG.  Up 10% already, right at equality, as well as horizontal support, and diagonal support from a fib fan.  She’s a beaut…  I will likely be taking down the 45s when I get done with this.


I also like the way FSLR is looking this morning.

These are great examples (IMO) of moves that will likely be reversed in the afternoon (or next day or so).  For the record, one order has been filled on BG, and FSLR orders are going in now.
Skål!
UPDATE 10:21am EST: Mole here. It seems that we are approaching the turning point I outlined in yesterday’s SPX chart, which is the 993.5 area. If we breach this one with confidence and push higher I will probably cut the puts I’m holding.


UPDATE 10:52am EST: Just FYI - I did not sell my puts yet. Waiting for 1005 and 1025, the next retracement levels. If we bust through those I might have to accept the fact that this market will keep rallying on vapor. But I usually am not eager to cut my short positions when I see the market being in a super overbought condition. After all, this is when you sell the rip, not buy the rally.
UPDATE 11:12am EST: Berk and I just grabbed FSLR 145 puts. I know we’re nuts but that’s how we roll.
UPDATE 1:13pm EST: One of the reasons I have suspicions that this rally is running on vapor is the TNX, which has been dropping and continues to do so. I won’t be as bold as to call this the high, but this alongside with my momentum indicators has been the reason I have been staying put (pun intended).
UPDATE 2:17pm EST: FYI - $TNX is down HARD - right now at 3.8%. Almost dropped 1 point today - if it keeps this up I see red for those bulls.
UPDATE 2:41pm EST: $TNX now down 1.28 points - it was briefly at 3.765%. Frankly, I’m not sure what is holding up the this market right now.
UPDATE 3:35pm EST: Momentum seems bullish at the moment, despite the TNX painting an ugly candle at its close. Who’s reloading puts here? Berk and I like CNQ, maybe at the closing bell.
UPDATE 6:36pm EST: When I was talking about the market being overbought I wasn’t kidding:

Cheers!

[ 本帖最后由 hefeiddd 于 2009-4-1 07:14 编辑 ]
金币:
奖励:
热心:
注册时间:
2006-7-3

回复 使用道具 举报

 楼主| 发表于 2009-4-1 06:46 | 显示全部楼层
November 3rd, 2008 11:47 pm Market Forecasts, Trade 40 Comments

Booooriiiiiing!!!

Boy, today’s tape was mind-numbing - almost as bad as Friday’s mental torture. I’ve said it before and I’ll saying it again - I can’t wait for this election to finally be over and done with. In my mind it really doesn’t matter who actually will become president tomorrow as it should have very little impact on our economic outlook looking forward. Again, this only relates to the markets - in respect to the future of this country this might actually be the most important and historic election you will ever participate in (assuming you’re a yank and weren’t too lethargic to get your fat ass registered). Whether you care about politics or not, the market is taking a wait & see attitude and I expect the coming days to be more interesting. I’m running a bit late here, so let’s dispense with the formalities and get right to the charts.

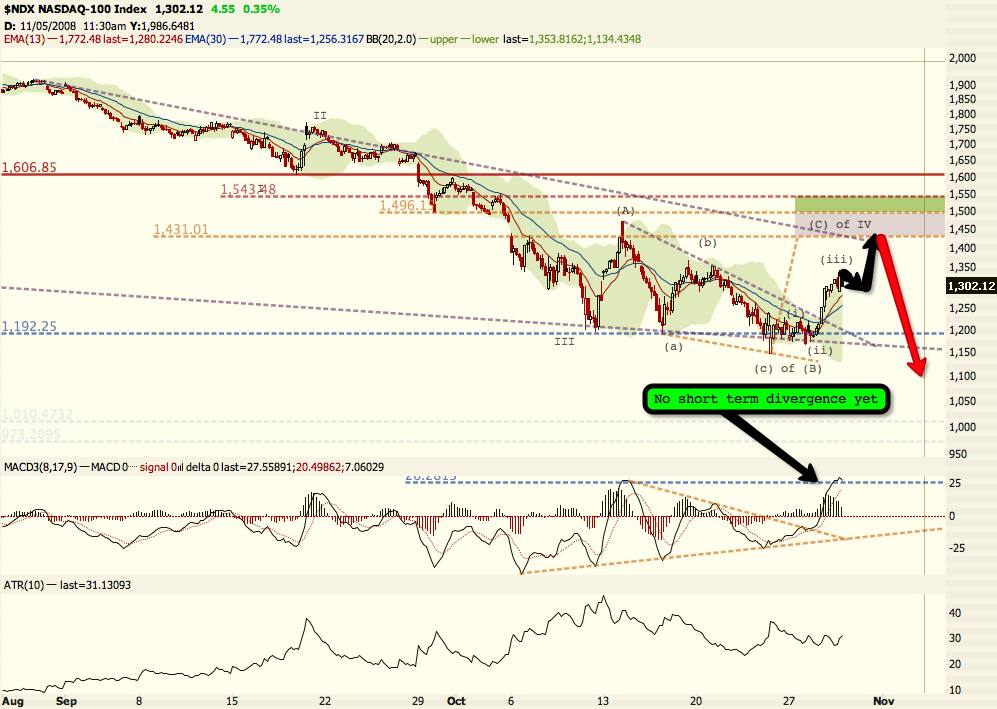
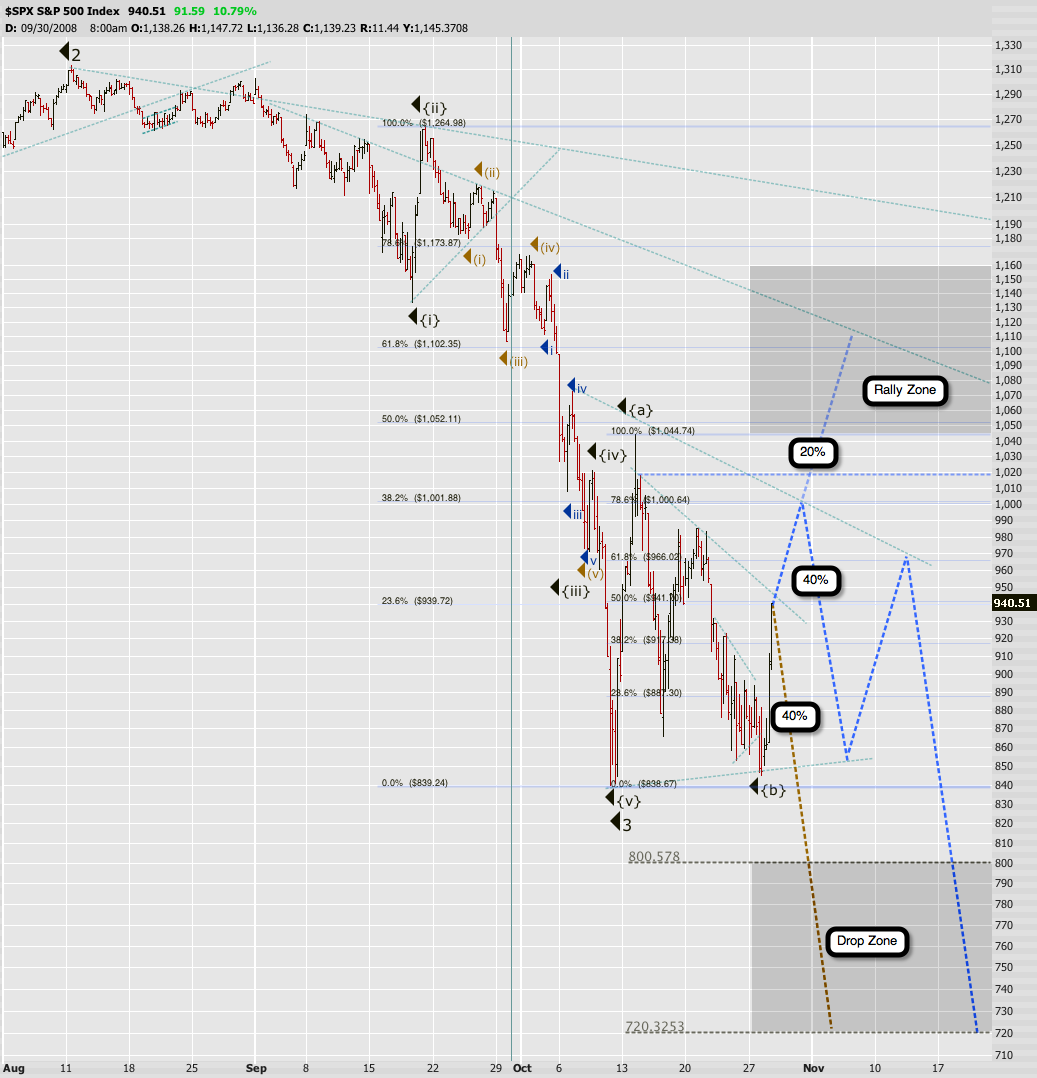
I know it’s messy, let me walk you through it. I see two main probabilities here, both of them incur a drop probably starting tomorrow or Wednesday (indicated by the red line). Both scenarios also rank about the same in terms of probabilities as indicated by the percentage bubbles.

It seems that the market is going to embark on a large move towards the middle of this week, and it’ll be either to the upside or downside. I guess most of you suspect this much, and the only question remaining is where the fork in the road is going to be. Based on the momentum I’m seeing in the market right now (more about that later), we are overbought at the moment and thus I do expect a pullback and that soon. Where the pullback occurs, in my mind will also give us some indication as to which scenario is most likely going to play out.

  • The Rally: Based on the fibs, which are also fairly closely backed up by 2sweetie’s retracement levels, we should reverse to the upside around 912 or 886 on the SPX. After pushing through 969 again (which is strong resistance) we would probably bounce off of 1025, retest 969 and then proceed up towards 1075. Berk talked about this early this morning as well, and I will post another chart.
  • The Drop: A.k.a. the triangle we discussed last week. I think the earliest we would reverse towards the upside would be 886 to complete wave {d}, but I would get more confident if we push towards 860 or a bit below. After that {e} would top around 855 (completing 4 of (3)), after which we would embark on 5 of (3) most likely ending around 754 (another retracement level).
Obviously, entertaining the rally scenario indicates that I suspect that wave 5 of (3) has ended on October 28th, in would then appear to be ending diagonal. I have considered that idea briefly last week but didn’t take it too seriously. However, the momentum last week has been very bullish and we don’t want to limit ourselves to the bearish side when the market presents us with evidence that we are tracing out more than a short consolidation rally.


If we forget about Elliott Wave Theory for a second, here’s another way to look at the recent market activity. This was sent to us by one of our members (I forget who it was, please make yourself known so I can give you credit), and the idea here is that we might be tracing out a Head & Shoulder pattern. Strangely enough this would almost be identical to the rally scenario and wave pattern I presented previously. Food for thought - and this chart is actually why I am assigning both wave counts the same probability.


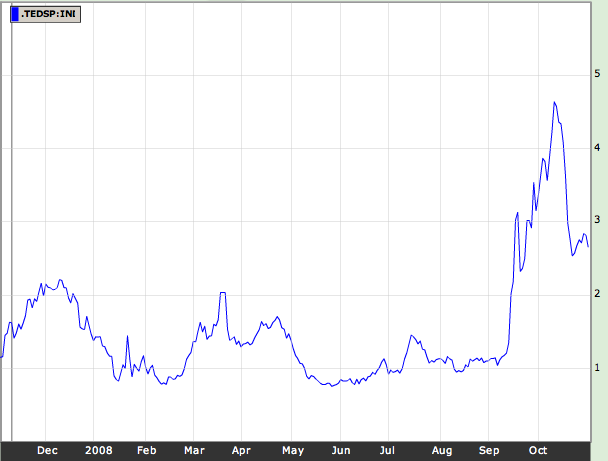
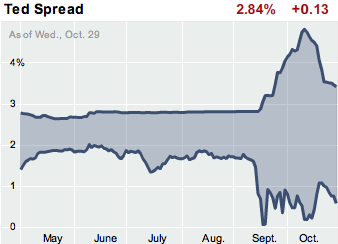
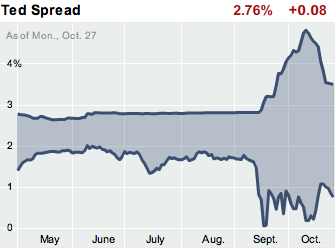
Exhibit A: The TED spread - it’s narrowing and is pointing down. We can debate about the fact that it the only reason this is happening is due to central bank guarantees, but that doesn’t change the fact.

Exhibit B: Spread between Moody’s 3 month Corporate BAA yiels and the 30-year T-Bond yield - has also narrowed to 5.18% (sorry, I don’t have a chart for that since I have to do it manually). I know, that is not a huge decrease, but it’s starting to move up. Frankly, what has triggered the narrowing is that the TYX has gone gangbusters last week - it’s at 4.369% today. The TNX also has been melting up and bonds find themselves at a support line right now. If they breach that line in the coming days this yield spread should narrow even further and I expect that a rally in equities will play out. If the line holds and assets are flowing back into T-Bonds then I expect this spread to widen again quickly, since the Moody’s yields have actually been on the rise. A widening spread would give credence to the triangle/drop scenario above. Hope all this makes sense to you lower leeches.


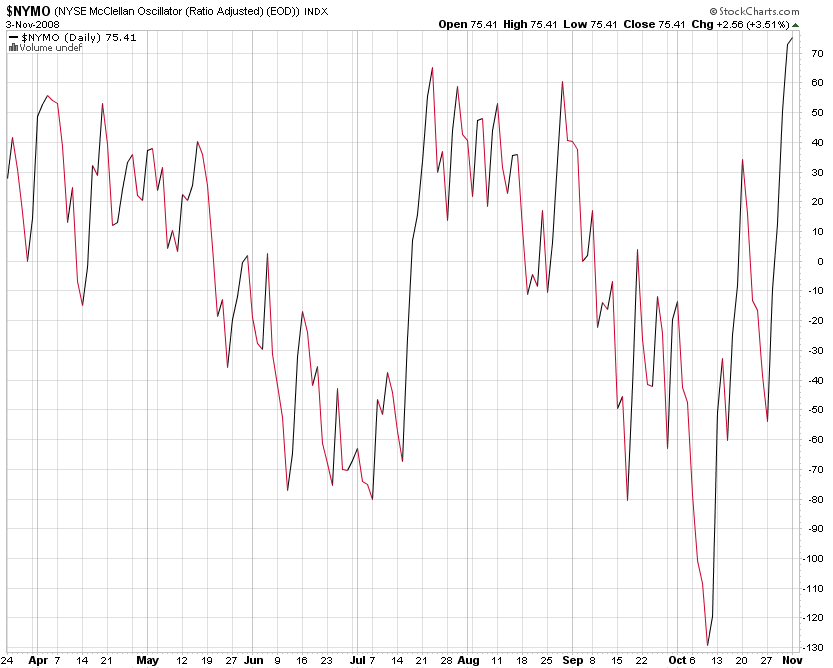
Exhibits C, D, E: Most of my stochastic and MACD indicators on various charts are screaming overbought right now. All the indexes are way overbought on short and medium term basis. Another indicator many of the pros use is the NYSE McClellan Oscillator shown above. If you ignore for the moment the long spike down it becomes clear that 60-70 indicates an overbought condition while -60 to -70 means that the NYSE is due for a bounce (like about two weeks ago). Well, right now it’s ringing ‘overbought’, giving additional credence to my trusted stochastics.

But again, all these are medium to short term indicators, and although they suggest that a drop is coming, they do not discredit the rally scenario mentioned above. I just want to be clear on that - at the time we reach some of those ‘fork areas’ I drew out in my first chart many of those momentum indicators should be either in neutral or perhaps even oversold territory.

So, in conclusion, the next 2 days should be very interesting and probably a bit volatile, but in my mind not present much of a surprise. We proceed down and then the market will show us which way it wants to swing. We will keep you updated as things unfold and apprise you of any changes in how we assign the probabilities.

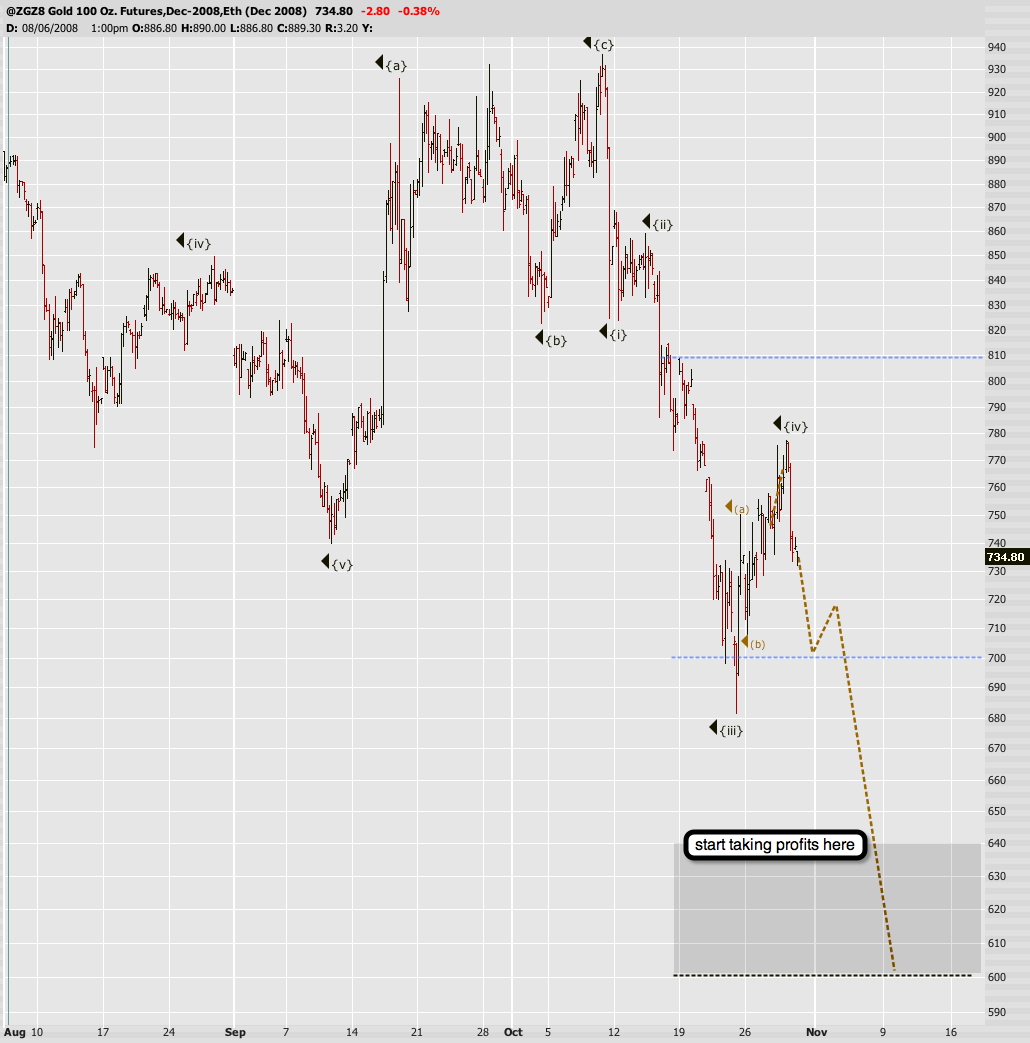
I have nothing to add to my last posting about Gold - it’s proceeding downwards and nothing has changed. I loaded up on some GLD puts and am prepared to give them a lot of leeway. Should we encounter a surprise rally that pushes up above some key levels I will let you know the minute I cut those positions.

I closing - I would suggest you keep your trading activity very light in the coming days. I myself picked up a few puts today in anticipation of a drop (go back to today’s intra-day posting for the symbols), but I will be very quick to take profits.


Whatever you do - go out and VOTE tomorrow, no matter who your favorite is. Always remember that many of your forefathers (as well as mine) gave their very life just so you can get your lazy butt off the couch, march to your local voting booth and exercise your your right to vote. Never ever take this right, as guaranteed by our wonderful constitution, for granted.

We the people - tomorrow we can make a difference!

Cheers!
金币:
奖励:
热心:
注册时间:
2006-7-3

回复 使用道具 举报

 楼主| 发表于 2009-4-1 06:47 | 显示全部楼层
November 3rd, 2008 12:47 pm Intraday Update 132 Comments

UPDATE 11:35am EST: I have seen this chart flowing around for some time now, but had not seen it with the levels as low as they currently are.  If you have not seen it, it will surely open your eyes as to how bad this current crisis ACTUALLY is.  Read ‘em and weep.
From a creativity stand-point though,  you have to love it when our Federal Reserve, which until this year had never had less than say 75% of its assets as treasuries, has decided to become a full-fledged bank.  As if we didn’t think that by bailing out buying assimilating these bad banks the Fed wouldn’t become one massive monolith of a bank.  But come on…Around 25% of it’s assets are treasuries.  Translation… 75% of what the United States Federal Reserve is holding is nothing more than straight BULL-SHIT.  Do I need to breakdown the shit into its more understandable alphabet soup nomenclature (I hope not)?
Simple but scary!

That said, the Fed, like any big bank, saw a chance to make a few quick bucks, and in doing so, has cast our entire financial system into a huge turmoil.  How do you think foreign countries would react if they knew our Federal Reserve had only 1/4 of its total assests as something tangible….  Food for thought.
Skål!
UPDATE 12:36pm EST: Mole here - the chart that really scares me is this one:

UPDATE 2:11pm EST: Berk and I have been nibbling on shorts. Here’s what I grabbed: AAPL, DHR, STRA, WYNN, POT, GLD. I also like RIMM at 55. All puts - yes
UPDATE 3:00pm EST: I like Basic Materials this week - they exploded last week and are taking a big hit. Here are some symbols for you guys to play with:
<SPAN title="cssbody=[tabchrtbdy] cssheader=[tabchrthdr] body=[ABX ACI AGU <SPAN title="cssbody=[tabchrtbdy] cssheader=[tabchrthdr] body=[ANR <SPAN title="cssbody=[tabchrtbdy] cssheader=[tabchrthdr] body=[APA <SPAN title="cssbody=[tabchrtbdy] cssheader=[tabchrthdr] body=[APC ARD <SPAN title="cssbody=[tabchrtbdy] cssheader=[tabchrthdr] body=[ATW <SPAN title="cssbody=[tabchrtbdy] cssheader=[tabchrthdr] body=[BTU <SPAN title="cssbody=[tabchrtbdy] cssheader=[tabchrthdr] body=[CAM <SPAN title="cssbody=[tabchrtbdy] cssheader=[tabchrthdr] body=[CF CHK CLR CNQ <SPAN title="cssbody=[tabchrtbdy] cssheader=[tabchrthdr] body=[COG CRK <SPAN title="cssbody=[tabchrtbdy] cssheader=[tabchrthdr] body=[DO <SPAN title="cssbody=[tabchrtbdy] cssheader=[tabchrthdr] body=[DVN EAC <SPAN title="cssbody=[tabchrtbdy] cssheader=[tabchrthdr] body=[ECA <SPAN title="cssbody=[tabchrtbdy] cssheader=[tabchrthdr] body=[EOG ERF <SPAN title="cssbody=[tabchrtbdy] cssheader=[tabchrthdr] body=[ESV <SPAN title="cssbody=[tabchrtbdy] cssheader=[tabchrthdr] body=[EXH FCX FST GDP HES <SPAN title="cssbody=[tabchrtbdy] cssheader=[tabchrthdr] body=[HP IMO <SPAN title="cssbody=[tabchrtbdy] cssheader=[tabchrthdr] body=[IPI <SPAN title="cssbody=[tabchrtbdy] cssheader=[tabchrthdr] body=[MEE MON <SPAN title="cssbody=[tabchrtbdy] cssheader=[tabchrthdr] body=[MOS <SPAN title="cssbody=[tabchrtbdy] cssheader=[tabchrthdr] body=[MRO <SPAN title="cssbody=[tabchrtbdy] cssheader=[tabchrthdr] body=[MUR <SPAN title="cssbody=[tabchrtbdy] cssheader=[tabchrthdr] body=[NBL <SPAN title="cssbody=[tabchrtbdy] cssheader=[tabchrthdr] body=[NE NFX NOV NUE <SPAN title="cssbody=[tabchrtbdy] cssheader=[tabchrthdr] body=[OIS <SPAN title="cssbody=[tabchrtbdy] cssheader=[tabchrthdr] body=[OMG OXY PBR PCZ <SPAN title="cssbody=[tabchrtbdy] cssheader=[tabchrthdr] body=[POT <SPAN title="cssbody=[tabchrtbdy] cssheader=[tabchrthdr] body=[PVA <SPAN title="cssbody=[tabchrtbdy] cssheader=[tabchrthdr] body=[PX <SPAN title="cssbody=[tabchrtbdy] cssheader=[tabchrthdr] body=[PXD PXP RIG RRC <SPAN title="cssbody=[tabchrtbdy] cssheader=[tabchrthdr] body=[SFY SII <SPAN title="cssbody=[tabchrtbdy] cssheader=[tabchrthdr] body=[SM SPN SQM <SPAN title="cssbody=[tabchrtbdy] cssheader=[tabchrthdr] body=[STR <SPAN title="cssbody=[tabchrtbdy] cssheader=[tabchrthdr] body=[SU SUN SWN TRA UPL WLL WLT XEC XTO
I also like FSLR - thoughts?
&laquo; Older Entries
Newer Entries
金币:
奖励:
热心:
注册时间:
2006-7-3

回复 使用道具 举报

 楼主| 发表于 2009-4-1 06:47 | 显示全部楼层
November 2nd, 2008 10:36 pm Market Forecasts 77 Comments

In general, stocks caught a bit of a rally this week.  Not surprising us though, as we were expecting a bit of a rally from Monday on.  On Tuesday, Johnee and I discussed the probabilities of a flat transpiring, and it still appears that is the case.  We remain in a “chop zone,” and the wave count would allow for the rally to be complete here, or with a slight wiggle down and then one last push higher, likely no more than 1450-1500.
Hourly $NDX

The technical picture is setting up nicely for a divergence on the next push higher.  The $NDX has been “lagging” for the majority of this rally, only closing up 0.06% on Friday, while the $SPX and $INDU closed up 1.54% and 1.57% respectively.  I have said many times in the past to watch the action of the $NDX, as it is typically a leading index.  I was strengthening into the last low, and weakening into this high, signaling a top is likely quite near.
Hourly $INDU

Here is a daily chart of the $INDU.  Notice that the MACD histogram is at its highest level in more than 10 years.  This type of divergence can be tricky.  There is a chance that this could be a bullish divergence, and that prices are going to explode higher, potentially much higher due to such a high value.  However, breadth has not strengthened by a similar (or larger) margin, as one would expect if Beanie’s call of seeing the heavens before year’s end were to materialize.
Daily $INDU

So, aside from Tuesday, we had a fairly calm boring week.  As we all know, the markets are poised for a fairly large move.  We still expect a drop, whether it be of catastrophic proportions or not remains to be seen.  Many people are expecting a quiet week until the election has been decided.  I could argue that both ways, so I will just see what the market brings us.
I continue to watch the same stocks, especially since most of them have rallied quite a bit.  In case you have missed it before…BIDU, BG, FSLR, MA, CF, POT, AAPL, RIMM, GRMN, GOOG, CHK, and CCJ.  The most notable new addition, however, is WYNN.  Now priced nicely at $60 (again), off of a nasty, but extremely unhealthy V-Bottom, with a MACD histogram divergence.  Granted, the IV is a little high with all months ringing in around 140% IV (+ or - 10%).  However, should WYNN spin down for another nice drop, the IV will likely push the 200%s.  Be careful with option selection, but there is plenty of potential for profit in this move…especially should we hit $28 again.
WYNN's horrible V-Bottom

That’s it for tonight folks.  Happy hunting this week.
Sk&aring;l!
金币:
奖励:
热心:
注册时间:
2006-7-3

回复 使用道具 举报

 楼主| 发表于 2009-4-1 06:48 | 显示全部楼层
October 30th, 2008 9:28 pm Market Forecasts 72 Comments

I’ll be very brief tonight - at least I’ll try to - we all know how this usually turns out. Today’s tape gave me plenty of opportunity to catch up on some tasks I had put on the back burner. Among other things I grudgingly relented to pressure and added that coveted medium term indicator the majority has been voting for (damn all of you!). I also produced two new and improved icons for the short term (daily) and medium term (weekly) indicators. Let’s do a quick icon roll call:
Up/Down:

When you see this icon it is expected that the market rallies in the morning but then descents before the close.
Down/Up:

When you see this icon it is expected that the market drops in the morning but then ascents before the close.
Mixed:

We don’t want to make things more confusing, but it has become apparent that the current market conditions are not always well expressed by the ‘mixed’ icon.
Sideways:

Sometimes we expect mostly sideways action (like today) and this is the icon expressing such a market. I loath sideways markets, but I do like this icon
Down:

That’s the theme icon for the bears and by far my favorite. Red means profits.
Up:

Bullish this means - and of course it’s green. Beanie’s favorite and we use it sparingly - at least for now.

On to the charts. Nothing really has changed since Tuesday when I posted this the first time, except for the percentages. Although today’s tape didn’t really get us anywhere the bulls seemed to control most of the action. The Yen was a trooper at first, giving us a shot at a bearish swing trades, but then fell apart after lunch - must have been some bad sushi.
However, buying was consistent and increased markedly in late trading. Thus, barring any catrastrophic news overnight, the triangle case scores the 50% tonight, which puts us into (c) of 4. 20% go to the flat scenario Berk talked about yesterday, which would require that we breach the upper resistance line I’m showing on the chart. But I’m still leaving a 30% chance for a drop into {iii} of minor 5. Why, oh why, handsome and omnipotent Mole, do we have to keep enduring the bearish plunge scenario while the market keeps pushing up?
Because the credit markets are screwed, for a lack of a better term. First, TED spread is not narrowing:

And the spread between the Moody’s BAA yield and the 30-year T-bond yield is holding and might actually be widening (again, I always have to wait one day for the data on the Moody’s) - I counted 5.22% this evening. Unless I see this puppy narrowing I have a hard time accepting the bullish case.

The Baltic Dry Index is screwed - nobody is shipping.

So, I would be completely bearish, if it wasn’t for my ’shiny mystery indicator’ which works on a weekly basis. It’s usually spot on and hasn’t failed me yet. And as you can see, to my chagrin it’s screaming that a rally is just getting started. Unless it swings down in a very short order I have to keep entertaining the notion that we might be pushing up from here.

At least Gold is doing what it’s supposed to - nothing really new to report here. You know the drill - grab short positions on GLD, GDX, or any other precious metal related ETF on rips. Start taking profits once we breach 640.
That’s all I got for my stainless steelrats tonight - tomorrow (or actually the weekend) should bring us closer to some much needed clarification. I would love to be able to disqualify one of the three scenarios above.
Cheers!
Bonus Clip for you Karl Denninger fans:
金币:
奖励:
热心:
注册时间:
2006-7-3

回复 使用道具 举报

 楼主| 发表于 2009-4-1 06:49 | 显示全部楼层
October 29th, 2008 5:45 pm Market Forecasts 78 Comments

I am trying to rush this out before I head out for the evening.  Today’s action was not so standard Fed in “feel,” that is, the fluidity of trading.  Normally on Fed days the trading is rigid, programmed large lots, especially right before they speak.   Today, however, trading continued, albeit on light volume, right through when they were supposed to speak, with only a slight spike.  Quite strange.
Aside from that though…Fed cut, stocks rallied, stocks get hit by freight train.  The last 5 minutes were a huge shock to the bulls, but, personally, I don’t think the upside is done quite yet.  Why not?  This is an updated version of the chart I shared with Johnny last night.  Check it out.

There is no real short term divergence.  I expect us to pull back some, but another push higher should complete the c wave of [4].  Otherwise though, volume was fairly weak, and breath was about 55:45 to the negative.  As it stands right now, we could have completed the triangle, with a slight throw-over or we push higher to finish a flat.  The triangle still unfolding is the third option at this point.  As we know, all 3 of these choices will send us lower in a wave [5] once they complete.
Since this is gonna be short and sweet, lemme finish off with a nice Hat Tip for the sweet part.  This goes to BX (with KFN in a close second), which single handedly added 5% to my IRA today (granted this is my largest dollar holding).  Way to rally like nobody’s business.  Looking later, I find that some insiders have been buying up shares.  They will be happy to know they are in good company.

Sk&aring;l!
TOS Rules!!October 29th, 2008 4:31 pm Market News 15 Comments

Do I have a treat for you guys - here are some screenshots Tom Sosnoff just showed of the new iPhone TOS app, which is soon to be released.


This is going to be SO COOL!!
金币:
奖励:
热心:
注册时间:
2006-7-3

回复 使用道具 举报

 楼主| 发表于 2009-4-1 06:49 | 显示全部楼层
October 29th, 2008 10:28 am Intraday Update 83 Comments

UPDATE 10:25am EDT: Nothing much to do but wait until about 2:00pm when we get the ‘word’ regarding the FOMC meeting. Obviously everyone expects a rate cut here - fundamentally it really wouldn’t change anything as the ‘effective fed funds rate’ has been below 1% for over a week now. But we need to keep up appearances, smoke and mirrors baby! Anyway, in the interim here are two reading assingments for you guys - you will be tested:
I like the sound of that one)
My favorite quote on that one:
[Millions of Joe-the-Plumber types] will be watching the official proceedings in the federal courtrooms with jaundiced eyes as they hunch in their tent cities, in the rain, sipping amateur-brand raisin wine bartered for a few snared rock doves.

This is Berk’s favorite quote from this one:
[The grizzly bear was wearing a ``Dow 10,000'' baseball cap when the index was still at 11,000. A large sign on the wall of Fleckenstein's three-room office suite advises, ``Protect Your Right to Arm Bears.' ' ]

Enjoy!
UPDATE 11:07am EDT: I forgot to mention - Gold futures reached equality this morning (c wave equal length of a wave) and I might just nibble on some GLD puts after the FOMC meeting. ZG/CG futures will have ceased trading by then but I think this is a pretty defensible position right here. Remember that it is extremely difficult to pick a good entry with Gold lately - it’s been extremely volatile and erratic. Sometimes it’s easy to get scared out of a position, so take nibbles and be prepared to lose a large part of your premium while you’re holding it. Trading Gold like equities doesn’t seem to work - you set a mental stop and it’s almost guaranteed to get hit, just to watch the metal take a tailspin a day later (or rally like mad if you were banking on the long side).
UPDATE 1:00pm EDT: Someone alerted me to an old resistance line in the NDX this morning - seems like it was breached just now:

UPDATE 2:44pm EDT: So, the mouth breathes got their coveted 0.5% fed funds rate cut. Life is fantastic now and all our economic problems are over - you heard it here first. BTW, may I point out that the 1.5% rate lasted for 21 days exactly - 3 weeks. The intervals between cuts are getting narrower. When are we cutting to 0.5%? A week from now after the election?
Anyway - not sure which way things are going to swing - my indicators are diverging again. I hate to sit here all week and not do anything but I don’t want to jump in unless I see a clear direction. Breaking the upper ranges and pushing through the lines I painted yesterday would give me more confidence.
UPDATE 3:54pm EDT: I just grabbed some GOOG puts.
Pop Goes The WeaselOctober 28th, 2008 10:57 pm Market Forecasts 68 Comments

I’m going to be fairly quick tonight, as things actually just got a lot easier on the charting front. First, after four failed attempts it was crystal clear to me this morning that we would not cave anytime soon. Glad I went into cash on Friday - great timing there IMHO. Anyway, the Yen had been ‘talked down’ overnight by the Japanese who are getting freaked out, and although it tried to rally a bit equities completely ignored that and kept on pushing blissfully higher. The situation in bonds is actually very interesting - somebody passed me this email which is currently circulating the City of London:
Gut wrenching declines in US and global equity markets during October coupled with bond market outperformance will undoubtedly require MASSIVE monthly asset rebalancing by US pension funds –- rotating OUT of bonds and INTO stocks. This may have a profound “short-term” impact on performance of risk assets since the required rebalancing appears to eclipse even the large rotation after the 1987 stock market crash. As a very simple example, we asked our quant colleague (xxx) to analyze a balanced portfolio targeting 40% domestic bonds (SBBIG Index) and 60% equities.
We assumed that the equity portion is comprised of 75% domestic stocks (MXUS Index) and 25% EAFE international equities (MXEA Index). The attached rebalancing calculations based on closing levels last Friday (Oct 24) suggest that US pension funds would need to reduce bond holdings by a WHOPPING -4.1% while increasing equity allocations by a corresponding +4.1%, all by the close of business at month-end on Halloween Friday (Oct 31).
Price action could be bloody scary given terrifying poor liquidity in these markets. For historical perspective, the second largest monthly bond-stock rebalancing rotation was 3.4% in October 1987. Most importantly, US equities did manage to stage a +10.5% during the last four trading days of October 1987 while bonds struggled. As it turns out, that marked the bottom for US equities for the next month and probably helped stocks find some needed footing in 1987.
Bottom line: BEWARE the potential bounce in risk assets due to bond-stock rotation this week. FX risk trades may also tend to recover a little lost ground.
I guess the secrets of high finance continue to escape me - stocks have sucked so fund managers are compelled to move their assets out of bonds to buy even more stocks. Some folks also mention the Japanese short sell ban plus the expected interest rate hike. Whatever - more band-aids on the pig won’t make want to kiss it. Nevertheless, money clearly keeps moving out of bonds, as the TNX closed at 38.2 today, which gives credence to the bullish case. Supporting the bears is that the spread between Moody’s BAA and the 30 year T-Bond yields appears to not be narrowing, which has been a very reliable indication of bullish rallies throughout the past few months. For instance, last time we the spread getting narrower was in late April and throughout May as we traced out intermediate (2) of primary {1} of c (a consolidation rally). Of course these things are not black and white and it is possible we keep rallying going forward and witness a narrowing of the spread as we climb wave (4).

Here’s a special chart for all of you Born Again Bulls out there. Baltic Dry Index is now in triple digits - nothing is getting shipped right now. I call that a perfect economic environment for sustained bull rallies

The U.S. Dollar TED spread also keeps widening again - meh, probably doesn’t mean anything, does it? Who needs inter-bank loans anyway?

Let’s look at my obligatory SPX chart. If any of you leeches wonder why I didn’t jump in on a 900 Dow point rally: Mainly because I still see a good chance for the triangle case to play out as shown above. The wave count obviously changes (to something else) after today’s tape. And there is actually still upside potential left if we happen to continue on that path - I give it a 40% chance as of tonight.
Another possibility is that we have been tracing out a larger series of 1,2s and that we drop almost immediately and don’t look back - I’m giving this scenario also a 40% chance. The remaining 20% go to what the majority seems to be expecting at this point - a monster rally that won’t quit. Not impossible no, but I cannot give it more than 20% as of tonight. If we push up tomorrow the probabilities would obviously be skewed towards the upper range scenarios.

Gold is actually starting to resemble something I can count again. I have taken the liberty to put up some preliminary labels - they might change of course going forward. Yes, I still think we hit 600 and it seems the downside move should continue once we reach equality on wave (c). FYI - if we push down from here I might have to revise the lower target, as commodities have the nasty habit of painting extended 5 waves. FYI - equities traditionally paint extended 3 waves; doesn’t always happen of course but a good example is our recent {3} of 3 of (3) in the SPX.
BTW, I have kept the long term trend set to down tonight, but if we start rallying hard I’m considering to change it to up. Although we are in a secular bear market which should go for years I want to keep the definitions useful for us option traders. And a multi-week rally would be long term for most of us, n’est-ce pas? However, if it would help to add a ‘medium term‘ indicator in between the current two, please let me know. Perhaps I should put up a poll, so I can gather a consensus. Let’s try the democratic round first, before I impose my will on everyone else. Just like when it comes to the House voting for bailouts, right?
That’s it - I have to attend to my spousal duties now - tomorrow should be extremely interesting. For the record: I actually am hoping for the monster rally as it would be making things a lot easier for all of us. But that doesn’t mean it’ll happen - one can hope of course. Until tomorrow my loyal leeches.
Cheers!
金币:
奖励:
热心:
注册时间:
2006-7-3

回复 使用道具 举报

 楼主| 发表于 2009-4-1 06:50 | 显示全部楼层
October 28th, 2008 11:32 am Intraday Update 89 Comments

UPDATE 11:17am EDT: Good morning my deer whipsawed leeches. Apologies if the site was down - seems like the server was overloaded. If EvilSpeculator keeps getting more and more traffic I might have to move it to a dedicated server at some point. Anyway - the market is doing the unexpected - as expected Frankly, unless you’re a crack-smoking daytrader, just stay out and watch the action.
Take a look at this:

Guess where the reversal happened?

I still have some usability issues with putting in those values, but have some ideas about that I’ll share with 2sweeties. Give it a shot yourself and let us know what your thoughts are.
For your convenience, here are the downside reversal levels:

UPDATE 2:40pm EDT: I’ve been quiet for the last two hours as I’m really not doing much on the trading front. Quite frankly, the risk/reward ratio right now is very low for an option trader, and even if we get a massive drop - unless you’re already positioned (and have been holding out through the rips) the pickings will be meager compared with the exposure risk. I rather wait for a clear sign that this wave down has terminated, and start taking on positions as we are pushng up. Berk and I will probably sell some bull put spreads on low beta stocks at first, and as we see Mr. VIX descent into lower altitudes grab some high beta options. This may be tomorrow or it may be next week - you can’t really force the hand of the market, and sometimes doing nothing is the best policy.
I’ll do the update tonight, once I wrap my mind around the various short term probabilities.
UPDATE Closing Bell: I checked over at the slope and it seems EVERYONE is bullish now. Strange - we are not even out of the triangle yet. Well, I hope I’m wrong here and we pop tomorrow and clear that triangle, but frankly I’m still suspicious. This just did not feel real to me. Again, if we clear the triangle tomorrow or Thursday, I’ll be happy to go long, but folks have been getting whipsawed out of their long positions for several days now, and just because they’re all high-fiving each other now doesn’t mean the 2008 bottom is in. I need evidence and a 900 point rally is a good start, that’s all.
Cheers!
&laquo; Older Entries
Newer Entries
金币:
奖励:
热心:
注册时间:
2006-7-3

回复 使用道具 举报

 楼主| 发表于 2009-4-1 06:51 | 显示全部楼层
October 27th, 2008 9:28 pm Market Forecasts 84 Comments

I gave Gagelle a rough time about buying call options for this rally earlier, but in reality, I wanted to know what you all were thinking, because I am having a hard time figuring what the most profitable way to trade this rally will be.  By nature, I am directional, so trading Iron Condors or Butterflies just hasn’t really appealed to my trading style.  So moving forward, I have about 3 choices: Buy stock (which is great if you have unlimited capital), buy deep ITM calls (again, which is great if you have unlimited capital), or sell bull put spreads (which is great if you want to limit your reward).
But when I saw the SPY options the other day that I know all of you would be buying and I saw this…I almost puked.
Say what!?!?

This picture was taken today, with the $VIX a little bit lower than it was on Friday, but come on!  I can’t pay $6 for time value on SPY options.  That is horrible.  Here is a little option math.  If I buy the ATM 85C on SPY, I can pay about $6 or $6.10 for it.  That is ALL time, about $0.25 a day for holding your option.  Now, price in that you need to see the SPY at or above 91 JUST TO BREAK EVEN, and you can see my issue.  If I wanted to see a 100% return in my option, I would need to see at least 97 on SPY.  Not that this move is unreasonable, just that I would really need to see well above 91 before I start making any money.  That is factoring in NO volatility crush.
That said, I think buying call options is out, unless you MAKE SURE your option has a very manageable amount of time for an ITM option (i.e. SPY options no more than $2 in extrinsic {and $2 is a lot}).  Buying stock would work well if you had plenty of capital.  Lots of the institutions have been using the double index ETFs (QLD, DDM, SSO), where leverage is 2:1.  Otherwise, Mole and I are compiling a nice list of beaten stocks for you to take advantage of.  We will release it once we think we have gotten closer to the bottom.
That said, where do we stand tonight?  Per usual, there are two-three nice looking counts.  Those would be the triangle still in progression, or that the markets move lower either directly, or after another wiggle higher.  From the pattern that I had seen until the final 1/2 hour, I would have leaned more towards one wiggle higher, but that close was pretty rough.  As it stands, I would rank a direct decline, a rally-then decline, and then the triangle in order of probability.   If we rally, we would be looking for a level between 8800-9000 (that still hasn’t changed, and is the same whether we are in the triangle, or about to decline).  If we start dropping, we would be targeting our previous lows (7900) and then the range of 7500-7000.  Easy enough.
$INDU options

Another viable option would be an ending diagonal that I suggested earlier, which is most prevalent in the $NDX.
Big Divergence

I would recommend selling off put positions on the way down as institutions will likely step in every 2%-3%  or so, making this a very choppy ride.  Breadth has been strengthening across a broad number of indicators.  So while I think there is still some down-side below us, I think you should be quite cautious, as a bottom could be near and the snap-back rally will be pretty big and likely, very fast initially.
Sk&aring;l!
金币:
奖励:
热心:
注册时间:
2006-7-3

回复 使用道具 举报

 楼主| 发表于 2009-4-1 06:51 | 显示全部楼层
October 27th, 2008 9:44 am Intraday Update 110 Comments

UPDATE 9:42am EDT: Be very careful for the next hour or so. TNX is pushing up again, and the Yen is dropping - this feels a lot like the routine we went through last Friday. I suggest you don’t yield to greed (or fear) and let the dust settle before you make a move in either direction.
UPDATE 9:58am EDT: Watching the action right now, I’m really glad I got into cash on Friday. The TNX has stopped moving up and is taking a breather around the Friday high/close, which is also the psychological 3.7% level. Yen is shot to hell on an intra-day basis - if we don’t breach the 8350 pivot on the YM or 877 on the ES, I might try my luck at a teeny weeny index put. Well, as, I’m typing this those levels are being tested - buying pressure still feels very strong.
UPDATE 10:08am EDT: Did anyone check out the cartoon on the right this morning? It’s hilarious!! R1 on the YM succeeded on the first try, then we bounced off of R2 at 8420, and now we’re re-testing R1 again. Watch these pivots folks:
  • YM: 8160, 8220, 8280, 8350, 8420
  • ES: 845, 857, 866, 877, 886
  • NQ: 1173, 1189, 1210
UPDATE 10:40am EDT: I just want to impress upon you leeches, that a crash was prevented for the 3rd time now. Thur/Fri/Mo the futures are down, Asia/Europe scores massive losses, and then a buyer steps in the second the market opens. Manipulation or not, we have not crashed and the longer we keep churning here, the more the probabilities start favoring the election day triangle I talked about yesterday. Either that, or the rally T.K. has been expecting. Again, a lot can happen in the coming hours, but this tape is strangely reminiscent of the past two days. I would strongly discourage anyone from taking positions unless we see a break in either direction. The pivots I posted should help - also compare last night’s chart with today’s tape and make your own assessments accordingly.
UPDATE 12:51pm EDT: If I still had bearish exposure I would be getting very nervous right now:
The bullish 'force' is strong today.

We might get a strong pop in a very short order, especially if we breach the 1210 pivot on the NQ.
UPDATE 2:44pm EDT: I continue to be amazed by how precise those fibs are when it comes to support/resistance levels:
DJI bouncing between fibs.

Tipping PointOctober 26th, 2008 8:32 pm Market Forecasts, Trade 59 Comments

If you think the last few weeks were crazy, then last Friday certainly takes the cake and borders the ridiculous. Watching the futures being halted before NYSE opened made us salivate as the prospect of insane profits seemed to be in our greedy grasps. But not so fast - once again primary dealers stepped in the very second the market opened and and spoiled the party by banging up the cash indexes; until about lunch time when everything started to flatline. Towards the end of the day there was a rally attempt but it failed, ending the day in an almost perfect a,b,c (marked in green below).
SPX at tipping point.

So now we find ourselves at a tipping point. Looking at the chart above, the triangle we expected early on has realized itself and seems complete from a technical point of view. However, looking at the tape from Thursday and Friday, it is now clear that a buyer lurks around the 850/860 level and will have to be overcome in order to trigger that last plunge to the downside we have been waiting for. There is a possibility that the triangle will get stretched sideways and will resolve after election day - it doesn’t take an IQ above room temperature to figure out what the game is here.
From a sheer wave count prospective the picture is distinct. I don’t think that we’re dealing with an ending diagonal here, which are found at the termination point of larger patterns, indicating exhaustion of the larger trend. Exhaustion is clearly not the present sentiment, at least judging by the vehemence and volatility of the past few days. What we are looking at is a textbook symmetrical triangle, which attempted to break right after wave {e} concluded. However, we need to acknowledge the fact that a plunge was prevented from occurring twice now, and we will need to see a successful attempt in a very short order now, probably tomorrow, otherwise the triangle will most likely stretch out towards the presidential election.
The areas and levels to watch are marked in pretty colors above - if you’re colorblind you will most likely get wiped out this week. If we stay in the yellow a plunge is imminent. Blue means churn galore, probably until the election, and if we push beyond the red a rally is becoming more likely. I have also marked preliminary targets in gray, for both the bulls and the bears. Although I’m mostly in cash after Friday, I’m still giving the bearish case a 65% probability - split between 40% going to the immediate plunge downwards, and 25% to the ‘big churn’ leading to election day.
I’m giving a sustained rally a 35% possibility as several indicators now are starting to shift in favor of the bulls. The spread between Moody’s BAA bond yields and the 30 T-Bond yields ($TXY) has started to narrow a little bit, from -5.3 to -5.17 (again, I do not have real time data on this, so this might have changed on Friday). Our trusted 30 year T-Note yield ($TNX) yield also pushed up hard after a brief plunge to the downside, which may be due to investors pushing back into equities to snap up ‘deals’. Of course the other (and in my mind more viable) possibility is that the Feds have been flooding the bond markets with short and long term paper, thus pushing yields up.
TED spread widening.

Supporting the bearish case is the good ole’ TED spread, which has started to widen again. Not by much, but considering that inter-bank loans now enjoy a liquidity guarantee by central banks worldwide, this is a bit unexpected (in a good way).
Baltic Dry Index doing a Wiley Coyote.

Also supporting the bearish case is another indicator I frequently look at - the Baltic Dry Index ($BDI), which has ‘enjoyed’ a 90% drop in a matter of 5 months. While the public watches the Dow, professional traders are watching the TED spread, Mr. VIX of course, and often also the Baltic Dry Index. If you’ve ever wondered what it costs to send a Capesize freighter full of coal from Ecuador to Rotterdam, the Baltic Dry Index is your number. Compiled at a 200-year-old shipping exchange in London, this index tracks prices on the world’s largest cargo ships. Bulk freight is the stuff that drives economies at the most basic level - grain, coal, iron ore - so the BDI offers a pretty good proxy for the overall health of global trade. If shipping is expensive, that means nations are hungry for raw materials, and economies are flush.
The current plunge can’t purely be laid at the feet of the banking crisis: A standoff between China and Brazil over the price of iron ore has shut down one of the biggest commodity trading relationships in the world. But frozen money is a big part of the story here, too. Shippers around the world rely on old-fashioned letters of credit to ensure payment, and banks just aren’t issuing them right now. Without that guarantee, no exporter in his right mind would load 90,000 tons of coal onto a ship and send it to another continent. As of right now, a growing amount of commodities are stranded in ports worldwide.
So, it’s fair to say that the credit market remains in a deep freeze and until we see some thawing here reflected by a strong swing up in the BDI I have serious doubts as to the probability of a sustained consolidation rally in equities as represented by the anticipated intermediate wave (4) of primary {1}.
Gold moving WITH equities lately.

Gold has been doing exactly what I have been proposing for months now. The now not so precious metal actually touched 680 on Friday, but snapped back - along with equities. It is very interesting how the once inverse correlation has now reversed as Gold is now moving alongside equities. Which is exactly what we expected would happen - even Gold is considered a risky investment right now (although it truly does not deserve that label) due to its past gyrations, which were of course PPT induced. However, another factor is that Gold is being regarded as a commodity and not as a currency right now, a common phenomenon during economic contractions. This will change once we enter the hyperinflationary period of this secular bear market.
We might see a sympathy rally in the next few days, but I remain confident that the target zone of 650-600 will be met, if not soon then by the end of November. At that point I might actually consider buying some physical Gold bullion or coins. It’s possible that Gold will drop a bit further, but the downside potential now appears to be limited.
There is no doubt that this week will be at least as erratic as what we have been witnessing as of late. My suggestion would be to limit your exposure to about 50%. Yes, fortunes will be made next week, but at the same time, a lot of folks will get wiped out. You don’t want to be all in as even a 50% participation will most likely meet the profit goals you have set for yourself. And if things take an unexpected turn, you still stand to trade another day. The good news is that the consolidation rally should be upon us in a matter of days or at least weeks. The option market is broken right now and I can’t wait until I see Mr. VIX below 40 again.
Keep it clean, don’t yield to fear or greed, and above all stick with your system. We are stainless steel rats and as such we will succeed, no matter which way the market swings.
Cheers!
金币:
奖励:
热心:
注册时间:
2006-7-3

回复 使用道具 举报

 楼主| 发表于 2009-4-1 06:52 | 显示全部楼层
October 23rd, 2008 12:07 am Market Forecasts 40 Comments

I just got home from some plans that ran late, so I am going to be quick.  Fortunately, there is not much new to talk about.  Our two primary scenarios remain on the table.  That is, the markets are tracing out a triangle ($INDU, $NDX), which is the more bullish of two scenarios.  Or, the markets are tracing out a series of 1-2s in a 5th wave (whether it be V or 5 remains to be seen, IMO).  The final option is that we are putting in an ending diagonal, but we appear to be falling in 5s and rallying in 3s, which would lend the most support to the 1-2s scenario.

Breadth was a solid 9:1 negative today, but volume was picking up as we approached the lower support levels, but not enough to let us break through today.  We should target around 1300 in the $NDX whether we are tracing 1-2s or a triangle, but either way, we should not breach yesterday’s high.  I wanted to toss out the ending diagonal as a prospect most people have not considered.  As it stands right now, this is the lowest probability of the three, but I felt it was worth mentioning.
I hope everyone was ready on that MA break of 145.  We got a nice push down, and I closed out 1 contract for nice gains.  I am still holding some, and will likely add again.  This is a 40 point move (about 30% in the stock), so I plan to take it as a couple of trades.  Initial target is 120, and the final target is around 100.  If you have not gotten in this trade, a retest of the 143-145 range would be a GREAT entry.  If the trade is not for you…don’t trade it.
That is all that I have tonight…hopefully I can post a few more gems tomorrow.  In the meantime, tell me what GNK, BG, FSLR, MA, ICE, CHK, and CCJ all have in common.  I am really curious as to how you will think they relate.
Sk&aring;l!
Intra-Day Update: Don’t Get Too Giddy Just YetOctober 22nd, 2008 10:16 am Intraday Update 149 Comments

UPDATE 10:13am EDT: Good morning evil leeches. So far the triangle scenario is playing out due to some ‘truthiness’ in the form of bad earnings sinking in. Don’t get too giddy though - the bulltarts won’t give up without a fight and it’s less than 2 weeks until the election, so expect the unexpected. For what it’s worth - I’m using every single rip to load up on puts. Mr. VIX just took the elevator up 10 floors - which does well for the massive amount of puts I’m holding, but makes my shopping spree a bit more costly. Anyway, don’t chase the market here - let it play out a little - I’m sure we get a sharp rip sometime today, maybe soon.
UPDATE 11:35am EDT: Okay, I’m getting really annoyed with TOS lately. I was just informed that $DXY (Dollar index) was not supported on Prophet charts anymore. That’s after they dropped Russell futures over a month ago. I mean we’re not talking some exotic foreign fund here - these are basic symbols. Would be nice to know what the Dollar index is when trading. The standard answer I get is to use TOS charts - fine, then my next question is why they are offering Prophet in the first place, just to let it wither on the wine? BTW, this is not a criticism of Tim or the folks over at Investools - obviously they have little control over how TOS runs their charting package. I simply love Prophet charts and want to use it more, not less. Am I overreacting here? Thoughts appreciated.
UPDATE 12:22pm EDT: I start seeing a pattern here lately: Bad news like lousy earnings reports or financial failures pushes futures down over night. Market gaps down, drops a bit more and then claws back up for the remainder of the day. Berk and Mole reload on the rips - rinse, lather, repeat. I frankly can’t wait until the elections are over and done with, no matter who gets elected at this point. Shouldn’t complain though - we’re i a triangle and this will keep going on until it breaks either up or down in a big way. My money is on down of course.
UPDATE 1:20pm EDT: BOOM!
BOOM

Cheers!

&laquo; Older Entries
Newer Entries
金币:
奖励:
热心:
注册时间:
2006-7-3

回复 使用道具 举报

 楼主| 发表于 2009-4-1 06:53 | 显示全部楼层
October 21st, 2008 8:11 pm Market Forecasts 76 Comments

In case you haven’t heard - Yahoo (YHOO) earnings disappointed tonight and just to sweeten the deal they also announced a cut of at least 10% of their workforce. Let’s see what that’ll do to their stock price tomorrow. Texas Instruments (TXN) earnings today outright sucked. The miss was bad enough, but their comments on forward demand were worse, and are probably responsible for the 2%ish sell-off in the Nasdaq futures this morning. Sun Microsystems (JAVA) dropped by 17% after reporting a loss and is hellbent of turning itself into a penny stock. Do they have a business model except for losing money? Sun sure has come a long way since it traded at $25 a year ago - you will not be missed.
The Yen strengthened a bit today and decided to give the bulls are run for their money in late trading. At the same time a large amount of money seemed to be flowing into treasuries, as the $TNX (30 year yield) opened half a percent lower at 3.82% and happily painted a nice long marabuzo, closing at 3.703% - a few ticks above the dreaded 3.7% panic line. Of course none of that kept the mouth breathers from buying, although I’m pretty sure a large part of that was driven by institutional action.
We finished the day pegged at the 9000 mark on very little volume, which I termed the ‘pre-election 9k pin’. I’m confident that level will be breached however, maybe even tomorrow. What spoils the party a little is Apple’s (AAPL) excellent earnings performance, posting an $8 Billion profit for this quarter. However, I can’t really be upset about those news - the last company I want to see disappear is Apple, especially as I’m a stone cold tech nerd and despise Windows. Steve Jobs is a freaking genius and without his creativity and vision this company would have been gobbled up by the collective (i.e. Microsucks (ISUK)) a long time ago.
The Feds seem to be draining the swamp again - I’m seeing reverse TOMOs to the tune of $25 Billion a day, which usually is the maximum - Monday they actually reigned in $50 Billion. In case you wonder what TOMOs or repos are - here’s the blurb from the NY Fed site:
The Fed uses repurchase agreements, also called “RPs” or “repos”, to make collateralized loans to primary dealers. In a reverse repo or “RRP”, the Fed borrows money from primary dealers. The typical term of these operations is overnight, but the Fed can conduct these operations with terms out to 65 business days.
Are they trying to crash the market? Or is this another ploy to squeeze another round of bailouts out of Congress? Better hurry - party time is almost over, only 2 weeks until the election. After that the pressure to act will be greatly minimized. In related news - the effective Fed Funds Rate today was set at 0.7%, less than half the target rate of 1.5%. Yesterday it was 0.6% - boy, you GOT to love free money… wish I could get those bargain basement rates. It might be worthwhile noting that the last time those rates were pegged that low was on October 10th, which coincidentally happens to be the day the market put in a new low. Something’s going on out there - not sure exactly what but my tea leafs are rarely wrong.
For the record, the TED spread continues to narrow, due to the interbank loan guarantees of central banks worldwide. It managed to close at 2.77, which is a far cry from the 4.63% it was pegged at on October 9th. As most of you know, this is good for the credit markets, and hence for the confidence of equity investors. However, at the same time the yield spread between the 30 yr U.S. T-note and Moody’s 3 month BAA bonds keeps widening and is now at a record high of 5.2%. That is extremely supportive of the medium term bearish case, thus there is a bit of contradiction out there in terms of market indicators. Which is why we always go back to what we know best - reading charts - as price is the ultimate indicator.
Looks like a developing triangle to me.

You’ll notice that my wave count differs a little bit from Berk’s but that’s only details as he suggested that we still may be tracing out wave 3 of (3). This is actually a very valid proposition, and the only reason I don’t bother offering a 2nd chart is that the end result would remain the same. The main difference is that the final bottom of his minor wave (3) would be even lower. I dare not to even throw out a number, the profit potential boggles the mind. However, sticking with my wave count above which assumes that we are in minor wave 4 of (3), the drop zone of between 800 and 720 is nothing to sneeze at.
The breadth today on the SPX was 6.1:1 negative - not bad for a day’s work and it also confirms our view that yesterday’s rally was running on fumes (i.e. low volume) and represented nothing but a good opportunity to load up on puts at slightly less IV. Mr. VIX dropped to about 53 today, which is 8 points from where I would want it, but that didn’t keep me from loading up on positions on every rip.
As you can see from the chart above, I see various scenerios going forward. I gave the triangle case about 50% probability at this point, despite the upper resistance line being a bit too steep for my taste. There is a possiblity that we can drop straight down from here, which would change our wave count a bit, and the implication would be that we are in wave 5 of (3) already. I however don’t think the permabulls will give up that easily, dried up swamp or not.
Of course I could be horribly wrong and this triangle could resolve to the upside, pushing the Dow above 10k and then some. As a matter of fact, even many staunch bears do believe that’s exactly what’s going to happen as a number of market indicators point towards a strongly oversold market at this point. One trader I respect very much points out that the Bullish Percent Index () is in a heavily oversold condition - it closed at 20 today. To put that into context, 30 usually is when traders start to going long in a big way - similarly 60 represents an opportunity to go short. Well, IMHO it’s all relative right now, as the $BPNYA sunk all the way to 2 on the 10th, which I think must be a historic low. I can also counter that the more short term McClellan ( is back at 16, which is actually considered slightly overbought. My medium term stochastics also point towards a heavily overbought situation in all cash indexes, I even see strog divergences in the SPX and the DJI. Finally, supporting the continued bearish case is the Baltic Dry Index ( is all shot to hell and continues to make record lows. Letters of credit between shippers and international banks are not being accepted, plus demand of raw materials, commodities, and manufactured products is subsiding. In a nutshell - we are in a recession, no matter what the headlines out there are trying to tell you.
Gold dropping as expected.

Even Gold is being treated as a commodity and not as an ‘alternate currency’ at this point, which is of course ‘encouraged’ by repeated PPT takedowns. Many have doubted my continued bearish case for the precious metal, stating that investors would surely seek shelter from risk by investing in Gold. Well, as expected that doesn’t seem to be working out so well. The reasons for that are numerous and would exceed the scope of today’s posting but let’s just say that I stick with my target of 600 after which I will start loading up on physical gold. As Trader Dan over at jsmineset.com put it so aptly: “The speculative interest in the paper over the entirety of the last two years has been wiped out.” Anyway, don’t fight me on this, leeches - I have been continuously spot on with Gold for six months now. Why would I stop now?
That concludes tonight freak show - you are free to return to puffing your crack pipes now. Berk and I will continue to post our trades going forward, but I’d like to see a lot more symbols here. Not feeling the love - time to pay your dues, leeches! Of course alternatively we both embrace bribes of the monetary kind (non serial and smaller than 20 Dollar bills please), fruit baskets, nudie bar gift coupons, or passwords to your trading accounts.
Cheers!
金币:
奖励:
热心:
注册时间:
2006-7-3

回复 使用道具 举报

 楼主| 发表于 2009-4-1 06:54 | 显示全部楼层
October 21st, 2008 12:13 am Market Forecasts 12 Comments

Mole is busy this evening and there is not much new to report from Sunday’s post, so I will keep it VERY short and sweet.  At this point, it appears the counter-trend rally is not yet complete.  The main reason I suggest this is that the breadth today was stronger than the breadth on the 10/16, but was done on weaker volume.  If this truly was a lasting bottom, we would expect the retest to take place more than a few days afterwards.
10-16 vs. 10-20 breadth

We have an upcoming fed meeting at the end of the month that is sure to cause some market gyrations.  Until then though, I maintain the view set forth last night, and only post the $INDU as I feel I need to add something.

And here is the 60d60min.

I was busy being a mechanic for most of the day today, so when the markets ended up, I was happy to be mostly in cash, and have a working engine.
I do apologize for the lack of content tonight, but both Mole and I had obligations.  I will do my best to post a few tid-bits of my trading rules, as well as a few shorts and longs throughout the day tomorrow (assuming the car continues to run).  Mole sent me an article last night, and a few sentences really stood out…
“I have enough of my own wealth to manage. Some people, who think they have arrived at a reasonable estimate of my net worth, might be surprised that I would call it quits with such a small war chest. That is fine; I am content with my rewards. Moreover, I will let others try to amass nine, ten or eleven figure net worths. Meanwhile, their lives suck. Appointments back to back, booked solid for the next three months, they look forward to their two week vacation in January during which they will likely be glued to their Blackberries or other such devices. What is the point?”
http://ftalphaville.ft.com/blog/2008/10/17/17194/andrew-lahde-bows-out-in-style/
With that, I bid you good-night.
Sk&aring;l!
Intra-Day Update: Monster VIXOctober 20th, 2008 9:58 am Intraday Update 116 Comments

UPDATE 9:56am EDT: Now THAT is a high VIX!

The TOS data provider is having a teeny bit of a data problem today
UPDATE 11:22am EDT: It seems the WSJ now buys into our (and other EW technican’s)  Note that they start the count at the 2000 peak. Wow - when did that happen? Are WSJ editors reading our blog?
UPDATE 2:23pm EDT: I used the market rip to load up as the VIX was dropping a bit. Here’s what I’m holding right now: ACE, AMZN, BIDU, CCJ, CNI, FSLR, GILD, GOOG, MA, MON, NKE, POT, PX. Many of those suckers are way overbought - and I got 1/2 of them at the peak. Let’s see how the rest of today unfolds.
UPDATE Closing Bell: Man, that was weird - this rally was running on extremely little volume, but just kept chugging upwards. Almost feels like it had a schedule going - seems fake and driven by institutions. I kept on adding positions on the way up - I don’t buy this one for a second. In particular since the TNX ended on a black marabuzo - the smart money is flowing back into treasuries.
金币:
奖励:
热心:
注册时间:
2006-7-3

回复 使用道具 举报

您需要登录后才可以回帖 登录 | 立即注册

本版积分规则

本站声明:MACD仅提供交流平台,请交流人员遵守法律法规。
值班电话:18209240771   微信:35550268

举报|意见反馈|手机版|MACD俱乐部

GMT+8, 2025-7-27 12:37 , Processed in 0.057842 second(s), 9 queries , MemCached On.

Powered by Discuz! X3.4

© 2001-2017 Comsenz Inc.

快速回复 返回顶部 返回列表