搜索
楼主: hefeiddd

一个笨蛋的股指交易记录-------地狱级炒手

  [复制链接]
 楼主| 发表于 2009-4-1 06:24 | 显示全部楼层
November 25th, 2008 8:31 pm Update 70 Comments

As I mentioned today I’m not going to post any market forecasts for the remainder of the week for the following reasons:
  • I’m completely worn out and so is Berk. Six months of trading a hyper volatile market that’s also being manipulated almost on a daily basis have been taking their emotional toll. I need a few days where I climb back into my inner shell and reconnect with my evil self. It seems that most of us have mentally adjusted to this crazy market and this has produced a constant uneasiness which I am capable of dealing with for reasonable periods of time. However, I also know when the moment for a mental refill has arrived - and that time has come.
  • The market has reached record levels of volatility at this point and most indicators I usually rely on are  being ignored by irrational exuberance on the parts of the perma-bulls. You can probably chalk some of that up to a low volume holiday market, which today was getting banged harder than a $20 bunk bunny.  It’s not that I am lost in my wave pattern or the general market outlook - we are most likely already in intermediate wave (4) to the upside. But after three days of extremely overbought conditions today’s tape shows me that I might have better chances taking a flight out to Vegas and trying my luck over at the Sands (and the girls are prettier).
  • Let’s face it - the option market completely sucks right now and thus Berk and I have decided to focus on a new futures trading system we are developing. Have been paper trading it so far with very favorable result, even in this stinking tape. The coming weeks are going to be pretty tough for option traders as the VIX is still sky high and call option premiums will be crushed by diminishing vega.
    On top of this the market makers are completely impossible right now. I grabbed some deep ITM SPY puts today and watched the option spread remain unchanged despite the SPX dropping by 5 points. Tried the same with DIA puts a few minutes later with almost identical results - made a measly $5 despite a noticable move in my favor. I’m not a genius but know when I’m being gipped. Thus, it’s time to consider a renewed approach to trading this market - it’s either that or wait things out until the end of January when we are nearing the top of intermediate (4).
  • Based on the previous point I am now starting to believe that the usual EWT reports we are posting are useful, but don’t seem to be helping most members execute successful trades. Let me be clear on that: We will continue posting EWT reports, but I don’t see why mechanically posting reports is going to help anyone if the market is in a transitory or exceptional state. My motto has always been less is more, and this is all we need to know tonight:
    • We are most likely in wave (4) to the upside - which means the market is going to remain bullish for at least two months now.
    • If, despite all evidence to the contrary, we are actually still in 5 of (3) then we are in some ugly ending diagonal. Problem is that we would not have sufficient evidence to justify dipping into defensible put or short positions until the best time to leverage the ensuing down wave has passed. After all, it could just be a downside correction of minor 1 of (4). I don’t want to trade tape that can put me into a short squeeze like the one we found ourselves in the past two days.
    • It’s a holiday week and volume is fleeting which in turn almost guarantees monkey business.
    • What seems to work well in the past two weeks is to simply forget the wave pattern (for right now), and place trades according to 2sweeties’ retracement levels. I am usually not a short term trader, but this is not the time to load up on large amounts of puts or calls, so what’s left is to leverage the daily moves and there are plenty of those.
    • What also seems to be working is simple futures day trading according to pivots and your favorite momentum indicators. I for one do very well with my stochastics - Berk loves those MACDs and MAs.
    • The definition of insanity is to keep repeating the same thing over and over again and to expect different results — Albert Einstein.
  • Once we have progressed sufficiently into wave (4) we will continue to explore longer term trades that exploit the unfolding Elliott Wave pattern, but at minimum on a minor degree level. Which means we will place trades with the expectation of holding them for at least 2 weeks (unless we get stopped out), thus cancelling out the daily noise (think weekly candles). Until we get to that point we will post shorter but to the point market forecasts. I will keep posting those retracement level charts in the morning and will chime in when I see something of interest. You all know I can’t help myself. But expect our reports to be rather brief and to the point in the coming weeks, especially as the year comes to a close. I will probably give you guys an extended weekend forecast, and then post one or two charts during the week.
Hope all the above makes sense to you. As a matter of fact, I would very much appreciate your input in all this - what your own thought process is right now and how you are faring in this market.
Finally, a big up to all you stainless steel rats for posting close to 260 comments on an intra-day update today. That’s excellent for a holiday week and I’m enthused by the sheer determination and hard work I’m seeing here. Now, if could just funnel all that energy into one of my evil schemes…
UPDATE: Someone asked a question about the long term nature of this bear market and here’s the big picture with some comments:

Bear in mind that the a and b cycle waves would be below the 2000 top if you factor in inflation or if you measure the Dow in ounces of Gold.
UPDATE 2: I was not kidding about the record volatility - as a matter of fact it’s unprecedented. Take a load of this:

Cheers!
Intra-Day Update: Irrational ExuberanceNovember 25th, 2008 10:19 am Intraday Update 260 Comments

UPDATE 10:09am EST: Here are the retracement levels for today. TNX is down but the mouth breathers don’t seem to care. Obviously the consumer numbers were cooked, but it’s all one big kabooki theater at this point. Frankly, I’m looking for an exit - should we get one I’ll cash out and walk away until next Monday.

UPDATE 10:31am EST: Curiously, AAPL is behaving today - actually making profits on that one - bless its soul. CF and GS are not so kind unfortunately. Anyway, don’t even try to make sense out of this tape - there’s a battle going on. If are holding puts and are not willing to cut here (like yours truly) get yourself a SPY/DIA hedge and let the idiots figure out a direction. Right now we’re at a pivot and buyers/sellers are fighting for the VWAP.
UPDATE 11:33am EST: Lots of movement but we’re not going anywhere. I thought expiration week was over.
UPDATE 3:00pm EST: I am quiet today because I’m mostly watching. Got into cash about 2 hours ago and took a loss on my puts as I saw the MMs play evil bid/ask games with all of them despite the market dropping steadily. I’m starting to follow the futures as trading the options market feels like a task of Sisyphus lately and making buck in this environment is harder than ever. As I’m writing this the ES just rallied 20 points which kind of vindicates my earlier decision to bow out.

Tape of today - this is what you call chopped hamburger meat.
I will probably take a step back for this week as I desperately need some time off, and there probably won’t be any market updates until Sunday night. Will follow up with quick thoughts and comment cleaners.
金币:
奖励:
热心:
注册时间:
2006-7-3

回复 使用道具 举报

 楼主| 发表于 2009-4-1 06:25 | 显示全部楼层
November 24th, 2008 10:43 pm Market Forecasts 52 Comments

Twice now, in the past week or so, my wave count has been thrown into disarray.  I did not have a lot of confidence before today, and I have considerably less confidence in the direction now.  Therefore, you are in for a treat as I am going to step back and walk through my thoughts with you.  It might be a little wordy, but I will try to keep it full of charts to help smooth it over.  Enjoy.
I am going to start out on monthly, and work down into hourly charts, and I am going to use $SPX (by popular demand) and the $NDX.  With the $NDX monthly, it is plain and simple.  We have completely broken the long-term trendline, and are bouncing between horizontal resistances.  Woot!

For the $SPX, the purple channel of the double top, and main bottoms seems to be the key.  We have broken a major trendline, and are well into the middle of nowhere, so now it is down to weekly.

With the $NDX, on weekly, I have some interesting information that jumps out at me.  Nice reversal candles forming and a similar divergent histogram formation, and all forming around a strong resistance, which the $NDX spiked both times.  I can also count 5 complete waves down (in 3), so the upside is looking brighter.  The only thing that discourages that thought is the weekly MAs (which I, personally, don’t use, but hedgies do!!), are heading for a cross-over, and I would be surprised to see it not cross at this point.  The $SPX weekly chart shows nothing interesting except for a MACD divergence.

The daily chart is more bullish.  We have strong divergence.  We have a piercing pattern.  And we have already rallied nearly 15%.  We have broken from the most bearish downtrend channel, and breadth was expanding.  All of this paints a quite bullish picture.  Granted, it is Thanksgiving week, and the market volume should continue to get lighter, this should be taken as a strong bullish signal.  We also comment frequently that the day after a huge reversal speaks more than the reversal itself, and today, we got a SOLID follow-through.  $SPX is more of the same…


On the hourly level, we can start to focus on the first of our targets.  In the $NDX, that range is between 1170 and 1200.  From that range, we should expect a drop as a wave 2 corrects the first motive wave in the move.  That range should include the open gap just South of 1100, though 1110 would give us a nice set up for a small H/S bottom.  Once we get our first completed move up and down, we can begin to hone in on the larger targets to the upside, as shown on the daily chart, as the wave count begins to present itself.

With the $SPX, the logical upside target would be 875, and should we break that, a range surrounding 900.  One could argue now that a 5 wave advance is complete, and that we could be in for a decline, targeting 780 fairly soon.  $SPX is sporing the same divergence that the $NDX is, though is closer to closing out side the 2.0BB.  Which brings me to a point that the $SPX and $INDU (i.e. Blue chips) are leading the advance.  This is another piece of evidence that suggests that the upside is begging rather than preparing for more downside.  Buying the Blue chips indicates that investor sentiment has moved to more conservative issues, finally not wanting to be a speculator, at just the time when a speculator is a low risk idea.

All of this (finally) brings me to the $VIX, which is looking mighty top-heavy.  After missing a buy signal (which at this point would have been confirmed) by only pennies, the $VIX has taken a hefty price cut (20%).  A minimum target would be the 50MA at 56ish, while the larger target seems logically set around 35, which is an open gap.  The double top pattern target would be looking for single digits, and for some reason, I just don’t buy that.

Either way, trading will be different moving forward.  Buying call options will not be as lucrative until the $VIX is back into the 50s or 40s.  Until then, trading spreads and cheap stock, or look to buy more ITM, as those options will be hurt less by an IV crush.  We will have more on this later on, but check out some cheap stocks I am eyeing right now… C, AKS, BX, SWHC (perhaps a push lower, maybe 1.50?), DRYS, FWLT, GNK, ACI, TSO, and the list goes on, but that should give you something to chew on.  And I know you are thinking, “why can’t I just buy calls?”  You can, just make sure they are ITM, as those cheap OTM calls will likely get much cheaper, cutting into profits.  Again, this will not be as big of a deal once we breach the 50s in $VIX.  We just need to give it some time.
Before I leave you, let me repeat that we should be in for a short term drop in the near future, and that this drop SHOULD carry us to levels below where we currently are.  Towards those lower levels would be a great time to exit short positions, rather than selling at resistance.  This might mean there is a little more pain before we drop, and I am not recommending anyone hold a position beyond their pre-determined exit level, merely saying I expect a small move lower before another large move higher.
Skål!
金币:
奖励:
热心:
注册时间:
2006-7-3

回复 使用道具 举报

 楼主| 发表于 2009-4-1 06:25 | 显示全部楼层
November 24th, 2008 1:17 pm Intraday Update 131 Comments

UPDATE 1:13pm EST: I’m talking about this blog today - is everyone taking this week off? Best sell-the-rip opportunity in a long time IMHO. Meh - you snooze you lose. Anyway, for whoever is left here, today’s RLs:

UPDATE 3:00pm EST: In case you rats wonder what Berk and I are doing. We loaded up on the following:
AAPL, BG, BHP, CCJ, CF, GS, MA, XLU - MA was kicking butt for a while but I snoozed on taking profits.
Anyway, we are watching the 848 RL very keenly. There is a chance the mouth breathers bust through that one today and we might test 857. No balls no babies
UPDATE 3:32pm EST: We just hit 857 - getting a wee bit nervous over here. But the market is so overbought right now that I have a hard time cutting. This is usually when I add positions - problem is that the permabulls are doing a kumba-yaaah in the pits, so we might have to dig deep to find out steel cohones. In the end however, I won’t fight the trend.
UPDATE 3:44pm EST: Okay, the 857 pivot is officially dead. We’ll have to regroup over here. I’m not selling my puts into this, waiting for a snap back. At this stage we are not sure that the trend is to the downside. This was quite a follow-up rally.
UPDATE 6:11pm EST: Regarding the long term market indicator (down-up). This morning Berk and I expected the market to drop this week and then rally for the coming months. However, after today’s tape it’s possible that we may have embarked on wave (4) up. Berk will pour over his charts today and post a very late forecast once he has reviewed all the evidence (and consulted his crystal ball).
Tipping PointNovember 23rd, 2008 11:26 pm Market Forecasts 95 Comments

It’ll have to be relative brief tonight, ladies and leeches, as I’m running late and have not stopped a second this weekend.
Bottomline: We are at a tipping point and although the market is clearly in an oversold condition, the wave pattern suggest that more downside potential may be forthcoming.

As expected the last day of expiration week resulted in an EOD snap back rally as we were miles away from max pain. Based on what I’m seeing in my wave pattern there is plenty of downside potential left as indicated on the chart. However, if we push past the yellow zone I would recommend closing open short positions and waiting on the sidelines until perhaps past 857 before dipping into longs. Intermediate wave (2) is nearing its conclusion and thus we remain vigilant rats as we don’t have the luxury of a crystal ball that tells us when the bottom of this wave has been painted. The only way to know for sure is after the fact, when our Elliott Wave rules allow us to discard the probability of a further drop.
With that said, I do see a reasonable chance for a turn and if it happens it should happen fairly soon. If we see a congestion around the Friday close early Monday I can see myself dipping into a small amount of our favorite puts with carefully managed stops (inside the yellow region above). The good news is that risk can be relatively easy managed, so we are in a good spot right now.

You all know that I love my stochastics as they rarely disappoint me. And what my short term stochs (one week basis) are telling me is that we went from overbought to oversold in a jiffy last Friday. This also supports my view that short positions here can be easily managed.

Now, let’s take a look at the weekly Dow Jones chart - I am enthused by the downswing in the stochastics and am hoping for a repeat of the March tape that presented us with the bottom of intermediate (1) of primary {1} of cycle wave c.

However, I am also keeping a keen eye on th NYSE Bullish Percent Index, which is in heavily overbought territory right now. Can we go lower here? Absolutely - we did so last October. But wishful thinking is one of the deadly sins in trading and this indicator warns me to stay very nimble and not to get complacent. I would not recommend running more than 5 short positions at this point as there is a looming threat of a slingshot rally. We will see it soon - perhaps even by the end of this week.

I must point out however that nothing has changed in the credit market - without posting various charts let me summarize that there has been no improvement in any of my favorite indicators (TED spread slightly rose, Moody’s BAA/TYX yield spread has remained at historic levels, IRX yield practically at zero). The one chart that actually is a direct represenation of the continued credit freeze is the Baltic Dry Index, which despite being called an index actually shows the actual average shipping charges for a container of basic materials. Nothing really has changed and we do need to see this to start pointing up on the double, not down, otherwise I cannot fathom the possibility of a multi-week rally as anticipated for intermediate wave (4) of primary {1}.

As 2sweeties graciously has added a Gold RT calculator I couldn’t resist adding tomorrow’s daily RTs to my chart. Unfortunately I cannot use Prophet in TOS for the Comex Gold contract (GC) but luckily I still do have an OptionsXpress account which allows me to chart GC. Their drawing tool is a complete pain btw - don’t try this at home - it got pretty ugly and there was a lot of German cursing.
I think the chart makes it pretty clear what action to take here. We are way way overbought right now and I actually dipped into some puts on Friday. Although I am still expecting a drop to the 650 area I will have no compunction about cutting my puts if Gold keeps pushing deeper into 800 territory over night or tomorrow morning.

Here’s the wave pattern for some context - I’m not sure what to make of that long push up right now. The triangle we saw last week got pretty ugly and I think this has turned into an a,b,c correction. But just like in the averages we are at a tipping point here - Monday/Tuesday should present us with much needed clarification. One thought is that the 9/11 - 10/10 wave maybe was the X in a double zigzag - again there are a lot of options at this point.
Should we see a continued trend to the upside I will have to re-evaluate my wave count. We should never get married to our own ideas and a renewed push to the upside will give us reason to believe that the trend might have changed and that Gold will take another whack at the four digit mark.

Let’s finish up with the Dollar tonight - we haven’t looked at that for a while. As predicted a few weeks ago, the current uptrend was not done by far and we are currently completing what seems to be a 5th wave to the upside. My target is a minimum of 90 - let’s not forget that fifth waves in commodities and currencies often get extended, so I would not be surprised to see 92 or even higher.

However, the COT report tells us that long spec are starting to abandon the Dollar, which is worrisome and confirms my current view that the Dollar should start tanking big time once wave 5 is complete. It is also my view that a sinking Dollar will most likely present us with higher crude prices as most OPEC members are nostalgic about those $140 crude days.
In that context - word has it that a major economic war is about to unfold - here’s a snippet of an  one of our readers shared with us this weekend:
In a stunning new development, the Dubai Multi-Commodities Center is now putting the finishing touches on the formation of an exchange traded fund for silver with a launch likely next month as demand for silver has surged in the past six months.  What may be happening here is that the OPEC nations, and possibly also Russia, are setting up a counterbalance against the collapse of oil prices.  You may recall from past issues that we discussed at length how we thought that sovereign wealth funds in oil-rich nations were tweaking gold and silver upward every time oil was smashed by the Illuminist manipulators.  The message was, you leave oil alone, or we will send gold and silver to the moon and expose your destruction of the US economy by killing the canaries in the coal mines, thus ringing the gold and silver alarm bells loud and clear.
You guys know that I’m not a fundamental trader by far, but I have to admit that this article is quite intriguing and I’m curious as to what the impact of this new silver ETF will be.
That’s it for tonight - Berk and I will follow tomorrow once we have a better idea which way the pendulum is going to swing. Keep it clean my legion of leeching steel rats, and don’t let your personal biases influence your trading. The market will show us the way, as usual.
Cheers!
金币:
奖励:
热心:
注册时间:
2006-7-3

回复 使用道具 举报

 楼主| 发表于 2009-4-1 06:26 | 显示全部楼层
November 21st, 2008 8:19 pm Market News 122 Comments

Damn, I was just getting warmed up to the idea of maybe turning bullish next week, but then I saw this:

Maybe the bottom is not in just yet…. to be continued on Sunday
Daily Update: So, what now?November 21st, 2008 10:19 am Intraday Update 236 Comments

UPDATE 10:13am EST: I guess every bear out there is waiting for an opportunity to back up the truck - especially the kind of situation that tells me to be cautious. Berk and I are watching the tape carefully as we continue our bearish stance (for now) but we are also aware of the fact that today is the last day of expiration week, and evil things happen to transpire in the NYSE on expiration days. While you ponder that thought here are today’s RT levels - I trust everyone knows the drill by now:

UPDATE 1:30pm EST: I am showing some very significant divergences in some of my most trusted momentum indicators. Going back over the last few weeks I never have seen price move in the opposite direction of the direction those indicators are clearly pointing towards. Had a chat with Berk about it and we both agree that the only explanation is that the MMs are riding the market up/down. I know some of you are probably sick of hearing this, but we remain very cautious as we don’t enjoy trading ‘blindly’. Anything goes today - feeling lucky…. punk?
UPDATE Closing Bell: Berk and I have been daytrading the swings today - with very favorable results I might add. My apologies for being so quiet, but there really wasn’t that much to say. Just glad expiration week is over - my least favorite week of the month, as you all know. Not suprised to see the market rally into the close as we were miles away from max pain.
UPDATE 5:25pm EST: Some people here were asking me about market manipulations and I thought I post this for everyone to see:
I only call it manipulation when I see strong divergences on my indicator which in 99% of the time do not occur, and in particular if these patterns happen during the last day of expiration week. But I try not to blame anyone or anything - after all, if you expect manipulations, then trade them ! Or, if you suspect manipulations that interfere with your indicators then simply stay out and come back to trade another day. There are no excuses - a stainless steel rat adapts and prospers in any environment.
I think we all need to take a step back from the daily whipsaws, the hysteria, and all the tribulations of this market. Because on a medium to long term basis things are unfolding exactly the way Berk and I have been predicting for months now. Just go back and look at my charts from mid October - I predicted a triangle and a drop down. Which is what we got. Could have been a slightly different pattern, but the direction and magnitude were spot on. Actually, we both kick ourselves for not backing up the truck on Nov. 4th and then just holding until today or yesterday.
This is something I sent to Berk in an email yesterday evening:
“…on Nov 4th GOOG was trading at $360 - now it’s at $260 - can you imagine how much money one could have made on one option alone? The Nov 330P sold for $7.10 that day - today it’s worth $62.80. That’s one option.”
Food for thought? Berk and I are determined to quit getting caught up in the daily whips going forward. Remember that weekly chart I used to post? That should be our prospective as we push into 2009. More on that in the coming days - but expect that there will be changes around here.
Enjoy your weekend - I will post the weekend forecast sometime on Sunday. I might post a comment cleaner in the interim if the comment count gets out of hand.
Finally, a big up to Eric - hope he can continue his current streak in calling the market close.
Cheers!
金币:
奖励:
热心:
注册时间:
2006-7-3

回复 使用道具 举报

 楼主| 发表于 2009-4-1 06:26 | 显示全部楼层
November 20th, 2008 8:44 pm Market Forecasts 121 Comments

Let me start by saying that I am angry at the market.  Not that this isn’t typical expiry antics, but I have decided to walk away at about 2:30 both yesterday and today.  As it should go, I decided to pass up on the two most directional moves of the day.  Wouldn’t you know it.  “I can’t complain, but sometimes I still do!”
So where are we now?  In the target range in FSLR, MA, and BIDU, and in the free fall zone on GOOG.  Now don’t think I am going all bullish here, ’cause I am not.  I am going to say though that we are getting close to what we expect to be strong resistance levels, not only in these stocks, but in the markets as a whole.


$NDX is quickly approaching the 1K level, which includes the “thrust” target for the triangle (973), so we should expect some buying there.  However, it appears that the bounce/chop expected around 1000 should be a 4th wave (of [5]), meaning we would have one final (sizeable) push lower, before a decent sized rally.  If we cross 1000 without much resistance, I would be targeting 900 and 850 for the $NDX.  We have also close outside the 2.0 BB for 2 days in a row.  Not that we can’t do this for some time, weeks even, but know the rubber band is stretched around our resistance.


Again, being cautious, and I am looking to accumulate some shares in my IRA as we push these lower levels.  And I do expect us to test some of the lower limits (at least so far), as hourly technicals look good.  Weekly MACD histograms is pulling back, marking the we are losing momentum.  I also expect to see some institutions stepping in right here, as soon as the bears think we have broken lower.  There are plenty of nice round numbers around ($SPX 700, $NDX 900 and 1K, $INDU 7K and 6500).  I am just saying this is a wave 5, meaning we SHOULD be nearing a bottom, and some indicators are lining up.  I for one, am treading lightly.
We also have Mr. $VIX bringing in some action.  Today he not only pushed through my 77.50 resistance, but put in a new closing high, increasing the likelihood of the decline.  We should start getting some $VIX buy signals as we push outside the 2.0 BB.  We could get several of these before they actually kick in, but I will be watching them closer now than ever before.

So, what am I saying?  All in all, I think we drop.  I like my target ranges for now, but am expecting them to give way in a final push lower, likely not exceeding 6500-6000 in $INDU and 900-850 in $NDX.  The reason I am “worried” about this bottom is that the subsequent rally should be fairly large, targeting 9K easily.  Though we will deal with upside once we hit a bottom.
UPDATE 10:38am EST: Berk and I just grabbed some Dec and Jan GLD puts. Stochastics look good right here - as low risk as it gets for that crazy metal.
Skål!
« Older Entries
Newer Entries
金币:
奖励:
热心:
注册时间:
2006-7-3

回复 使用道具 举报

 楼主| 发表于 2009-4-1 06:27 | 显示全部楼层
November 20th, 2008 9:48 am Intraday Update 372 Comments

UPDATE 9:45am EST: Looks like we didn’t get that rally we were hoping for. 776 is the next long RT - right now this bus is basically empty, which completely sucks. In any case, the one chart you guys need to keep in mind right now is not today’s tape but this:

That’s a nice double top, wouldn’t you say? If we close below 768, all hell will break loose. I am not saying that will happen today, but it might happen Monday.
UPDATE 10:10am EST: 2sweeties sent us corrected short retracement levels - those should be handy if we finally rally.

Also, light sweet crude futures (CLZ8) are touching the 50 mark - this must be below the current production costs for most OPEC members.
UPDATE 10:18am EST: For your convenience here’s an updated SPX chart including the new corrected RTs:

Erik over at TradingAddicts posted the average crude production cost - which is very interesting in the context of light sweet crude hovering slightly above 50:

UPDATE 10:40am EST: Glad I got out of those calls right away - gold star to myself for good timing. Would have been actually faster wasn’t I so busy spoiling you leeches. Anyway, Berk points out that the wave up looks like a nice a,b,c.

UPDATE 10:49am EST: I just scalped a few points with another call. Watch the 1.055 pivot on the Yen (@6JZ8) futures.
UPDATE 11:02am EST: Back in calls - looking good so far - will cut at 1118 pivot on NQ. BTW - check this out:

UPDATE 11:18am EST: This might be it for our little rally. Yen is holding slightly below its pivot and my stochastic says that it’s oversold. If the Yen rallies from here, watch out below for equities.
UPDATE 11:36am EST: Okay, the next leech who asks me to post my Yen chart gets booted off the blog. Here it is - make a style in TOS and watch it - I have been posting this 100 times in the last few months - grrrrr.

UPDATE 11:44am EST: Okay, in case we plunge - I do like DRYS, GNK, MOS maybe, WYNN, and especially RIMM. Anyone else? Shoot out some symbols please - you leeches are useless today. I’m working my ass off over here - show me some love - I can’t do it all on my own (kudos to Erik again - he’s on fire lately it seems).
UPDATE 12:01pm EST: ES futures dropped below S1 - I’m sure there will be a retest. Yen getting close to R2 at 1.055. Watch this level like a hawk people.
UPDATE 12:06pm EST: Here’s the retest - should be our chance to load up on puts.
UPDATE 12:19pm EST: Okay, this doesn’t make any sense to me - the Yen should have breached this pivot. I just jumped out of my puts again as I don’t like the tape. I just can’t have that Yen start tanking like this while it’s completely oversold. Again, let’s remember it’s expiration week, MMs are eager to push the market up. I’m in holding pattern right now.
UPDATE 12:26pm EST: Yen just dropped through R1 pivot as well - completely tanking. I’m stepping aside now, lost only a few bucks on that whipsaw but I’m not chasing this. Seems my initial instincts were correct but the Yen threw me a little curve ball here.
UPDATE 12:44pm EST: Unless the Yen makes a move we will not drop. Watch the 1.049 and 1.055 pivots on the Yen. Also, watch the 1.040 pivot on the downside - I don’t expect this one to give, but in this market anything is possible.
UPDATE 2:07pm EST: Paulson is on the tube - keep an eye on the ticker:
  • The word ‘regulatory reform’ = instant black candle on SPX.
  • Bla bla bla - housing correction was inevitable (now he tells us)
  • Paulson: Ooops - we screwed up by not regulating the financial industry.
  • Recovery first than repair system. Encourages regulatory framework so that these mistakes will never be repeated.
  • “GSES clearly posed a systemic risk” - now he tells us.
  • Paulson mentioned ’systemic risk’ now the 5th time I think.
  • “Never been about the banks, but about the continued prosperity for the American people” - yeah right!
  • Reid: Will give automakers another chance to plead their case in December. Congress will return if auto industry presents viable plans for survival. I guess the ‘none of this was our fault’ argument didn’t stick - hehe
  • Pelosi: Auto industry is not on the road to recovery right now. We want a viable auto industry and recognize how important it is. We are giving the industry time to come up with a viable plan.
  • Yadayada - Paulson is taking a stroll down history lane - I’ll fade it out now and watch the tape, hoping for a drop towards the close.
UPDATE 2:58pm EST: Yen attempting to breach 1.055 - careful it’s overbought right now. NQ at 1065 pivot - it’s do or die at this point -  one hour left. I’m sick of the back and forth - give me pivot breach for crying out loud.
UPDATE 3:05pm EST: I think we might have breached that pivot on the Yen.Still cautious because of my stochastics telling me that it’s overbought. It rarely lies to me - if we were lower on the stochastics I’d be jumping in here. Maybe caution will get the better of me today, but I need to stick with my system, even if it hurts and I miss out on a nice drop. Once you neglect you system you’re basically gambling. Even worse - neglecting your system and winning will guarantee you to get wiped out further down the line. Anyway, let’s see what the Yen does - if it keeps climbing here and NQ breaches 1065 I’ll pick up some SPY puts.
UPDATE 3:39pm EST: WE BREACHED 768 ON THE SPX - IF WE CLOSE BELOW THIS LEVEL TODAY WE WILL SEE A MASSIVE DROP.
UPDATE 3:46pm EST: In case you wonder why we just swung up. We touched the 1040 pivot on the NQ - I was holding SPY puts and sold them into strength right as it touched - got the perfect fill 2nd time today. There is a reason why I keep hammering those into you guys - watch those indicators and you will bank some mighty coin.
UPDATE Closing Bell: Well, Eric called it again - here we are at new lows for the day. What’s eve more important is that we closed below 786, which is an extremely important level. We bascially just confirmed a 5 year double top - you figure it out

Anyway, in closing - since Eric keeps pushing his USO chart I set up a comparison between the two (black is USO) - what’s interesting is that the SPX seems to react in an exaggerated fashion, while USO calmly points the way. Food for thought as to the nature of this correlation and how to use it as an indicator.
金币:
奖励:
热心:
注册时间:
2006-7-3

回复 使用道具 举报

 楼主| 发表于 2009-4-1 06:28 | 显示全部楼层
November 20th, 2008 12:18 am Market Forecasts 41 Comments

I’m going to have to do this T.K. style tonight as I’m running out of time. First up, I kicked myself for not jumping in earlier, despite Erik’s repeated calls for… well buying loads of puts! All I wound up doing was snack on some DIA and MA puts - worked out but I could have milked those suckers for so much more. Well, kudos to Erik crude inspired bearish conviction which turned out to be right. The only paltry excuse I can muster is that the intra-day tape made us all a bit jumpy (as per my intra-day updates). Despite Berk’s and my own hesitations, what does the market do int the last hour?
Would have been hilarious if the bus hadn’t been so empty. Breadth was horrendous today, easily a 90% down day. Even the trannies tanked and most secondary indexes were leading the pack. Most importantly, the Dow Jones finally slipped below the 8000 mark, which it hasn’t seen since 2003 - I actually had to wipe tears of joy off my face - a truly touching moment for us evil speculators. Not bad for one day’s work and all in all a miserable day for the mouth breathers. Hey, maybe the PPT had the day off? Better luck next time…

So, what do you know - it was the green scenario (see weekend update)! Although the wave count for today still has to be sorted out we are going down - and are far from done yet with our permabulls. But - before the real fun starts it’s my not so humble opinion that we’re going to rally up a little.

I have taken the liberty and pre-calculated the daily short reversal levels for the SPX already and set the 100% mark at 892.18 - the resulting short RT levels are shown as dotted red lines in my first chart. Maybe a bit optimistic but based on the current wave formation but I don’t see much more upside than that - actually a thrust above 920 would toss my entire wave count into the toilet. We don’t want that to happen, do we?
Anyway, I see us either hit 839 or 859 - which shall be known term as our ‘Back Up Truck Zone’. If we blow past that I’ll just have to make a living washing T.K.’s fleet of luxury cars.

Our McClellan Oscillator, which is a medium term sentiment gauge, is also approaching oversold conditions. Fair to say chances are good for a counter rally, which we always seem to get before the final shoe drops.

This confirms my more longer term view which is that we are far from completing minor 5 of intermediate (3) - I want to see NH-NL’s 10 day MA closer to 600 before I start thinking about intermediate (4) to the upside. If you look a few days back - I have replicated Berk’s settings and targets, which I think were spot on. Let’s keep watching this chart in the days to come.

Then there’s the Option Put/Call ratio - definitely on the rise but not even close to what we saw during the notorious October 10th tape.

I posted this chart this morning and here’s the updated version. So, we have 2 days left in this dreaded expiration week and the price today moved away from the market maker’s sweet spot, which is around $95. What do you think they are going to do tomorrow or perhaps Friday? This is just the type of paranoia that propels me to think that we’re going to swing up first, maybe into Friday, and then drop hard next week. Hey, works for me!
So, how about it permabulls? I don’t like chasing this tape anyway and I hate expiration week. Why don’t you rustle up the rest of your mouth breathing friends, and bestow us with a good ole’ stampede so that we bears can load up on puts? Hey, we both win! You look good this weekend and we get to ride you guys into the abyss starting Monday.
Hey - one can dream. Keep it clean out there, my dear rats - you know the drill, let’s hope the tape tomorrow is conducive to our nefarious scheme. If we happen to continue to the downside (as indicated by the current candles in the index futures) try to at least wait for a rip to load up - chasing the market rarely works out. Tuesday’s and Wednesday’s long RT levels should still be valid, thus the next daily long RT level is at 776.51 - if we don’t get a rally in the morning a bounce off of this might be out last chance to load up. At least pick your victims well - Berk and I will post whatever we decide to dip into.
BTW - Gold is going down - wait for it. Dollar will continue to rally - also wait for it.
Cheers!
金币:
奖励:
热心:
注册时间:
2006-7-3

回复 使用道具 举报

 楼主| 发表于 2009-4-1 06:28 | 显示全部楼层
November 19th, 2008 10:15 am Intraday Update, Trading 279 Comments

UPDATE 10:09am EST: Halfway through this week (almost) - anyone having fun? Didn’t think so, unless you’re a swing trader. I have to admit that the first half of yesterday’s tape was actually quite pleasant, but things reverted back to chopping hamburger meet in the final hours. Something that is very apparent during expiration week is that some of my indicators start bing ’soft’, brought upon by market makers riding the tape up and down. My first instinct as a trader is to proceed very cautiously, although for the daytraders among you this can be pure manna from heaven. To each his own - I have been dabbling in some swing trades as I hate to just sit and watch all day, but there’s an easier way to make a living.
Anyway, here are today’s retracement levels - mind you that yesterday’s low of 826 was spot on.

We’re right at the 1168 NQ pivot right now and Yen is pushing up - expecting more sideways chop in the next hour or so. Also watch the 1.0320 pivot on the JYZ8 futures - if we breach those we might have ourselves a rally at hand. In terms of the wave count the tape seems to favor the upside as a further drop from here would meet several layers of resistance. We’ll continue to watch the situation and will chime in as things unfold. Whatever you do, don’t jump in/out here like crazy - the day still needs to pick a direction.
UPDATE 10:48am EST: I was pretty lucky to grab FSLR, MA, and some SPY right at the top. I’ll probably get out when we hit that 1140 pivot on the NQ. Watch that level and reload on a breach - lather, rinse, repeat. BTW, if we keep dropping today I think AAPL and MA are great to kick the crap out of. Just about to drop through the 80% line on my stochastics, plenty of juice left.
UPDATE 10:55am EST: Dkpa - a fledgling new rat - kindly points us towards the CPC I mentioned the other day:

Frankly, it’s a bit early for this - didn’t expect us to hit those levels until the end of whatever pattern is unfolding right now. Be careful out there - we could see a very violent snap back in a short order. BTW, please point up dkpa for this great intel.
UPDATE 11:01am EST: BTW, the 839 RT level which matches the NQ 1140 pivot has odds of 31% to be successful. I think we should watch the Yen and decide, but thus far both are holding. FYI - the Yen’s stochastics are pointing down right now - I don’t see massive strength (yet). I’m on the fence but will jump in when I see some conviction either way. Again, watch the 1.0320 pivot on the Yen - it needs to hold for a continued drop in equities
UPDATE 11:17am EST: Okay, key observation: The Yen is pretty weak right now but the market is dropping anyway. The bulls better pray that the Yen doesn’t wake up or Kansas is going bye bye. Or, it’s another monster bear trap - wouldn’t be the first time. BTW, if we drop from here, the AAPL will be ripe for the plucking.
UPDATE 12:14pm EST: Careful now - the Yen just hit its 1.0370 pivot and I’m not sure it has enough juice left to breach it and drive a continued drop in equities. Also, we have been going sideways in the YM, NQ and ES for the past hour - despite the Yen rally. Contrast that with what I was saying about equities at 11:17 and you are rightly should be confused. I don’t feel the love here - maybe I change my mind if we get a confident drop through the current chop zone - the candles I’m seeing right this second might be a good start.
UPDATE 2:00pm EST: I don’t want to sound like a broken record, but I do not trust this tape further than I can throw the average overweight fund manager.

We’re kind of driving blind here - and I don’t like gambling in Las Vegas casinos.

Maybe that’s why the Yen pushing up doesn’t matter. It’s expiration week and the market makers do not want to move further away from their sweet spot.
UPDATE 2:36pm EST: Mmmmh - 822 on the SPX, that’s quite a ways away now from that 827 RT level. Maybe Erik will get his drop after all. Let’s hope so…. I can’t take the whipsaw anymore. BUT I’m still cautious - this tape reminds me a LOT of last Thursday - not falling for that again I mean, we should be tanking with conviction - it feels like (I’m almost ashamed for using that word) as if the MMs are pushing it down just a tad more waiting for more bears to jump in. Nobody falling for it yet? No? Alright, let’s drop it by another 3 points or so… Caveat emptor, my dear rats - don’t be tempted by greed - follow your indicators. If you have none - dont’ follow mine.
UPDATE 3:45pm EST: Before you guys get too excited - there is a strong long RT level at 808. Might be where we bounce. In either case - horrible tape today - although Erik got his drop I’m comfortable not playing this down.
金币:
奖励:
热心:
注册时间:
2006-7-3

回复 使用道具 举报

 楼主| 发表于 2009-4-1 06:29 | 显示全部楼层
November 18th, 2008 11:10 pm Market Forecasts 42 Comments

More of the same old expiry antics we should expect.  We git a nice drop through the mid-day, and finished up with a nice rally right from the recent lows.  I told Mole earlier that I would not be surprised to see the institutions step in a little above the prior low.  “Low” and behold, there they were, a little early to catch the bears off guard.  With that said today’s action leaves us with little resolution or our choices.  An ending diagonal remains on the table, in which case we would likely be rallying in a [C] wave of [II] (rally, drop (in [3]), chop (in [4]), drop (in [5]), rally big), targeting 1250.  The problem with targeting 1250 is that should we get that high, we would have limited downside to keep the resistance lines converging.  This means that we should either expect a reversal back down before 1250, or expect the 1110 - 1100 resistance zone to hold pretty firmly.

Should we get our early reversal however (1200 would be most obvious), and we could target 1050 once 1100 finally breaks.  That would be about the maximum allowable (and most likely too far if we push all the way to 1250) to keep $NDX from becoming and expanding diagonal (HIGHLY unlikely).  However, should we push to 1050, and show little signs of stopping, we can likely eliminate and ending diagonal (which in EWT should NOT follow a triangle if you think about it, as an ED is not a “thrust”), and keep the 4th wave triangle on the table.
And to make matters worse, I can present a STRONG case to bring the 4th wave flat back into our sights.  This will be quickly discarded should $NDX push beneath 1110, but the lack of a new low today, while $SPX and $INDU, remained stronger forces us to consider that we could still be targeting 1350 or 1375 before we finally move lower.  I have no desire to muddle the view with additional counts, but also feel that I should be fully prepared, and that NOT considering the flat (again) would leave me biased against the largest of the potential upside scenarios (not a good idea).

So, we noticed the inaction of the XLF today on the upside, and it was kind enough to put in yet another low.  This is a good sign that we should be heading lower.  However, it is sending us mixed messages as we have a reversal candle (showing late day buying (wonder who that was…)), as well as a bollinger reversal signal.  Any break of 13.50 would likely mean that XLF was going to challenge 16.50.

This brings me to the breadth which was modestly bullish at best.  In fact, the $RUT put in negative breadth today.  When compared to the 13th, today was roughly 1/10 as bullish.  If we don’t start off with a rally tomorrow, I will be watching for 1110 and 1100 to break.  Beyond that, expect flat markets after tomorrow.
That’s it for tonight…
Skål!
金币:
奖励:
热心:
注册时间:
2006-7-3

回复 使用道具 举报

 楼主| 发表于 2009-4-1 06:30 | 显示全部楼层
November 18th, 2008 12:50 pm Intraday Update 135 Comments

UPDATE 12:40pm EST: I have been quiet this morning as there was really not much to do except for daytrading the futures. After the initial rally we eventually dropped through the 858 retracement level, which is also close to the 23.6% fib line (863.37) on my chart. There is really not too much support below until the 836 weekly retracement line - let’s see if it observes that one, otherwise there is the 826 daily one.

So far it seems that the trend continues to favor the downside, although I am very cautious with predictions as this is expiration week. FYI - the flat scenario appears to be out of the race as we have dropped through 849 (the prior low of what Berk and I count a 4th wave down). Again, there are various ways of how to count the tape of the past few days, but it really doesn’t matter as long as we continue towards the downside.
UPDATE 1:16pm EST: We are nearing the 838.5 pivot on the ES futures and are touching the 350 pivot on the Yen, which is a bit overbought on a daily basis. I think we might get a reversal here - be careful out there, my obnoxious leeches!
UPDATE 2:29pm EST: I just calculated today’s long reversal levels for Berk. Seems we’re right at the 1132, which I give at least 60% today - probably more like 80%:

UPDATE 3:15pm EST: Okay, we just bounced off the 350 pivot on the Yen - it’s stronger than I thought today and is doing the Chinese Snake Wiggle around the 80% on my stochastics. In any case, we need to see this level breached, otherwise we won’t see a rally in equities. If you’re on the bearish side: NQ is dropping towards 1124 S2 pivot - as it’s leading today a drop below might (just might) bestow us with a sell off.
At least one more low to go…November 17th, 2008 8:41 pm Market Forecasts 95 Comments

The markets have put us in a position where we will soon be able to eliminate a number of options.  Quickly going out of style, the 4th wave flat targeting 1350-1400, will likely be eliminated with a push below 1149.  The complex correction remains on the table for the moment, but so long as we continue lower, that option will likely be pulled.
That leaves us with the old (discarded) triangle or the ending diagonal.  Should the triangle be leading us lower, we would expect a swift movement lower, that would continue all the way through Friday.  If it is the ending diagonal, we would continue to expect the whips to which we have become accustomed.  Depending on how we count the ending diagonal, we could expect a drop from here, or another move higher.  It is all here to see in this nice chart.

But what is more striking than what wave we are in, the chart displays we are in fact heading lower.  Check out the resistance line on the MACD.  Nice huh.  Now know that this line remains unchanged from 10/16!  Yup, more than 1 month ago, I was plotting this resistance, noting the divergence, and low and behold… Not once, not twice, but three times has this line been tested, and the consensus is… More downside.
I mentioned last week about the banks ($BKX // XLF) breaking their lows, and that this is a quality sign for the bears.  Notice today, the trend continue with a lower close.  I think there is still some considerable downside in $BKX.  XLF is looking a little cheap, and at all time lows, one can only speculate on where this would go.  But, since speculator is our name, I would venture that between $8 and $6 would be a nice target.  As I said…more downside.


Mole mentioned last night about the $CPC.  Here is my take on this as well, but we both agree that fear has not peaked, and we should see another spike higher.  I used a 10, 20 and 50 day moving average to track the $CPC.  Notice that the long term (50 day) is still uptrending.  It is starting to taper of, but until we get a full turn down, the trend remains up, which means more fear.  I would expect the 20day to reach around 1.100 and the 10day to get as high as 1.150.  Again, a substantial target, strengthening the case for wave 5 down…
There is also the $NYHL, which also allows for more downside rather than upside.  Again, the 50day remains downtrending, and I would be looking for the 10day to drop between -600 and -750.  The 20day should be looking to test the 50day around -400.  Basically, this chart shows that since mid June, no rally has managed to muster enough strength to get a positive close.  A positive close would indicate that more stocks put in 52week highs than put in 52week lows, which would be a good indication that the market was looking to move higher, not lower.  If I lost you in the explanation, I basically said “No $INDU 36K yet…sorry Beanie.”

This brings me to the $VIX.  I said a break of 77 would have us looking for triple digits.  This has not happened, nor a divergent high, but there is one more thing for which I am watching closely.  That would be a buy signal.  The good news is, to get this, we would need to see the $VIX above 80…minimum (unless $VIX drops from here).  Considering the range-bound nature of Mr. $VIX over the past 2 months, I am expecting some action soon.
For those of you who don’t know, or are like Gumbo and forgot, I will toss out my list of high-beta stocks.  Caveat Emptor: These stocks are LEADERS… leading down and leading back up.  Watch them closely as we approach our final lows (should still be a few days to weeks), as they will pull up real hard.
GOOG, FSLR, BIDU, MA (almost anytime I am buying puts, I am buying these (i.e. core positions)).  From that I throw in some Ag picks; CF, POT, BG, some energy; CHK, CRK, some minerals; GMXR, CCJ.  Finally I round it out with AAPL, RIMM, WYNN (used to be LVS), ICE, DRYS, and GNK.  Most of these should be no surprise.  I feel that I know the majority of these stocks very well, and I strongly recommend watching and learning how individual stocks, that suit YOUR preferences, move on a daily basis.
That is it for today.  Should we break lower tomorrow, we could get a nice drop down to test the prior lows.  As before, watch for institutional buying around these levels.  Beyond that, expect standard expiry antics…
Skål!
金币:
奖励:
热心:
注册时间:
2006-7-3

回复 使用道具 举报

 楼主| 发表于 2009-4-1 06:31 | 显示全部楼层
November 17th, 2008 12:27 pm Intraday Update 158 Comments

UPDATE 12:25pm EST: I have been following the tape a little bit this morning and really didn’t have much to say. There is a lot of indecision in the market and I don’t feel like forcing a trade. Until something dramatic happens I’m staying in cash. In the interim, feast your eyes on today’s retracement level chart. The full lines are the weekly RTs and the dotted ones the daily ones.

UPDATE 1:56pm EST: I guess I’m not the only one who’s falling asleep today. Market is good for some scalping - actually jumped in a few times, but this type of trading is usually not my cup of tea. Perhaps we’ll get a bit more momentum towards the close, but right now the wave count remains a toss up. Could go either way. We seem to be stuck below the 1182 pivot on the NQ - as the TNX is pointing down I don’t give it much of a chance of breaching today, but it’s expiration week and anything is possible. Stay vigilant my dear leeches, and don’t put in more than 5% of your capitial. This is whipsaw central, baby!
UPDATE 3:03pm EST: Wow, light sweet crude futures just dropped below 55. Baaaaad for equities. Interestingly FSLR has been climbing the charts today. Otherwise today is a coin toss - which has been elevated as the indicator of the day.
UPDATE 3:35pm EST: Since you guys probably are bored to death anyway, here’s some required reading. I would be really upset if the last six months hadn’t numbed me so much. Meh - nobody’s going to do anything - the gnomes and pirates have attached themselves permanently onto the public spigot, and they love it. It will take some real action to put some fear into these cats - maybe after January 20th, but I’m not keeping my hopes high.
UPDATE 7:21pm EST: This must be the quote of the day:
There are plenty of stupid people out there, and by God, we need their help. — Tim Knight
LOL
Welcome to the House of PainNovember 16th, 2008 7:06 pm Market Forecasts, Market News 132 Comments

I’m not going to sugar coat it for my steel rats - this week is going to be ugly. If you thought last week was bad, better prepare yourself for market makers and institutional traders equipped with 20 foot long cattle prods, ruthlessly inflicting maximum pain on us huddled masses of hapless option traders.
Here is a rough visualization of what awaits us:
You have two choices for the looming week of misery: Either embrace the pain or run for cover in the form of cold hard cash. For there is no shame in hiding, as we are furry but intelligent creatures who know that munching on a piece of cheese from the comforts of a cushy front row seat sure beats getting body slammed by some blood hungry market maker bent on inflicting his quota of flesh wounds on option trading mail order chumps like you. But for the intrepid super rats among you, those equipped with grapefruit size chrome plated cohones, there just might be hope, as Evil Speculator will be your shining light, your unrelenting compass guiding you through the inhospitable terrains of expiration week. Maybe you come out bruised but alive - but please make sure to leave a proper note for your loved ones and best equip yourself with a some dog tags so that the NYSE will be able to identify your charred remains.
Anyway, enough with the pep talk, let’s go on with business:

Boy, this chart is getting messy. But right now we are bit in limbo, as there are various scenarios on the table that should be given similar probabilities, as a consolation some are less painful then others. I will talk about the really fun one, marked in green, a bit later - but let’s start with orange, which basically assumes that the old triangle actually concluded last week with a whimper of an {e} wave (triggered by the Chinese bailout announcement) and then proceeded to trace out a {i} of minor 5 down. Then we painted the notorious Thursday u-turn which was the beginning of an a,b,c correction that is expected to conclude around the 950 area this week. After that we should quickly push to the downside and complete minor 5 of intermediate (3) - the target area is difficult to project as of right now but it should be in the lower 700s.
The blue scenario is very interesting and I have added the alternate wave count in blue labels on the charts above and below. The thought here is that we traced out a large flat, which will be followed by what is referred to as a running flat by Elliotticians.

I’ve taken the liberty to draw some example wave patterns, so all this makes sense to you leeches. The first image shows a flat, which is a fancy term for a zigzag corrective wave that received a lot of trend resistance. The next image shows a variation of the theme, an expanded flat, which contains a price extreme beyond that of the preceding impulse wave. In expanded flats, wave B of the 3-3-5 pattern terminates beyond the starting level of wave A, and wave C ends more substantially beyond the ending level of wave A, shown for bear markets in the second image.
What we ware finding ourselves in (no matter which of the wave counts above you buy into) is called a sideways combination of at least two corrective patterns, which is also called a double three. This can be a zigzag followed by a triangle, a zigzag followed by a flat, or a flat followed by an expanded flat. The latter is what the blue scenario is based on and is simulated as a simplified wave count in the third drawing above. Let’s hope this makes it a bit more clear as I will be testing you leeches later this week. Anyone who fails will be thrown into the dungeon of doom, and remember that there is no butter in hell (look that up under Cold Comfort Farm).

Now on to the green scenario - which is the most fun as it would hurt the most bulltards out there. This assumes that we have painted a more vertical double three starting Thursday afternoon and ending Friday right before the drop. Looking at this slightly zoomed in chart, it’s clear how a move like this can be easily mistaken for a regular motive 5 wave correction followed by small retracement. The reason why we are considering this crazy scenario is that the assumed third wave of the long push up is a bit short. Let’s zoom in a bit more:

Aaaah, that’s better. Now, as you can see it’s easy to count this wave as a 1-2-3-4-5 motive wave which ended on Thursday at the closing bell. But if you look carefully it becomes clear that the third wave is actually the shortest of them all, and that violates Elliott Wave rules. The 3rd can never be shortest - it can be shorter than either 1 or 5, but it needs to be longer than one of them. So, the conclusion is that something else is going on here, which leads us to the green scenario. Now, that you understand what a double three is, you may realize why it is possible (but not assured in any fashion) that wave {ii} of minor 5 may have concluded on Friday afternoon. Of course the mouth breathers out there see only a small correction and expect the rally to continue pushing upwards. Maybe they’re right, which would confirm the blue scenario but if we keep dropping on Monday then you’ll know what’s up.
The in between scenario is marked as orange, as it assumes we’re going up a bit more and then plunge. And in case you wonder, at this time there is no evidence to support the notion that we have finalized wave (3) and are already inside intermediate wave (4). There simply has been no capitulation on the parts of the bulls - despite harrowing negative breadth on Wednesday and early Thursday, bullish sentiment has been steady.

Need proof? Let’s take a look at the McClellan (a medium term sentiment indicator), which is currently at -20. Call me ueber-bearish, but this simply does not look like a capitulation to me. Quite frankly, we haven’t seen enough blood letting on the part of the bulls just yet.
Also, the spread between the Moody’s BAA and TYX yields is still stuck around the 5 point mark - this is not exactly what I would expect to see at the onset of intermediate (4), which - to make that clear - will be a major multi-month corrective wave to the upside (or at least sideways).

The Baltic Dry Index is still flat as a flounder - this is bad, ladies and rats. Nothing is getting shipped and to get an idea of the grave implications of basic materials rotting in harbors here’s a great write up on the situation by Yves Smith. By the way, one of my favorite sites - the kid is extremely bright and works day and night to roll over the rocks under which the gnomes are hiding from sunlight. In any case, what you as traders should care about is that credit remains frozen.

Still not convinced? Tough crowd! Well, take a look at our old friend, the TED spread (difference between 3-month LIBOR and 3-month treasury yield). It’s pointing to the upside again and the permabulls better sacrifice a goat to make sure that this thing doesn’t continue on its current trajectory.

Some of you might remember the Nova/Ursa ratio I mentioned last week. We are still in distinct bullish territory - the thick line is the ratio and the thin one is the OEX.

A final piece of evidence in terms of bullish sentiment is a weekly chart of the CBOE Options Put/Call Ratio Index. Right now we’re hovering around the 1.0 level which is basically neutral. Again, I don’t see any fear here, which again is a strong indication that wave (3) has not concluded just yet.
I will touch on Gold once I see a clearer pattern - right now it’s a bit all over the place and it seems it simply follows the market. Keep an eye on crude as we hit 56 on Friday. OPEC has already started the proverbial ‘production cut’ saber rattling - many of those cats must be selling the black gold at production cost right now. I would expect a floor in crude prices fairly soon, so be careful with anything in the energy sector. I saw some of you guys posting about refineries - you don’t want to be long those guys when crude starts pushing upwards again.
I actually wanted to post a DXY (Dollar index) chart but Prophet is not cooperating - I really hope those constant occasional (ahem) data problems will be fixed at some point. In any case - the buck is going up, bank on it - minimum target is around 90, maybe even higher.
Alright, I think I have done enough damage for today - enjoy your evening and don’t be shy with the comments. If you have nothing better to do check out Denninger’s new vid - he really cracks me up - reminds me of a cat that just caught a mouse:
金币:
奖励:
热心:
注册时间:
2006-7-3

回复 使用道具 举报

 楼主| 发表于 2009-4-1 06:31 | 显示全部楼层
November 17th, 2008 12:27 pm Intraday Update 158 Comments

UPDATE 12:25pm EST: I have been following the tape a little bit this morning and really didn’t have much to say. There is a lot of indecision in the market and I don’t feel like forcing a trade. Until something dramatic happens I’m staying in cash. In the interim, feast your eyes on today’s retracement level chart. The full lines are the weekly RTs and the dotted ones the daily ones.

UPDATE 1:56pm EST: I guess I’m not the only one who’s falling asleep today. Market is good for some scalping - actually jumped in a few times, but this type of trading is usually not my cup of tea. Perhaps we’ll get a bit more momentum towards the close, but right now the wave count remains a toss up. Could go either way. We seem to be stuck below the 1182 pivot on the NQ - as the TNX is pointing down I don’t give it much of a chance of breaching today, but it’s expiration week and anything is possible. Stay vigilant my dear leeches, and don’t put in more than 5% of your capitial. This is whipsaw central, baby!
UPDATE 3:03pm EST: Wow, light sweet crude futures just dropped below 55. Baaaaad for equities. Interestingly FSLR has been climbing the charts today. Otherwise today is a coin toss - which has been elevated as the indicator of the day.
UPDATE 3:35pm EST: Since you guys probably are bored to death anyway, here’s  I would be really upset if the last six months hadn’t numbed me so much. Meh - nobody’s going to do anything - the gnomes and pirates have attached themselves permanently onto the public spigot, and they love it. It will take some real action to put some fear into these cats - maybe after January 20th, but I’m not keeping my hopes high.
UPDATE 7:21pm EST: This must be the quote of the day:
There are plenty of stupid people out there, and by God, we need their help. — Tim Knight
LOL
Welcome to the House of PainNovember 16th, 2008 7:06 pm Market Forecasts, Market News 132 Comments

I’m not going to sugar coat it for my steel rats - this week is going to be ugly. If you thought last week was bad, better prepare yourself for market makers and institutional traders equipped with 20 foot long cattle prods, ruthlessly inflicting maximum pain on us huddled masses of hapless option traders.
Here is a rough visualization of what awaits us:

You have two choices for the looming week of misery: Either embrace the pain or run for cover in the form of cold hard cash. For there is no shame in hiding, as we are furry but intelligent creatures who know that munching on a piece of cheese from the comforts of a cushy front row seat sure beats getting body slammed by some blood hungry market maker bent on inflicting his quota of flesh wounds on option trading mail order chumps like you. But for the intrepid super rats among you, those equipped with grapefruit size chrome plated cohones, there just might be hope, as Evil Speculator will be your shining light, your unrelenting compass guiding you through the inhospitable terrains of expiration week. Maybe you come out bruised but alive - but please make sure to leave a proper note for your loved ones and best equip yourself with a some dog tags so that the NYSE will be able to identify your charred remains.
Anyway, enough with the pep talk, let’s go on with business:

Boy, this chart is getting messy. But right now we are bit in limbo, as there are various scenarios on the table that should be given similar probabilities, as a consolation some are less painful then others. I will talk about the really fun one, marked in green, a bit later - but let’s start with orange, which basically assumes that the old triangle actually concluded last week with a whimper of an {e} wave (triggered by the Chinese bailout announcement) and then proceeded to trace out a {i} of minor 5 down. Then we painted the notorious Thursday u-turn which was the beginning of an a,b,c correction that is expected to conclude around the 950 area this week. After that we should quickly push to the downside and complete minor 5 of intermediate (3) - the target area is difficult to project as of right now but it should be in the lower 700s.
The blue scenario is very interesting and I have added the alternate wave count in blue labels on the charts above and below. The thought here is that we traced out a large flat, which will be followed by what is referred to as a running flat by Elliotticians.

I’ve taken the liberty to draw some example wave patterns, so all this makes sense to you leeches. The first image shows a flat, which is a fancy term for a zigzag corrective wave that received a lot of trend resistance. The next image shows a variation of the theme, an expanded flat, which contains a price extreme beyond that of the preceding impulse wave. In expanded flats, wave B of the 3-3-5 pattern terminates beyond the starting level of wave A, and wave C ends more substantially beyond the ending level of wave A, shown for bear markets in the second image.
What we ware finding ourselves in (no matter which of the wave counts above you buy into) is called a sideways combination of at least two corrective patterns, which is also called a double three. This can be a zigzag followed by a triangle, a zigzag followed by a flat, or a flat followed by an expanded flat. The latter is what the blue scenario is based on and is simulated as a simplified wave count in the third drawing above. Let’s hope this makes it a bit more clear as I will be testing you leeches later this week. Anyone who fails will be thrown into the dungeon of doom, and remember that there is no butter in hell (look that up under Cold Comfort Farm).

Now on to the green scenario - which is the most fun as it would hurt the most bulltards out there. This assumes that we have painted a more vertical double three starting Thursday afternoon and ending Friday right before the drop. Looking at this slightly zoomed in chart, it’s clear how a move like this can be easily mistaken for a regular motive 5 wave correction followed by small retracement. The reason why we are considering this crazy scenario is that the assumed third wave of the long push up is a bit short. Let’s zoom in a bit more:

Aaaah, that’s better. Now, as you can see it’s easy to count this wave as a 1-2-3-4-5 motive wave which ended on Thursday at the closing bell. But if you look carefully it becomes clear that the third wave is actually the shortest of them all, and that violates Elliott Wave rules. The 3rd can never be shortest - it can be shorter than either 1 or 5, but it needs to be longer than one of them. So, the conclusion is that something else is going on here, which leads us to the green scenario. Now, that you understand what a double three is, you may realize why it is possible (but not assured in any fashion) that wave {ii} of minor 5 may have concluded on Friday afternoon. Of course the mouth breathers out there see only a small correction and expect the rally to continue pushing upwards. Maybe they’re right, which would confirm the blue scenario but if we keep dropping on Monday then you’ll know what’s up.
The in between scenario is marked as orange, as it assumes we’re going up a bit more and then plunge. And in case you wonder, at this time there is no evidence to support the notion that we have finalized wave (3) and are already inside intermediate wave (4). There simply has been no capitulation on the parts of the bulls - despite harrowing negative breadth on Wednesday and early Thursday, bullish sentiment has been steady.

Need proof? Let’s take a look at the McClellan (a medium term sentiment indicator), which is currently at -20. Call me ueber-bearish, but this simply does not look like a capitulation to me. Quite frankly, we haven’t seen enough blood letting on the part of the bulls just yet.
Also, the spread between the Moody’s BAA and TYX yields is still stuck around the 5 point mark - this is not exactly what I would expect to see at the onset of intermediate (4), which - to make that clear - will be a major multi-month corrective wave to the upside (or at least sideways).

The Baltic Dry Index is still flat as a flounder - this is bad, ladies and rats. Nothing is getting shipped and to get an idea of the grave implications of basic materials rotting in harbors here’s aon the situation by Yves Smith. By the way, one of my favorite sites - the kid is extremely bright and works day and night to roll over the rocks under which the gnomes are hiding from sunlight. In any case, what you as traders should care about is that credit remains frozen.

Still not convinced? Tough crowd! Well, take a look at our old friend, the TED spread (difference between 3-month LIBOR and 3-month treasury yield). It’s pointing to the upside again and the permabulls better sacrifice a goat to make sure that this thing doesn’t continue on its current trajectory.

Some of you might remember the Nova/Ursa ratio I mentioned last week. We are still in distinct bullish territory - the thick line is the ratio and the thin one is the OEX.

A final piece of evidence in terms of bullish sentiment is a weekly chart of the CBOE Options Put/Call Ratio Index. Right now we’re hovering around the 1.0 level which is basically neutral. Again, I don’t see any fear here, which again is a strong indication that wave (3) has not concluded just yet.
I will touch on Gold once I see a clearer pattern - right now it’s a bit all over the place and it seems it simply follows the market. Keep an eye on crude as we hit 56 on Friday. OPEC has already started the proverbial ‘production cut’ saber rattling - many of those cats must be selling the black gold at production cost right now. I would expect a floor in crude prices fairly soon, so be careful with anything in the energy sector. I saw some of you guys posting about refineries - you don’t want to be long those guys when crude starts pushing upwards again.
I actually wanted to post a DXY (Dollar index) chart but Prophet is not cooperating - I really hope those constant occasional (ahem) data problems will be fixed at some point. In any case - the buck is going up, bank on it - minimum target is around 90, maybe even higher.
Alright, I think I have done enough damage for today - enjoy your evening and don’t be shy with the comments. If you have nothing better to do check out Denninger’s new vid - he really cracks me up - reminds me of a cat that just caught a mouse:
金币:
奖励:
热心:
注册时间:
2006-7-3

回复 使用道具 举报

 楼主| 发表于 2009-4-1 06:32 | 显示全部楼层
November 15th, 2008 7:38 pm Trading 54 Comments

Yes, it’s that time of the month again - we heading into the widely dreaded option expiration week. Which is a great occasion to once again remind everyone of Tom Sosnoff’s 10 Golden Rules for Expiration Week:
  • Look for flat and range-bound markets after Wed. After a large move (usually on hump day - Wednesday), the markets go flat. Reason is that most of the churn is done at the move day. Don’t expect large back-to-back moves. Look for flat and range bound trading.
  • There tends to be a continuation of the major trend. Buy the dips - sell the rips! Expect to get buying/selling pressures into the following week. Don’t be a contrarian! If it’s bullish you should be buying dips, if it’s bearish you should be selling rallies.
  • Wed-Fri of expiration week have historically a bias to the buy side. There is an enormous amount of arbitrage going on. It happens to be one of the more bullish times of the months. Most professional traders are very flat during that time - and if for instance they have an open SPY position, it makes them very nervous to have exposure to the upside.
  • It is best to be out of your front-month positions by Wed of expiration week. If you are expecting a certain move and it hasn’t happened by Wed, you want to get whatever salvage value there’s left. Or if you’re in a good position that cost you some money, you don’t want to go into the delta/gamma risk and Wed should be your close day. Don’t get too greedy during expiration week.
  • The Monday after expiration is one of the most liquid trading days of the cycle. Under normal circumstances (not right now) it is also the best day to get an option as close as possible to theoretical value, and it’s a great day to get involved if you missed establishing positions the prior week. It’s one of the more intense days and everybody is at work. Traders are less at edge. It’s a good day to establish new positions - as there is no front month expiration risk.
  • Stocks and options rarely lie going into expiration week. For whatever reason stocks that are strong tend to stay strong, weak stocks stay weak. Usually the market is very fairly priced.
  • Jan/Apr/Jul/Oct tend to be bullish months around expiration. Triple witching months tend to be a little flat. You have a triple witching cycle which is March, June, September, and December (3/6/9/12). The months following (1/4/7/10) have a historical bias to the upside.
  • Be strike-price aware! Remember that options have a tendency to go to the number that hurts the most people, which is a strike, some also call this pin-risk. Over time, certain stocks have a tendency to go the next strike price. Even the averages have a tendency to go to their nearest strike.
  • Close ATM positions prior to expiration. Your target spot is your at-the-money strike for at least half your positions no later than Wednesday. The expected move in the following days will take you away from your sweet-spot price. Again, don’t be greedy - we all know what happens to pigs!
  • Familiarize yourself with the 4 major futures food groups. Look at the Russel 2000, Nasdaq, S&P 500, and the Dow - a strong index will stay strong, and a weak index will be weak. You have to watch what pushes the markets: /ES, /NQ, /YM, /TF, as well as SPX, NDX, VIX.
Right now we’re seeing a lot of capital out there seeking small returns. We’re in a very turbulent marketplace right now, with very tight markets. We’re also seeing a lot less liquidity, which changes our trading.
Finally, a pertinent theory is that of max pain - if you happen to buy into the evil nature of market makers then here’s a great resource Zigzag posted about on Friday:


I plan to post the weekend forecast sometime tomorrow afternoon, but this should give you leeches enough to chew on. In the interim I would welcome some comments regarding your thoughts on the max pain theory. You also find a new poll on the right sidebar - I’d like to get a count on how many of you rats actually buy into this.
Cheers!
Intra-Update: Down But Not OutNovember 14th, 2008 10:57 am Intraday Update 230 Comments

UPDATE 10:49am EST: First up, we need to clean out any prevailing ‘recency bias’ out of you leeches, which is one of the deadly cognitive biases affecting even the best traders. Here is some therapy that will lift your spirits:

For the thick ones amongst you - the idea here is that we will prevail as we are stainless steel rats, turning adversity into advantage is our specialty. Think we’re down and out? Better use a stick to check if we’re still ticking. Getting your ass kicked every once in a while is the cost of doing business, and if you will that let discourage you then better start looking for a day job right now.
Secondly, watch the 879 pivot on the SPX - if that one breaches I think we are going down. However, looking at the tape right now, despite the Yen pushing up and the TNX clearly dropping I don’t see much weakness - there was a bit of a drop but we don’t want to jump in here in either direction before we see a clear signal. So wait for those pivots if you want to live.
I will post the daily retracement level chart when I’m done re-labeling it with an updated EWT count. Obviously things have shifted since yesterday’s ugly close.
On an up note: Go to GOOGLE (the website, not the chart, you dummies) and type in ’speculator’ - lo and behold - we made it to page #1 - wohoooo!!! (throws 5 recyclable confetti attached to rubber bands).
UPDATE 2:17pm EST: Okay, sorry for the long period of silence but this took me a while:

It’s a little preview of the weekend update. I know this is messy but we’re in a messy spot and it’s extremely difficult to show all the possibilities open to us right now (and I even left one out). However, in the interim we seem to be predicated to move towards the upside. If we see a considerable drop the probabilities change again. I know the wave count won’t make sense to most non Elliotticians, but I heavily consulted with Berk on this and it’s the best we can come up with as of now.

« Older Entries
Newer Entries
金币:
奖励:
热心:
注册时间:
2006-7-3

回复 使用道具 举报

 楼主| 发表于 2009-4-1 06:33 | 显示全部楼层
November 13th, 2008 10:17 pm Market Forecasts 86 Comments

Gotta respect the evil at play in the markets today.  I walked home with mud in my face, but I am able to trade another day.  It was rough.  I was talking to Mole this morning and mentioned that after the first rally, triggered by the break of the prior $NDX low, there was not enough institutional buying around that level the second time around.  Something just wasn’t right.  They were crafty.  They took a lot of us by surprise, letting 1149 go with ease the second time around, and even letting $INDU 8K break without much struggle.  However, a measly 35 points below 8K, with bears licking their chops and adding puts on the break downs, the black boxes kick in.  And damn did they kick in.  THERE was my institutional buying.  It was quite the kick in the crotch.  However, though I am evil, I can admit defeat when I am out traded.  Today, the black boxes won.  They caught me like a deer in the headlights, but I learned, and we will battle yet again…
As I write, I am chatting with Mole, and I will show you something I noticed that is SCREWED up.


**DISCLAIMER**  This is not an attack on any one particular charting service, as you can see there is a discrepancy between all of them.  Rather, it is a VALUABLE warning to traders to make sure you have a back up feed.  Personally, I have 4 available to me at any time (though I USUALLY only use 2), and I have had bad data on EVERY SINGLE service I have had since I started trading. **DISCLAIMER**
But the point is… it pays to have multiple feeds.  You don’t need to pay 3K for them, but a back-up is ALWAYS a good idea.  I wish I was at my standard work set-up so I could confirm it with yet another (2), but the tendency says… We rose on expanding(ish) volume (though prophet’s MACD was rising as if volume was expanding).
So as you might imagine, today’s tape put quite the kink in my analysis.  The volume was big and the breadth was QUITE bullish.  The ratio needs to be taken as an inverse for bullish action (i.e. (1/0.11) = 90% upside).

So, today’s action was much like the move in late October. In fact, the $TRIN visited levels (on the 5day moving average) equivalent to 10/31.  I expect the 5day $TRIN to break the Nov 3rd low, but odds strongly favor a top once the 5day gets into (or near) the 0.80 - 0.90 range.

It was scary for the bears, but (in retrospect), it looks quite playable.  We are most likely in a flat for wave 4, looking for 1343, 1432, and 1487.  Any push past 1488 in $NDX would negate the flat and suggest we are rallying in a larger wave [2], wave [4], or heaven forbid, Beanies infamous wave [5], $INDU 36K…
Seriously though, we should consider this until 1488 is breached, as that would be our maximum.  That said, we know that we have at LEAST 100 points ($NDX, another 500 in $INDU ($DJI)), and I will pick up some ITM index ETF calls until we get near the top.  The maximum target in $INDU ($DJI) is 10459.44, that would have wave 4 overlapping wave 1 and that would have us looking higher.  Again though, don’t let me get ahead of myself.  We would still need to breach 9500 and 10K before we can think about that, and we are likely in wave [3] of [C], meaning we would expect a strong push tomorrow, followed by some sideways chop for a few days (expiry week), followed by a pop.  Then we get our drop!


The other option at this point, we be a wave [5] ending diagonal.  If that were the case, we would be looking at the majority of that wave being done at this point, and targeting around 1050 in the $NDX.  The reason that I find this unlikely is the nearly complete reversal of yesterday’s decline, not only in price (bullish engulfing) but also in breadth.  IF this wave [4] of [5] of an ending diagonal (just about to make a BIG move up after a final drop, non-Elliotticians), the breadth and volume would indicate a VERY LARGE move up, as that is some serious expanding volume.

Finally, while there remains a third option on the table, which would be Gumbo’s triple bottom break out.  This in Elliott, terms would be equivalent to intermediate wave (3) being complete, and this is the very beginning stages on intermediate wave (4).  From a TA standpoint, we would need to see a break of 1000 in the $SPX.  However, non-Elliotticians, a break on 1000 on declining volume, and weakening breadth (we will keep you posted on that), would be a GREAT fake-out move, as a maximum target for the wave [4] flat would be 1080, the mid-point of a confirmed triple bottom break-out.  Something to chew on.
With that, I am changing short term indicator to up until we are within our first target range.  The medium term will be up-down, indicating that we might get to start our descent withing the next 5 days.  The long term remains down, as we have yet to breach levels anywhere close to forcing us to change this, and we still believe we will see lower lows on the year.
Just to note also, I believe today (but possibly tomorrow) was a full moon.  I am sure Moony could shed some additional light on that…  Something to think about, for those of you that DON’T believe in “Hocus Pocus!!”
Hope that shed some light on the day’s action.  Lesson of the day… Don’t mess with institutions.  They will kick yo’ ass (on the selling side too).
Skål!
金币:
奖励:
热心:
注册时间:
2006-7-3

回复 使用道具 举报

 楼主| 发表于 2009-4-1 06:34 | 显示全部楼层
November 13th, 2008 9:36 am Intraday Update 331 Comments

UPDATE Opening Bell: Bulls are storming the beaches right at the open of the gate - I was right to not trust the tape yesterday. Maybe this is the rally we are waiting for, allowing us to load up on massive short positions. Just FYI - this rally has no volume compared with what I saw yesterday - I mean nada, zilch, nichts, rien. While Berk and I get our bearings straight here are today’s retracement levels.

UPDATE 10:46am EST: IF you took a hammering in the rally up - just FYI - YEN has been holding at 1.0405. IF that one is being breached I will cut my short positions.
UPDATE 11:12am EST: Damn, that was a bit scary - glad I didn’t sell at the top. Not sure we’re out of the woods just yet, but I’m watching that Yen pivot like a hawk.
UPDATE 11:20am EST: Wow - crude just tanked by 2 points in 20 minutes. I wonder when my FSLR puts are going to make a move.
UPDATE 12:19pm EST: Just wanted to let you guys know that we just pushed below the low of the {b} wave at 845.27 - this means that the triangle is officially out of the picture. We either go straight down from here or we rally.
UPDATE 12:49pm EST: We just made new lows on the SPX - wait for it though - the Yen is approaching a pivot and I doubt we’ll push through it at the first try. Yen looking very overbought right now (87%) - might need some recharging on my stochastics. Wait for a rip folks!!
UPDATE 1:06pm EST: Watch the 819 pivot on the ES futures.
UPDATE 1:51pm EST: This is the new wave count for now - we need to turn around pretty much right here or I’m going into cash.

UPDATE 2:21pm EST: I hope this chart helps you guys - at least this makes the most sense to me. If we breach through the 50% fib, which also happens to be a retracement, it’s probably best to admit defeat and go into cash.

Actually, the 870 is a long retracement level, but I’m sticking with that one anyway due to the fibs.
UPDATE 2:48pm EST: Not sure what to tell you guys - this is looking pretty ugly. I have upgraded this spike now to wave minute {iv} up and if we breach the highlighted area the part is over for the bears. The rules are the rules.

UPDATE Closing Bell: Well, I have to go now and apply Vaseline to where it hurts the most. Berk will do a quick update tonight as I’m completely worn out and will do the weekend update instead. BTW, am I the only one who thinks this is funny?

Hat tip to all the institutional traders out there. You have to acknowledge true evil when you find yourself in its presence. Good job guys - you completely wiped the floor with the bears today.
金币:
奖励:
热心:
注册时间:
2006-7-3

回复 使用道具 举报

 楼主| 发表于 2009-4-1 06:34 | 显示全部楼层
November 12th, 2008 10:07 pm Market Forecasts 79 Comments

Today’s action was a rough blow to the triangle, but we cannot completely eliminate it yet.  Yes, it looks funny, it smells funny, and it is not very likely here, but is has not been PROVEN incorrect.  With that, the triangle will be tossed aside with a break of 1149.12 in $NDX.
Today, however, we did have a lower CLOSING low, signaling yet another lower low on the decline.  What does that mean?  Wave [5] down is most likely underway.  That said, we are likely inside wave [3] of [5] down right now, and I see wave [5] itself bottoming out around 1000.  1100 could be a target if wave [5] is tracing out an ending diagonal.  After testing 1150, I would expect a bounce, as that is our prior low.  From the top of that bounce (should we get it) will be the best entry for this move down.  Targets for that would be 1175 and 1200.  Of course, as I said before, it would screw the most people if we just gapped down from here, however, given such strong resistance (i.e. prior major low), gapping through that level does not seem likely for me.

Another strong piece of evidence for wave [5] down, aside from the ghastly 9:1 negative breadth today, is the XLF.  In the past, when we were dealing with wave [2], we said that the markets could not go lower without the financials dropping too.  Well, XLF decided to put in a lower low today, confirming the notion that the market wants to drop.

I had said on Monday that we needed to drop soon, hard, and impulsively.  Thus far, that plan has played out nicely with most markets trading nearly 10% lower than Monday’s close.
I also talked about the $VIX on 11/04, saying that had we closed outside the 2.0 BB we would be set up for a “sell signal.”  We did not close outside, but completed the other requisite steps for a “confirmed sell signal,” further affirming my notion that we should be in for another 10-15% (or more) sell-off.  During this state of capitulation, I would expect the $VIX to be topping out around 100, which SHOULD act as resistance.  Clearing 77.5, for me, would be a strong indication.

Here is a chart of FSLR, as I see it is nearing double digits again, 6 days from my sell recommendation.  Yes folks, I still believe there is more downside on this puppy.  First target is mid-70s, but I could see as low as 50 in the cards.

Another beautiful thought (I am not going to post the chart) is GOOG.  Many, if not all, of us played the break-out beneath 300.  Some of us took profits, and some are holding, but either way, there is more downside there, but the markets were watching this too.  GOOG below 300, and giving no effort of a retest (yet), is yet another strong piece for the bearish case.   Should GOOG break 273 (my next target), there is nothing but air until 200 (with a small argument for 217).  Think about this folks… Another 70 points down in GOOG…
I leave you with those pleasant thoughts…
Skål!
金币:
奖励:
热心:
注册时间:
2006-7-3

回复 使用道具 举报

 楼主| 发表于 2009-4-1 06:35 | 显示全部楼层
November 12th, 2008 7:34 pm Market News 34 Comments

I think we got ourselves a real blog going here - 317 comments for an intra-day post ain’t bad. Berk will do the update tonight, but real quick off the cuff: It seems that the triangle pattern is history, at least judging by where the futures are right now. Technically, I need to see another drop in the averages, but it’s almost academic right now. The next two days should be extremely interesting - and be assured that Berk and I will share whatever we decide to trade. Hope y’all had a good day - I banked some modest coin only as I was extremely distrustful of the tape.
While Berk labors hard to assure you leeches don’t stumble around like zombies tomorrow, check in with one of my favorite home boys, Karl Denninger:

In that context - let’s call this my favorite chart of the year:

The power of foresight:

The question we should ask ourselves is: Where do we expect the SPX to be 6 months from now. Berk and I will probably present a pertinent post in a week or two once we are starting intermediate wave (4) to the upside.
Cheers!
Intra-Day Update: Yaaawwwwn….November 12th, 2008 9:52 am Intraday Update 329 Comments

UPDATE 9:50am EST: I should have stayed in bed this morning - looks like it’s going to be a boring morning at least. In the interim here are the daily (and weekly) retracement levels. Word has it 2sweeties is working on hourly - this is getting out of hand - LOL

UPDATE 10:27am EST: Light Sweet Crude Oil futures hit 57.35 this morning.
UPDATE 10:50am EST: Just want to let you guys know what we are now sitting in a tight channel:
  • YM: 8360 - 8500
  • NQ: 1188 - 1200 (very tight and I think it will call the shots for a while)
  • ES: damn OX feed died on me - sorry
Yen is overbought short term, so I don’t expect a breach of the lower pivots anytime soon. Maybe later today or towards the close. TNX is hanging around at today’s lows (currently 36.77 -2.08%) - that’s good for us bears.
UPDATE 11:20am EST: Screen grab of the headlines. I for one smell desperation:

And the market does….. wait for it…. NOTHING! Just 2 months ago these headlines would have been good for at least a 500 point rally in the Dow.
UPDATE 12:45pm EST: Okay, I see triple bottoms in the ES and the YM on the 3min chart. Also, today’s tape reminds me of yesterday, so I wouldn’t be surprised if a rally was coming. The bulls better get a move on however because the Yen is recharging - otherwise it’ll be a non-event. Now or never. Actually surprising the bulls are not exploiting this more. I’m still in cash because I don’t see a clear signal. The market needs to tell me what I need to do - I’m not going to guess it.
UPDATE 1:01pm EST: In case you cats wonder - this current push to the upside has no meat in it. UVOL is meager compared with the drops. Unless I some volume here I don’t think we cross 8500 on the YM.
UPDATE 1:23pm EST: I knew it!. Anyway, watch 864 on th ES, if that breaks Kansas is going bye bye.
UPDATE 1:52pm EST: Chop chop chop we go - I don’t see any volume in the drops now, not sure what this market is up to. This is like watching paint dry - annoying at best. We’re painting new lows in the ES right now, but somehow I am suspicious about all this action.
UPDATE 2:46pm EST: Most… annoying…. market ….. EVER!!! Make a damn move for f…s sake - I don’t care which way (for the record - I loaded up on some puts though 15 min ago).
UPDATE 3:18pm EST: I don’t like what I see on my indicators - I know we’re going down but I would not grab positions at this point. Not based on emotion but on my own momentum indicator plus the Yen which is not convincing. Be careful my dear rats. BTW, watch 855 on the ES futures - buyer there.
UPDATE 3:27pm EST: Berk and I decided to stay out for the remainder of the trading day. Tape cannot be trusted here.
UPDATE 12:35pm EST: I just adjusted the lines and the triangle scenario, although a bit flat on the bottom, is still valid. As a matter of fact, I would love to see a late day rally here, which would make our job a lot easier. We’re pretty close to some final resolution though, that’s the good news. Otherwise, if we drop much further from here the triangle is officially dead.

UPDATE 3:48pm EST: We just dropped even further (and then reversed) and the triangle idea looks almost dead at this point - technically still valid but it looks very flat in the tooth. Berk and I don’t know what to make of the tape right this second and although it’s tempting to hold puts here into the close as we expect ugly unemployment and retail reports on Thur/Fr we are staying in cash. It feels like as if we would force the issue, and that is never a good sign.
Cheers!
金币:
奖励:
热心:
注册时间:
2006-7-3

回复 使用道具 举报

 楼主| 发表于 2009-4-1 06:36 | 显示全部楼层
November 11th, 2008 9:30 pm Market Forecasts 103 Comments

Finally we’re getting somewhere - while the rest of the trading world seems to be mired in mesh of confusion, Herr Mole had a little eureka moment towards the close. Before we get started, here’s a bit of background music, as this is how I feel today - on the money - spot on - in sync with the market’s every move. Yeah, I know the video is a bit gay, but just focus on the babe in the bikini.
Many folks were surprised by the push up during the final hour of trading. Not me - it became pretty clear that we were going sideways before a big EOD move. It was either to the upside or downside, with different implications. The market Gods decided on up and it bestowed us with new dynamics going forward - I personally think it’s good news.

The chart above shows the larger wave count scenarios. The blue lines & labels pertain to Berk’s favorite, which assumes that wave 5 started on November 5th - the orange lines & labels support the triangle pattern which I have been pimping since mid October. Both scenarios are equally possible right now and to better understand the reasons why lets zoom into the yellow area marked above.

The aggressive push to 917 on the SPX was way too long to be counted as a corrective subwave of lesser degree pertaining to the previous motive wave down. Also, as it breached the low of the previous motive wave down ending on November 7th there are three possibilities:
  • 20% - It is subminuette b of minuette (c) of minute {d}, and we are now in c towards the downside, thus completing {d} of the triangle scenario.
  • 40% - It is minuette (a) of minute {e} to the upside, thus the final leg of the triangle. Equality should get us to about 929, which is a retracement level.
  • 40% - It is minuette (i) of minute {iii} and we are now tracing out a series of 1,2s to the downside. This indicates we are already in minor wave 5 of intermediate (3), which remains Berk’s favorite path.
I’m giving 1 only 20% due to the strong NYSE volume and breadth we witnessed today. Let’s compare yesterday with today:
Monday

Tuesday

Actually the $INDU today changed after the close to 29:1 (Berk sent me those grabs), but at any rate it’s apparent that market breadth was strongly on the negative side, despite the late day rally. This gives more credence to the notion that the we continue to go lower from here on, which in my mind again lowers the probability that we drop by a few more points (completing {d}) just to then rally afterward into wave {e}. The momentum from here should either be strongly down or straight up. I could be wrong on this as there are various ways to interpret this, but it’s academic anyway and we would know by tomorrow morning.
Okay, a few more charts to put things into context - I have nothing on the bond market as today was Veteran’s Day:

Medium term the McClellan could swing either way as it’s exactly at zero.

More longer term we are slightly in bullish territory bordering neutral as well - or is this the ‘new overbought’ based on the previous extremes?

The weekly stochastic is swinging to the upside which also indicates that we need to complete this triangle asap. Some might be tempted to interpret this as a sign that we are rallying straight up from here, but it’s been pointing up for a week now and we have been dropping, so let’s not forget that this is a very slow indicator.
This also ties into what Elliott used to say about triangles: When a triangle occurs in the fourth wave position, wave five is sometimes swift and travles approximately the distance of the widest part of the triangle. Elliott used the word thrust in referring to this swift, short motive wave following a triangle. The thrust down is usually an impulse but can be an ending triangle. In powerful markets, there is no thrust, but instead a prolonged fifth wave. I think we can confidentially say we are in a powerful market right now, so I do expect a long 5th wave to the downside. I think after tomorrow’s tape Berk will be able to suggest some downside targets.
I have nothing to add to Gold tonight, it’s at the lower boundary of the triangle I talked about on Sunday, but as it’s currently moving alongside equities (and alongside crude I might add) tomorrow’s tape in equities will give us clarification as to when we break towards the downside in Gold as well.
As a final comment - crude traded below 59 today and I expect it to find a bottom around 55 as this is dangerously close to most OPEC member’s cost of production. The timing of a bottom in crude might also tie into the completion of intermediate wave (3), as a rise in crude should benefit equities. It’s humorous how this once inverse correlation now has reverted.
I hope that all the above will give you a sound prospective going into tomorrow - behind all the waves and the chaotic moves there is a pattern developing and every day now brings us closer to a resolution. Berk and I will provide regular updates in our intra-day postings, which will include what direction we think is most likely as well as which trades we are taking if any.
May the Trading Gods have mercy on your ass(ets)!
Cheers!
UPDATE: Everyone - I made a correction on the SPX zoom in chart as one comment was misleading. Again, the logic of why I think wave {d} is complete is a bit counter-intuitive but I can best explain it that sentiment was ‘too strongly bearish’ to entertain a down-up move. Either we stay bearish and continue (wave 5 down), or the bearish sentiment was already maxed out and will lead to a counter trend move ({e} up). The idea is that it’s too strong a sentiment to not lead to a fast conclusion out of the chop zone.
Arguably this can be debated to death, but it’s not that big of a deal anyway as most of us are sitting in cash right now waiting for an entry. Tomorrow morning’s or even tonight’s tape should bring swift conclusion.
金币:
奖励:
热心:
注册时间:
2006-7-3

回复 使用道具 举报

 楼主| 发表于 2009-4-1 06:36 | 显示全部楼层
November 11th, 2008 10:17 am Intraday Update 220 Comments

UPDATE 10:12am EST: Nice gap down at the open but as I’m writing this we’re still holding at the 893 retracement level. Yen is a bit overbought, however there’s a chance it’ll do the snake wiggle around the 80% line on my hummingbird stochastic just like yesterday. Here’s a chart with the freshly baked retracement levels for you dirty rats - the faded out lines are the weekly ones.

My Latin phrase of the day: Cogito, ergo sum
UPDATE 12:00pm EST: Not much happening on our end. Berk and I are scalping a few swings with FSLR and BIDU which so far has been working well in terms of reading the swings, but the MMs are being ‘difficult’ at best. Yen is getting closer to being oversold again, so maybe we’ll get some fireworks going into the afternoon.
UPDATE 12:07pm EST: Okay, I just discussed this with Berk - take a look at this correlation chart:

As you can see the market has NOT exploited a drop in the Yen. The stochastics on my favorite currency is pushing towards the oversold condition. So, what do you guys think will happen once the Yen starts swinging to the upside again?
UPDATE 12:46pm EST: Yen is crawling upwards again, but we are not seeing a strong reaction in equities. Besides we are now at the 886 retracement level in the SPX. It is possible that we are looking at a low for the day - not sure yet. But I am distrustful of this tape right now - it feels a bit like a bear trap.
UPDATE 1:03pm EST: I’m so on today - have been reading this market like a book
UPDATE 2:07pm EST: I just grabbed a FSLR put and will cut it if we breach the 8740 pivot on the YM futures (around 903 on the SPX).
UPDATE 2:21pm EST: I just exited FSLR - to add insult to injury I got cheated by the MMs - LOL. Not a biggy - just lost a few bucks and the risk/benefit ratio was acceptable. Anyway, it seems at this point that wave {e} is on its way, unless we see a swing to the downside on the double.
UPDATE 3:13pm EST: It’s actually very important which way we swing at this point. IF we keep going down it is possible that we are tracing out a series of 1,2s and that Minuette wave (iii) of the current higher degree wave is not done yet. This would also mean that the triangle case is weakened and that we might get a very swift wave 3 to the downside. IF we swing to the upside by the close it would give extra credence to the idea that we’re doing the triangle. What’s so interesting about Berk’s wave 5 down scenario (which is the 1,2s down right now) is that it would hurt the most amount of people, as bears have most likely closed out their short positions by now. Here’s a chart - hope all this makes sense:

UPDATE Closing Bell: I’m going to grab lunch now and will follow up with a market update later this evening. I had a long chat with Berk and we think we have a decent idea on what the probabilities are. Hope none of you got whipsawed too much today.
金币:
奖励:
热心:
注册时间:
2006-7-3

回复 使用道具 举报

 楼主| 发表于 2009-4-1 06:37 | 显示全部楼层
November 10th, 2008 9:59 pm Market Forecasts, Trade 54 Comments

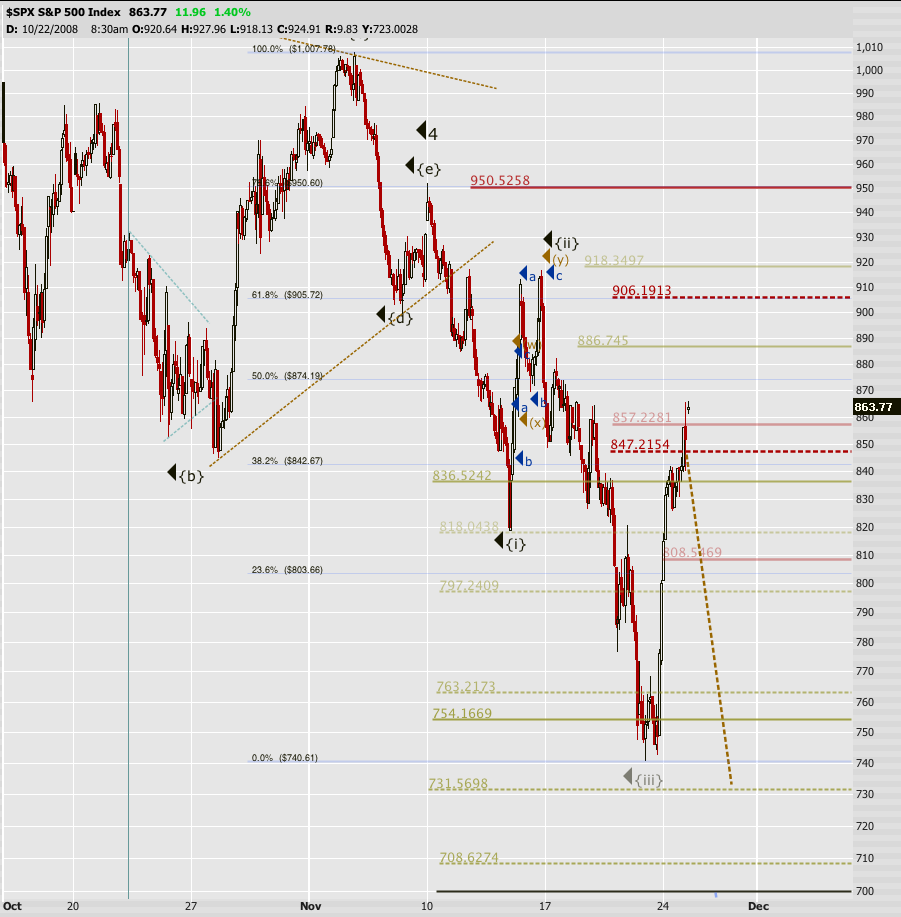
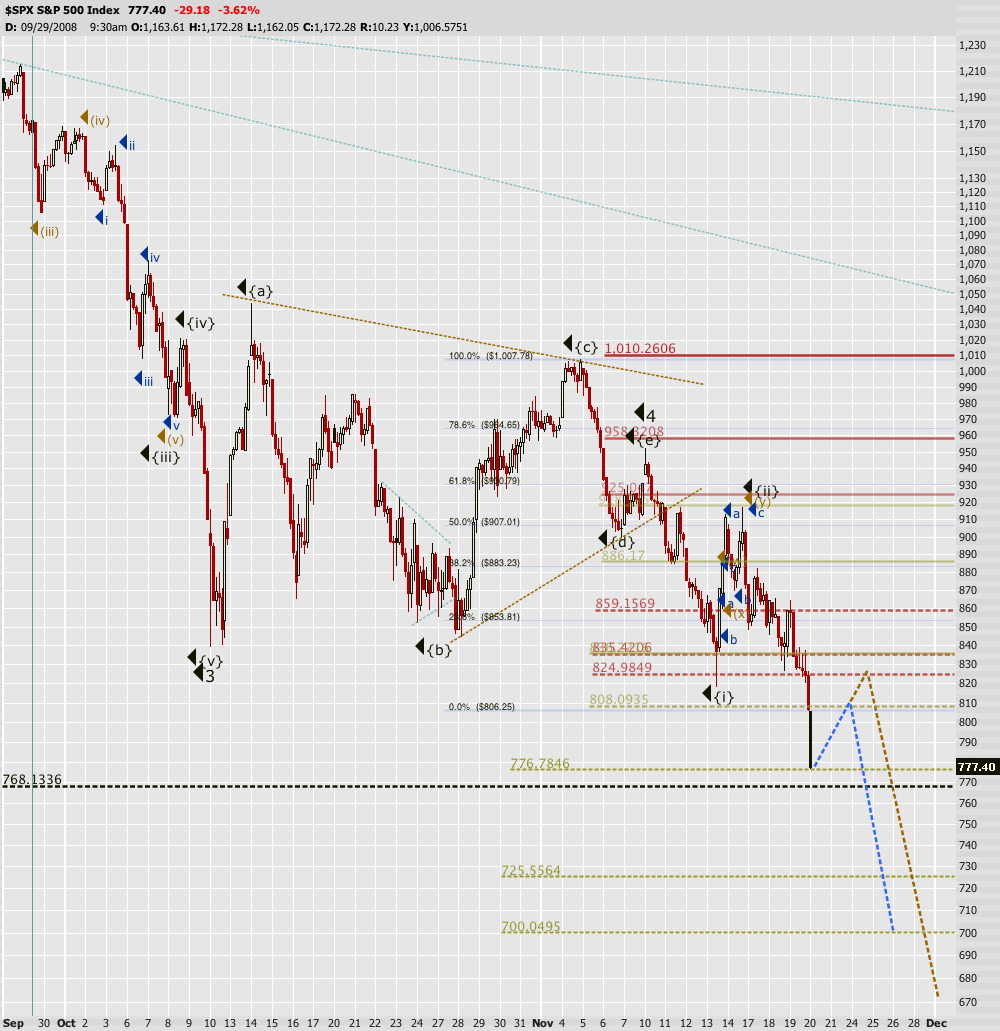
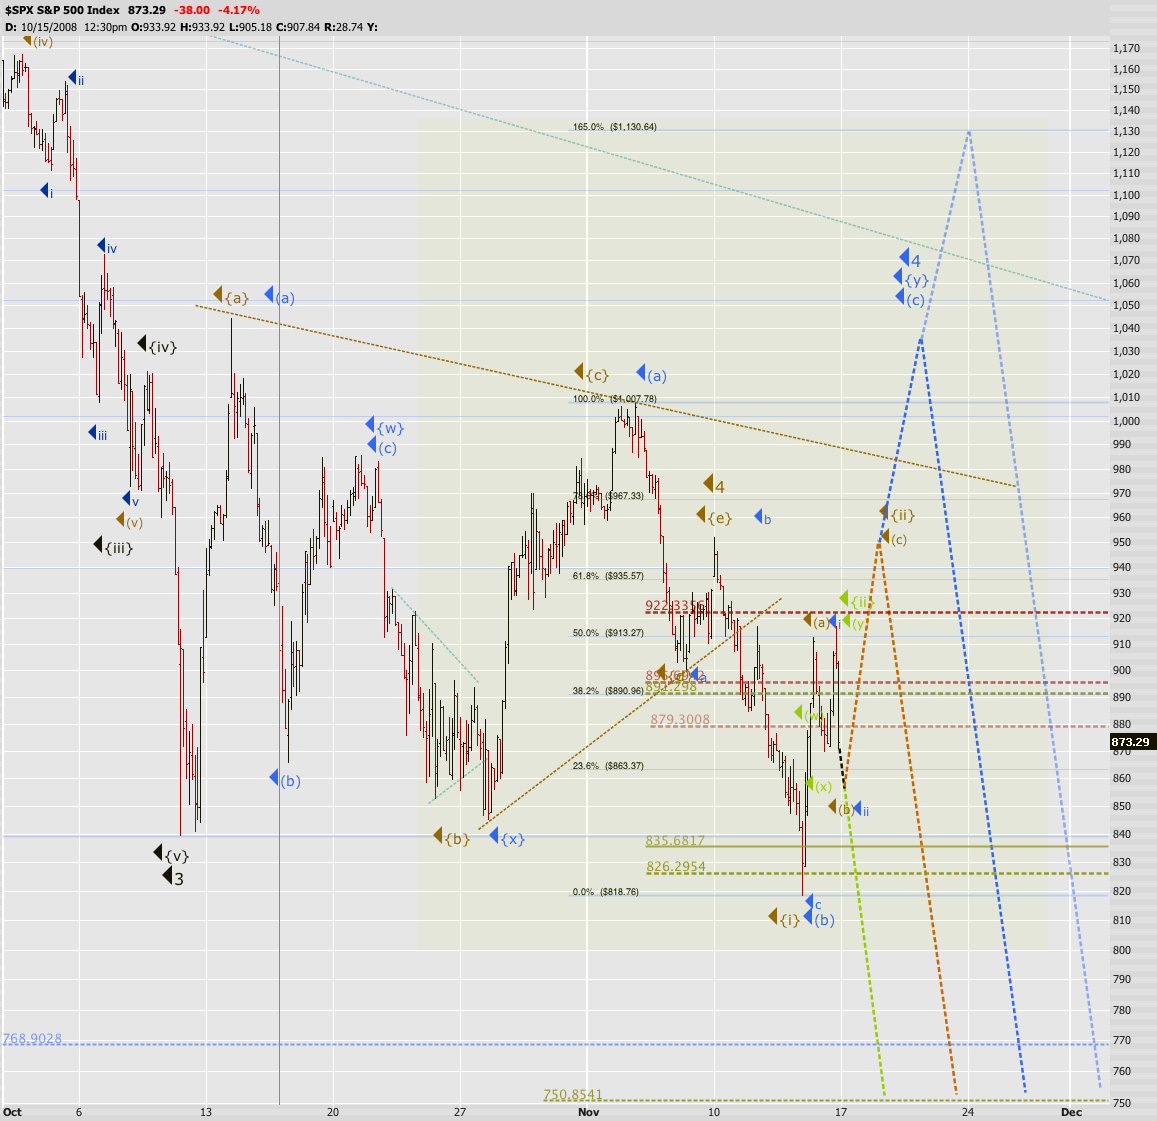
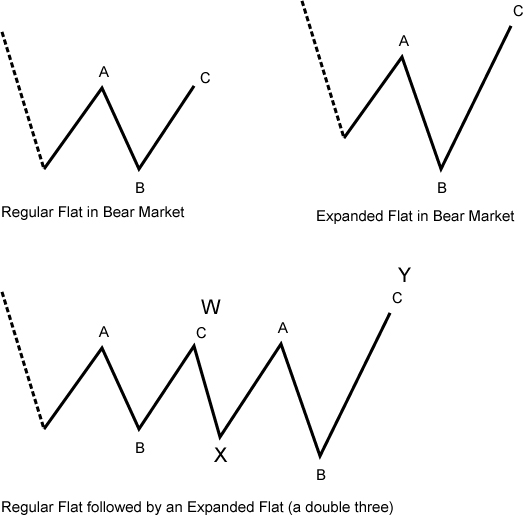
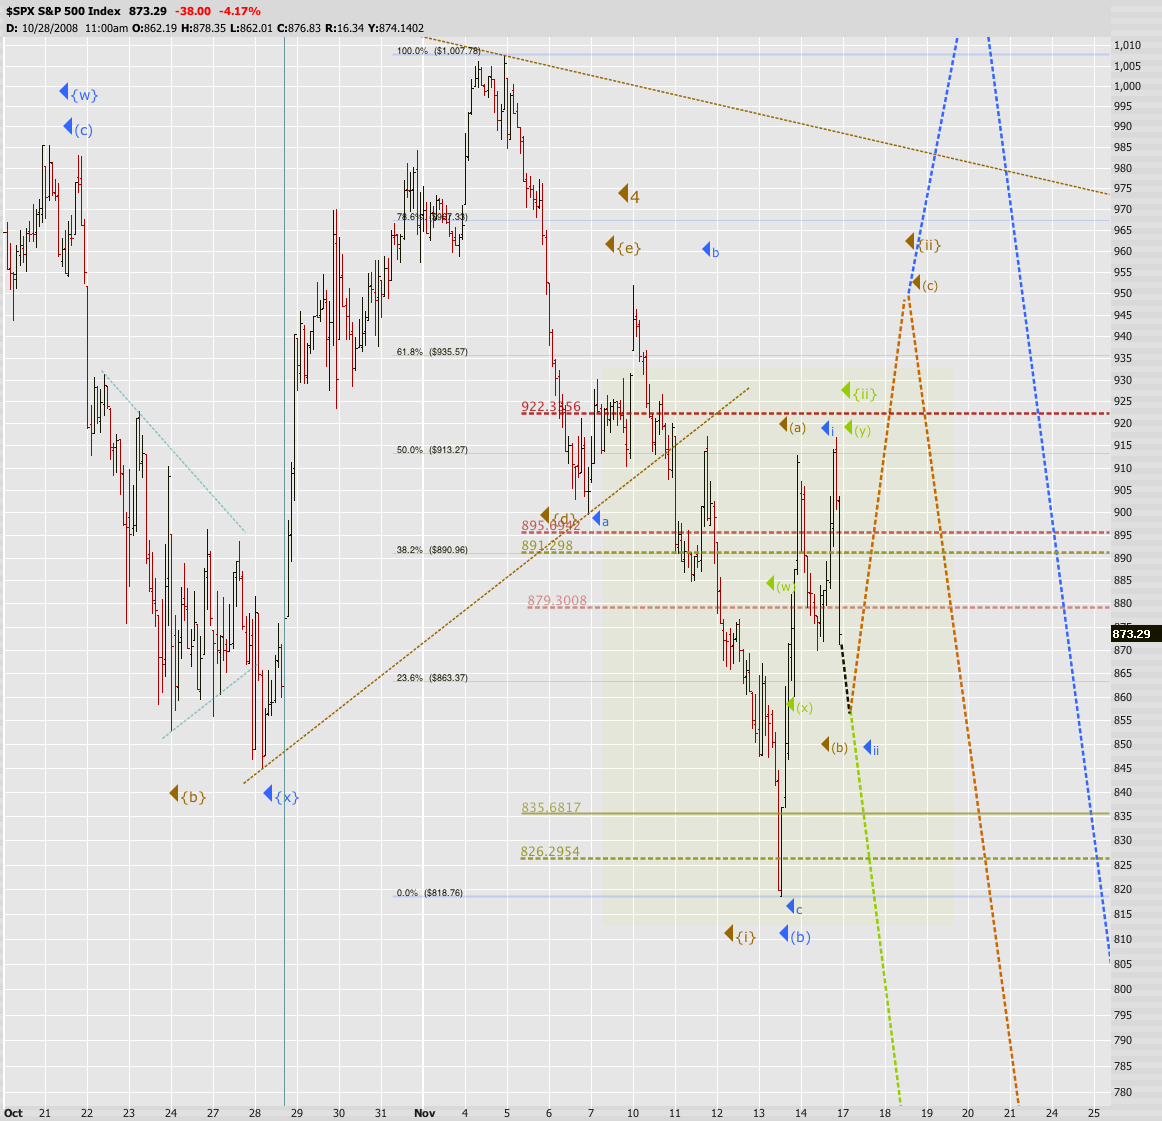
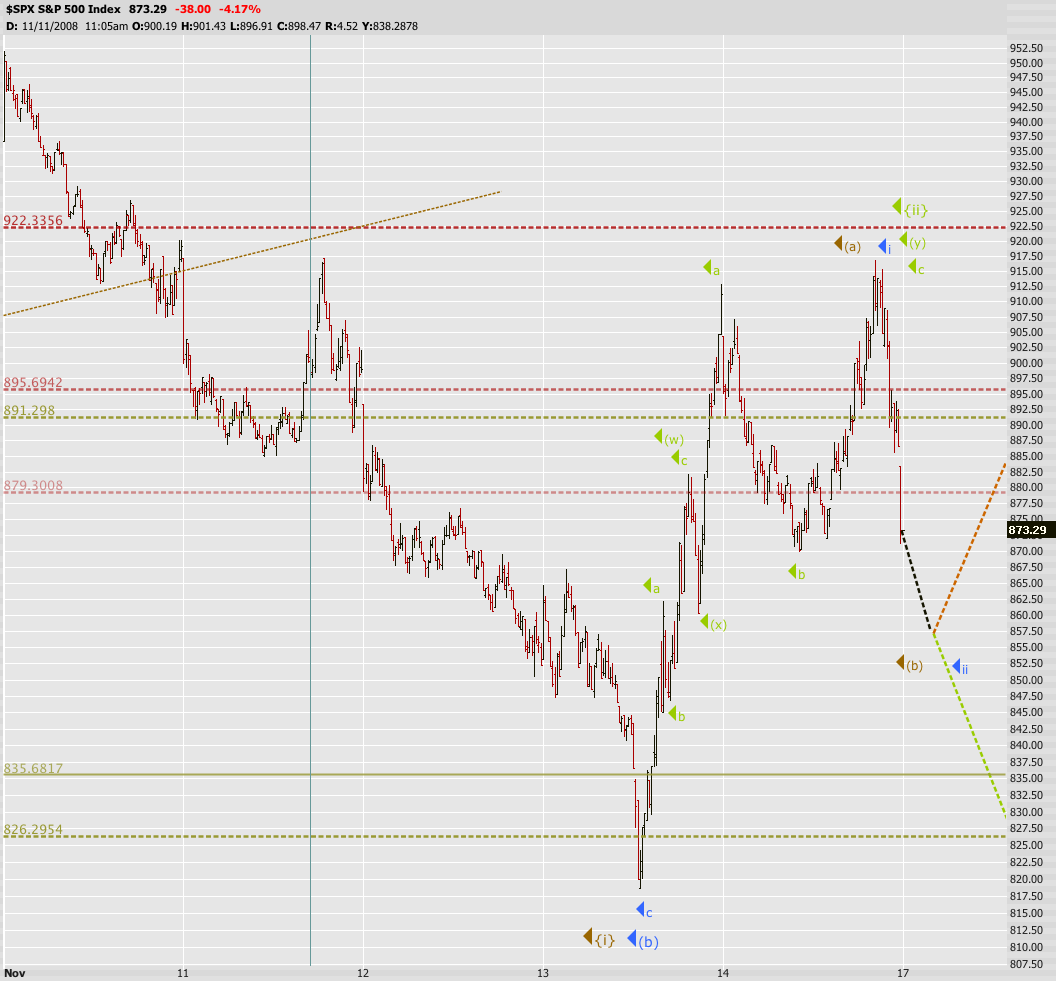
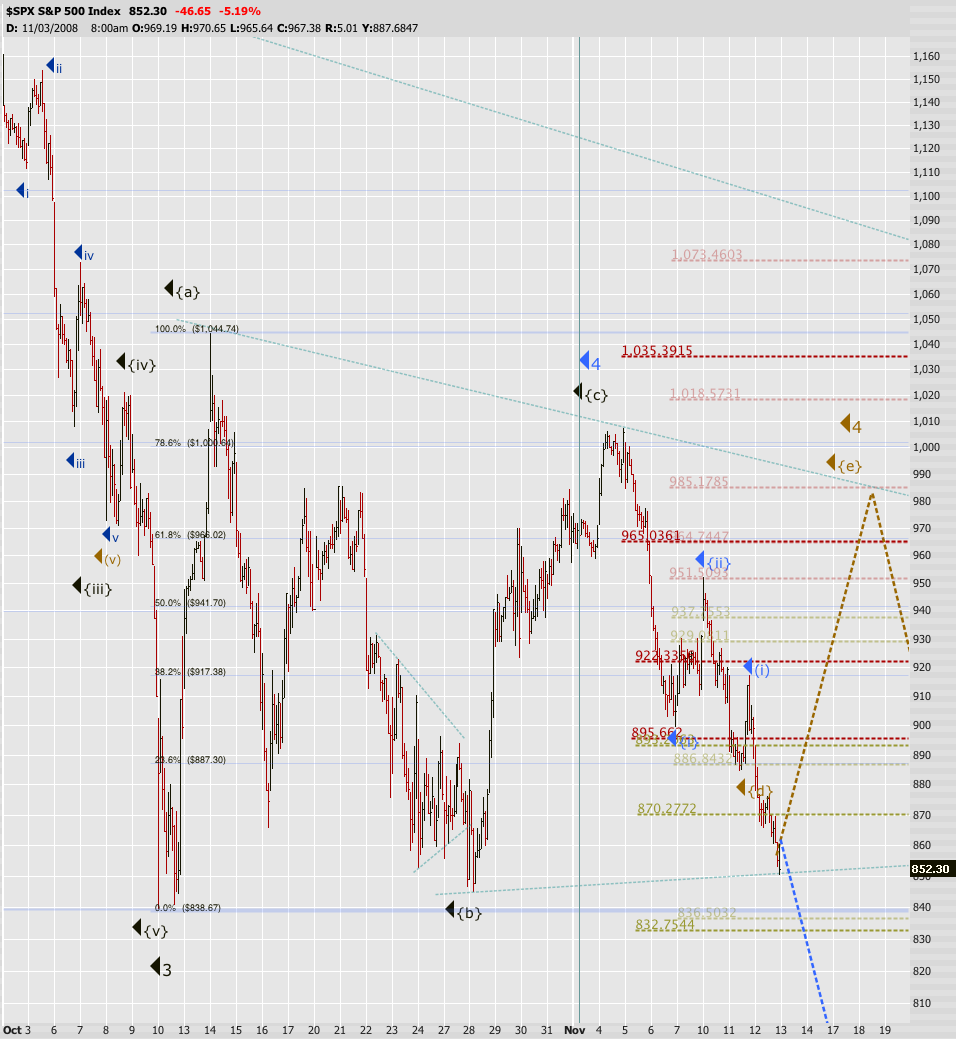
The markets have been kind enough today to leave us in a position where little has changed.  We got a nice morning rally, that quickly reversed into a decent sell-off, followed by our standard end of day rally. The  rally pushed right to the reversal area we expected, and the decline failed to push to a point where we could eliminate one scenario or the other, therefore, they both remain.  I am sure by now, we know my view is still that a flat was completed, and we are  (or will be very soon) heading lower in wave 5.  If this were the case, today’s action likely completed wave [v] of [I] of [3]… of [5] (meaning we rally, then fall, then rally, then fall, then rally on a larger scale (for you non-Elliotticians)).   As stated though, the triangle remains on the table which would also be heading lower after a slight push up.  On the 60d/60min chart, the Bollinger bands are squeezed in nicely.  So we will likely get an explosive (tradeable) move in one direction or another very soon.  There is a nice horizontal resistance in $NDX at 1275 (not shown).
$NDX options

The three reasons I maintain my view for a sharp drop very close to here is:
  • Occam’s razor*.  A flat was traced out with perfection, and the market turned directly from there.  Why would I make this more difficult, it wave 2 was long and choppy?
  • It would screw the most people it we fell directly from here.  All the bears I know are looking for a rally before we drop (or have turned bullish), and all the bulls are, well, bulls.
  • There was only a single divergence on the hourly chart, and no divergence on the daily chart at the previous bottom.  No divergence would suggest it was a wave [3], and the markets were not quite done falling.
That said, I will do a little talk on options.  Since there is nothing I hate more than a boring market, this will do many of us some good.  I can tell you right now, this will not have the glory many of you who knew Jeff Kohler have come to expect when we are talking about the wonders of options.  I am going to talk about MY option trading style.  This is likely going to be different than most people who trade options.  If it makes you money, I don’t care how hokey it is…stick with it.
I am going to assume that we all have a basic understanding of options and option pricing.  And that I don’t need to go into Delta, Theta, Gamma, or any of that good stuff.  In fact, I NEVER look at greeks anymore, but don’t be like me. B-)
There are a few things that I check for when scanning for options.  First, the underlying.  As we know, I am looking for stocks that will move far, fast, and now.  We should all still remember how I come up with those, but I will be using BIDU and FSLR for most of my examples in here.  After I have gauged the underlying and WHERE I would expect a near and mid-term move to take me (i.e. PRICE TARGETS), I can begin to select the proper option.  I know you are thinking… “Pick the right option, from someone who doesn’t use greeks….SURE.”  Nonetheless, in the short time I have been trading options, I have payed VERY close attention to how options are priced… IN REAL TIME.  The black-scholes and all the other theoretical pricing models are great, but that is really too much work, IMHO, when it won’t give you the ACTUAL value should this happen.  If it works for you, GREAT, stick with it, but you don’t need it.  Again, don’t be like me.
From here, I operate on a few assumptions to select my options:
  • The underlying will make the desired move BEFORE expiration.
  • My analysis of the underlying is correct (enough) (i.e. see number 1).
  • Desired move will be explosive, ’cause I want to get that extra Vega kick!
That said, let me walk you through my FSLR purchase this morning.  Knowing my mid-term target is around 95, and my short term target is about 1 ATR ($18), with FSLR trading around 147 (my entry), I am looking for 130 today to take profits.  I try to spend the same amount on every position (except that I have 2 distinct groups stocks I trade and stocks I don’t.  Stocks I trade I am willing to put in about 50% more than stocks I don’t due to familiarity), I selected the Oct 135P.  Almost 3 strikes OTM at the time, I knew should it hit my target, I will be sitting $5 ITM.  IF that move happens before expiration, I will be sitting on $7.5 (price of O135P) + $5 (distance ITM) for a total of $12.5 should we hit 130 today (or in the next day or so).  Since this represents a 60%+ gain, if I hit that today, I will sell, as 60% in one day is good enough for me.  I sold out today with FSLR trading up to 137 after bouncing from 135.  I closed out for $10.30, a 50% gain.
FSLR Entry/Exit

$VIX in respect to FSLR/BIDU entries/exits

Let’s review…  Move was large; 10 points from entry to exit.  Move was explosive; dropping with a major sell off in the markets, letting me cash out with $VIX at 61.  Good enough for me; Making a 50% ROI in 5 hours at the market is good enough for me. (THIS trade is not a recommendation, and is solely for demonstration)
BIDU entry and exit

The other example will be BIDU, of which I entered far too late to get a spectacular return.  Since I “thought” I missed the initial move in BIDU this morning, I waited until it broke a consolidation phase, and looked to be heading lower.  I was looking for 200 (entry at 222.5 - ATR(10) of 22 = 200.5), but sold on a 50% gain with BIDU at 205.  In this trade I grabbed 17.5 points, so the move was large enough.  It fell pretty quickly from my entry, dropping about $8 in the 1/2 hour after my entry.  And I managed to escape with the $VIX pushing highs of the day at that time.  The option I chose for this was the 200, expecting to get right into the 200 range.  I did not make it ITM (target) but when BIDU stalled out around $203, I decided to take my gains and go.  ‘Nuff said!
Since my timeframe is very small (notice the 3 minute charts), I decided to trade front month options (notice that Theta was not an issue on either of these trade (and yes, I know we all can’t day-trade, though if you had bought Friday’s close (at least on BIDU) you would have had an entry very close to mine)).   Since the stocks are very volatile, expecting a 10% swing per day, IMHO, is not unreasonable.  Therefore, depending on stock price, I can choose an option 2-3 strikes out, and still be looking at a VERY good chance of seeing ATM, and likely ITM, at some point that day (again, assuming the trade goes in my favor).  Personally, I would rather trade the OTM/ATM than ITM due to intrinsic risk.  I just don’t like to have that much on the line.  Mr. $VIX is your friend.  He is one of my best friends while trading puts, and I will use every point he gives me to my advantage. Finally, in this market, know when enough is enough.  Returning 50% on a single day’s move is good enough.  Frankly, I would have taken 25% and been quite happy.  If a stock finds resistance right above your “target,” don’t be afraid to take a little off the table (if you just have one contract, forfeit the rest of the move to lock in your profit, or roll into a CHEAPER option).   Notice I sold at or very near the lows of the day on both of the examples, despite “missing” my target.  My target is an area (you will always here me say “target range”) and close counts in option trading.
With that…  Happy trading. I hope you can pick up a thing or two that you can use from that…
Skål!
* Entia non sunt multiplicanda praeter necessitatem. (Latin for ‘Entities should not be multiplied more than necessary’).
金币:
奖励:
热心:
注册时间:
2006-7-3

回复 使用道具 举报

您需要登录后才可以回帖 登录 | 立即注册

本版积分规则

本站声明:MACD仅提供交流平台,请交流人员遵守法律法规。
值班电话:18209240771   微信:35550268

举报|意见反馈|手机版|MACD俱乐部

GMT+8, 2025-7-27 11:53 , Processed in 0.065356 second(s), 9 queries , MemCached On.

Powered by Discuz! X3.4

© 2001-2017 Comsenz Inc.

快速回复 返回顶部 返回列表