- 金币:
-
- 奖励:
-
- 热心:
-
- 注册时间:
- 2006-7-3
|
|

楼主 |
发表于 2009-3-31 11:36
|
显示全部楼层
January 9th, 2009 10:42 am Market Forecasts 155 Comments
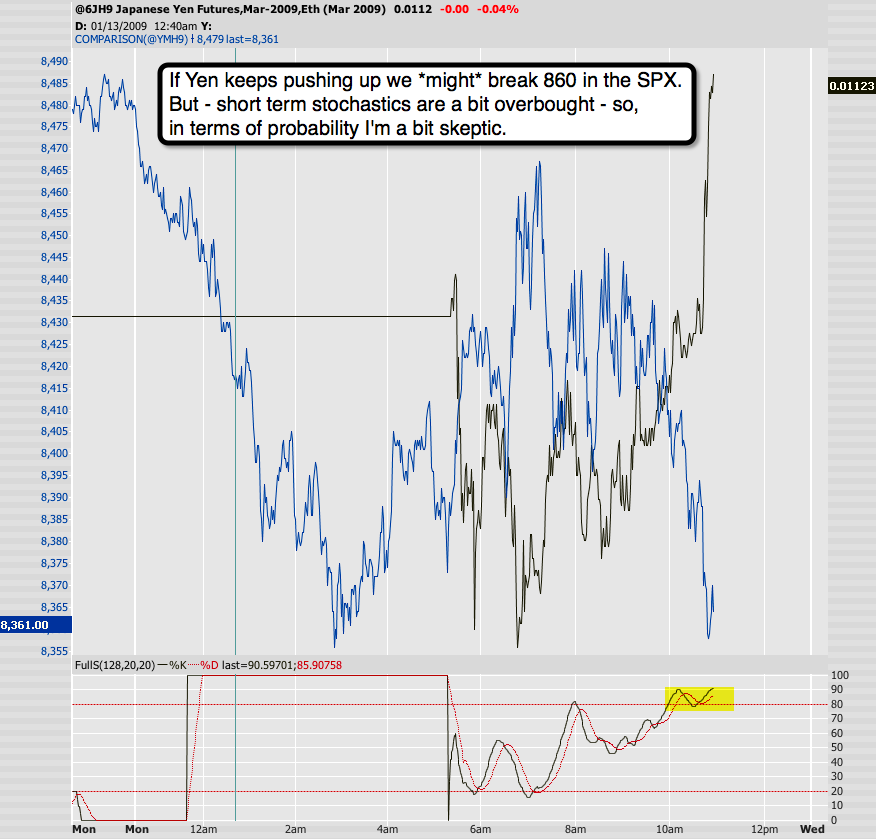
UPDATE 10:35am EST: Wow, that was a nice ride down. The Yen is on fire right now but I expect a re-test of the 1.106 R2 pivot. I think we’ll chop around here for a little before any large reversals (or drops). We have moved quite a bit this morning. Interestingly the NTX has stayed right at the open and the VIX has barely moved. I’m not quite sure what’s going on there just yet. Got to think about this.
UPDATE 11:08am EST: Well, it’s not for a lack of trying but equities are not getting out of the gate this morning. We’re back to chop chop chop - hopefully until we drop. I’m just sitting and watching right now as I was actually hoping for a rally so I can sell the rip.
UPDATE 12:33pm EST: I got kicked out of 2 sell ETAs now and will probably wait for a VTA before I grab another contract. I know it’s frustrating sometimes but we’ve seen this before. You try your luck during the chop and then give up - and it’s right then when the market decides to drive up like nuts. Patience and perserverance (and perspiration) is key.
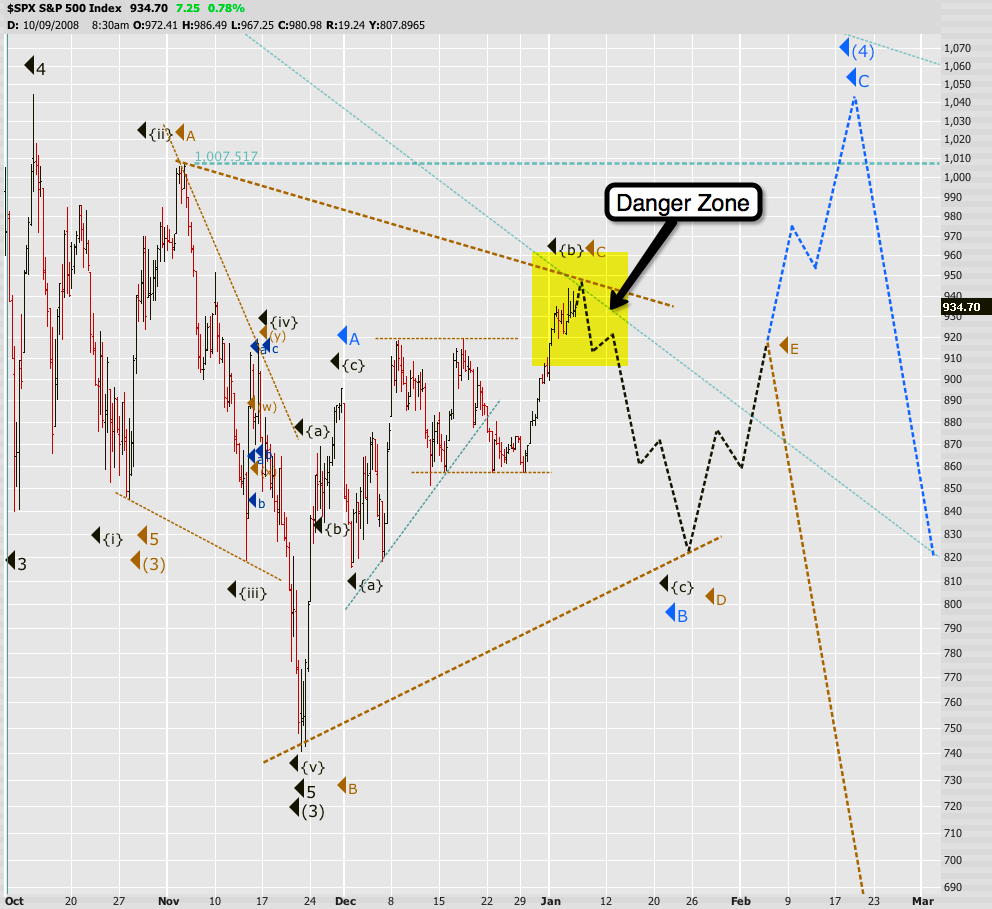
UPDATE 12:41pm EST: Let’s take a quick step backwards. The way it’s looking the bulls might muster a little rally by the end of today, but frankly I’m more concerned about the bigger picture.

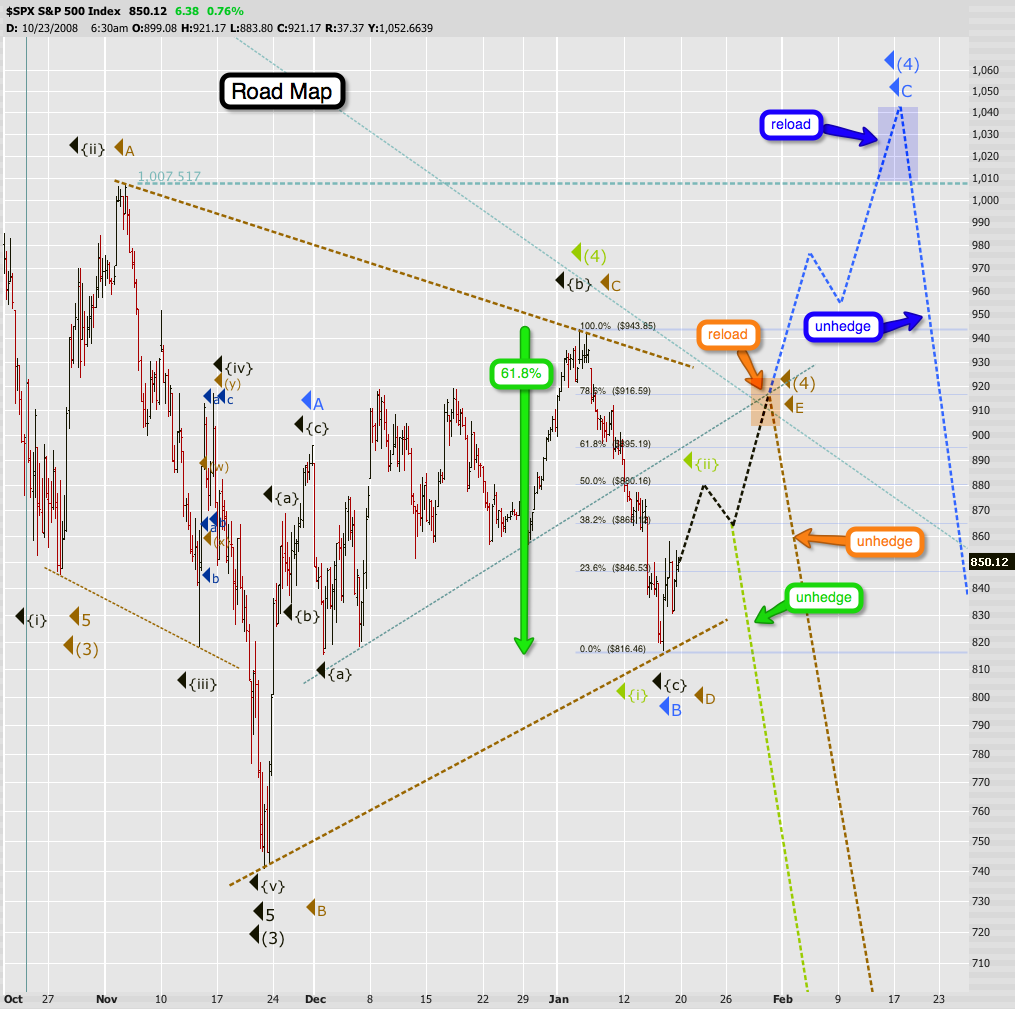
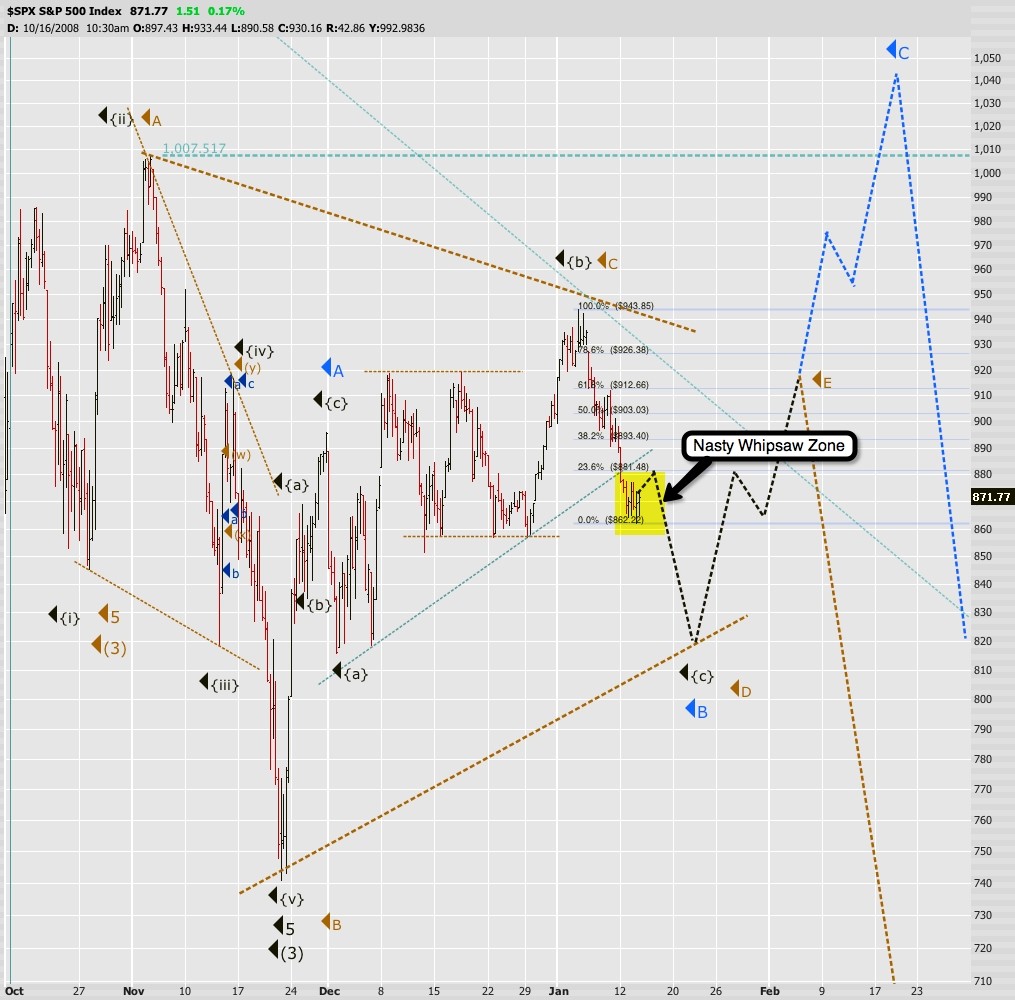
There you have it - the magic number is about 880 on the SPX, which is also a retracement level (879 to be exact). That sucker will be tough and it might take us some more ‘good news’ to breach it 
UPDATE 1:11pm EST: You can add a VTA to those two failed ETAs. It’s easy to get frustrated and not take the next one but you know what usually happens then. Those whipsaw markets are not fun. Trick is to exhale and look forward - as long as you stick with your system you didn’t do anything wrong. You can get a bit more conservative but even that bites you in the butt sometimes. Consistency is key - I’ll keep taking the signals as they present themselves.
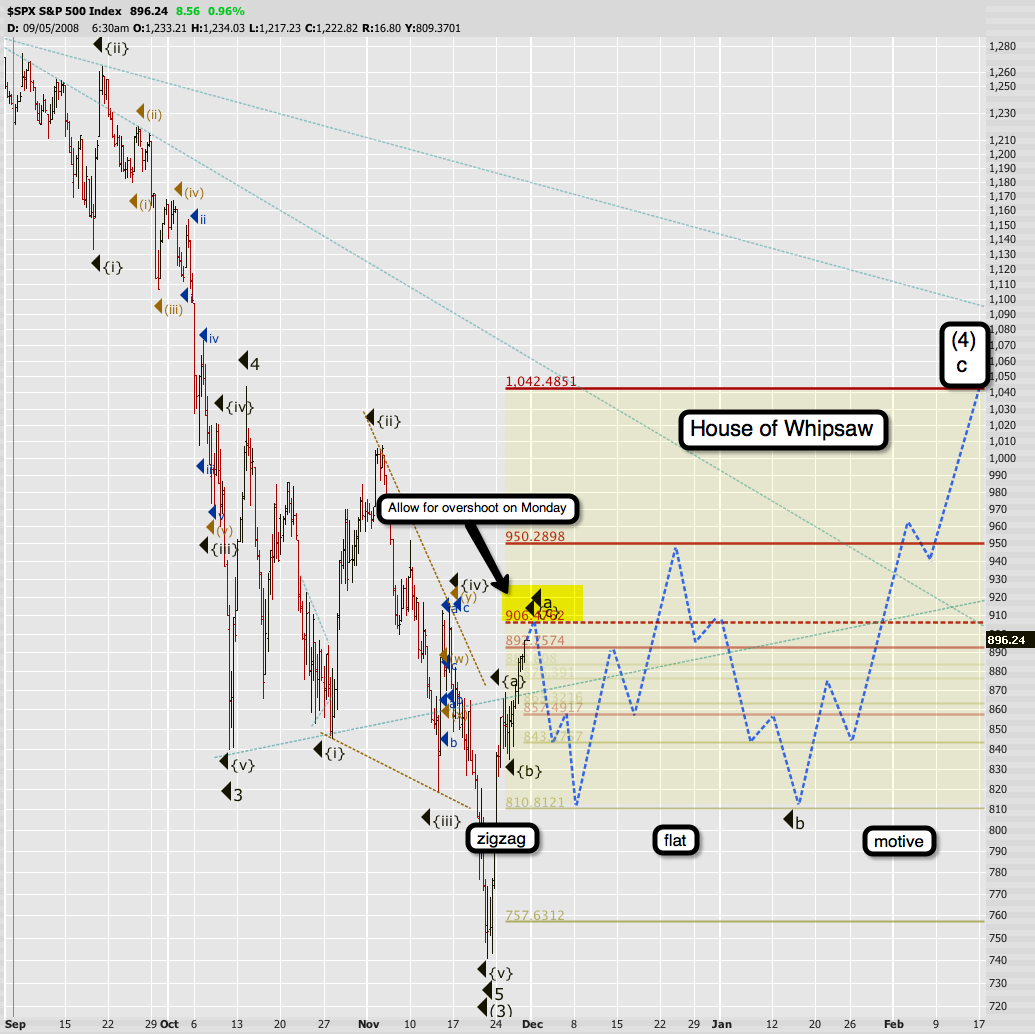
UPDATE 2:55pm EST: Frankly, I can’t wait for the closing bell at this point. It’s been one horridly choppy day with an obvious trend to the upside. Painful to watch and not fun to trade. After 98 tries we finally made it through that 898 pivot - let’s see if it holds.
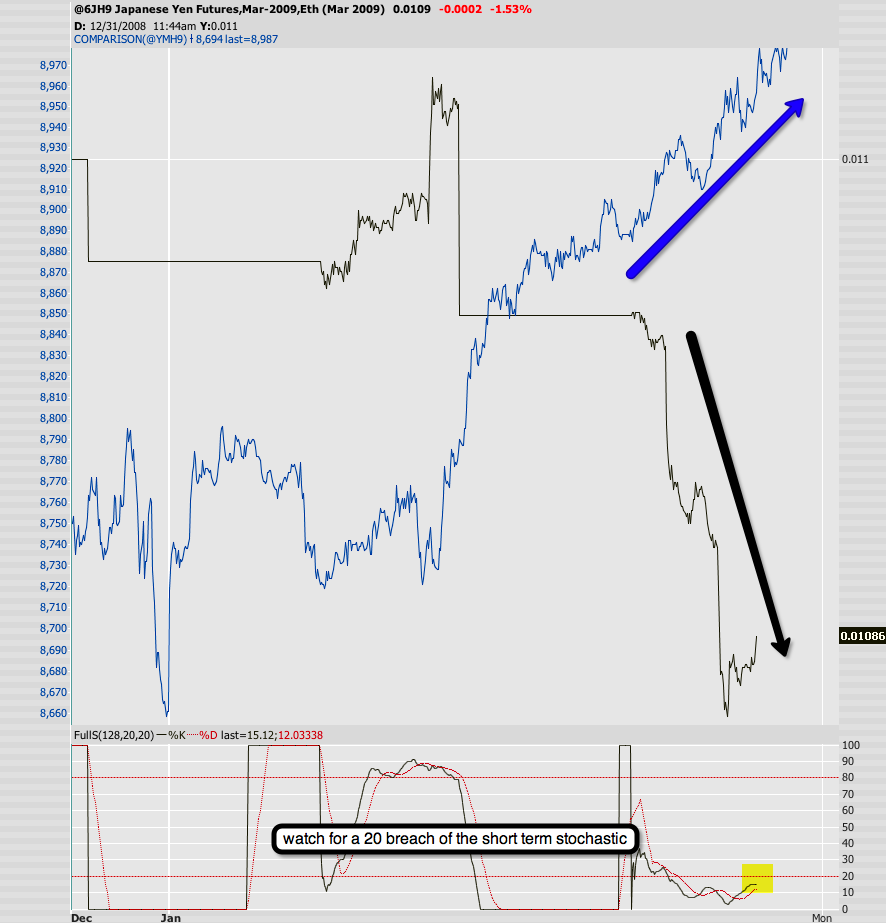
UPDATE 3:53pm EST: That’s right - SELL SELL SELL mofos!! Today was a pain but this sell of is a bit of a take back. Loving it. The Yen is on fire now and might just breach its high - it’s been above its VWAP for about an hour - a good sign for a late day sell off.
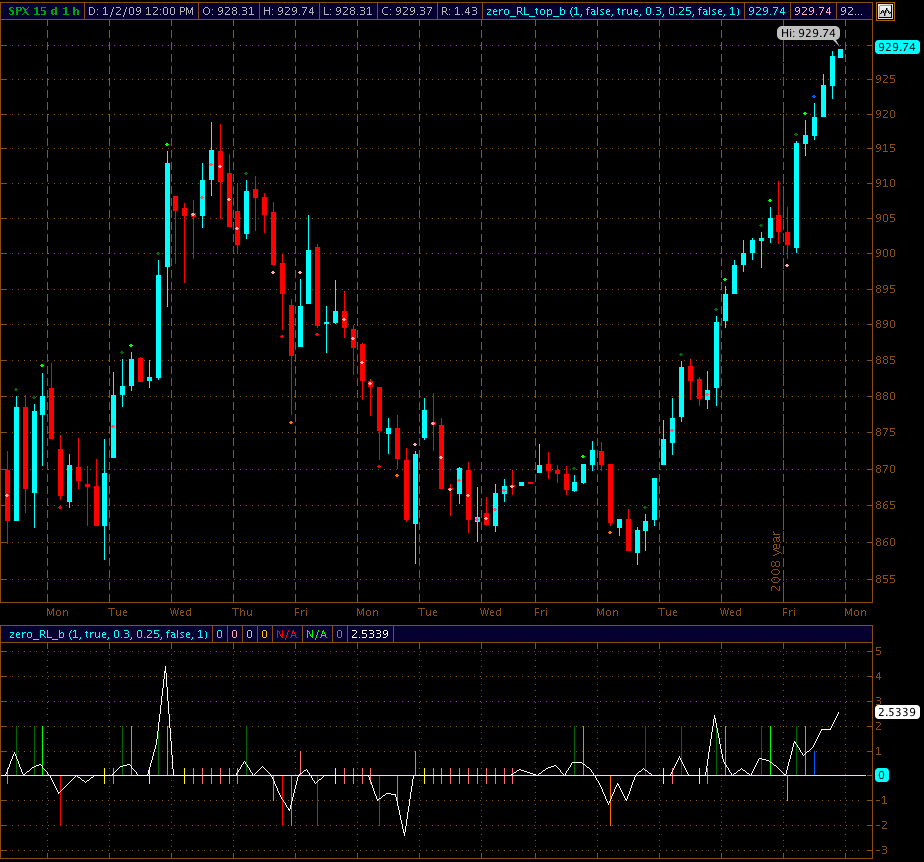
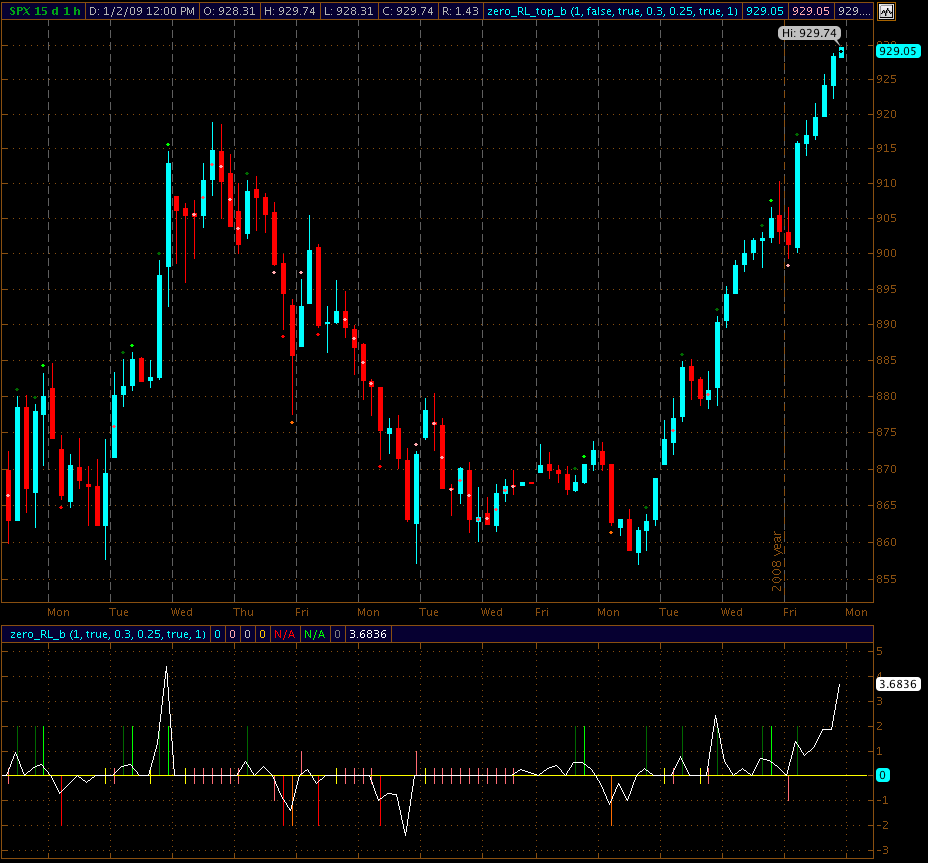
$SPX - 911January 8th, 2009 10:14 pm Market Forecasts, Update 75 Comments
It was an interesting 2 days, and not just because yesterday was my 25th B-Day. I was treated with a nice decline with good volume, but only modest breadth. Today there was some morning followthrough, but the afternoon faded back with it’s standard rally.
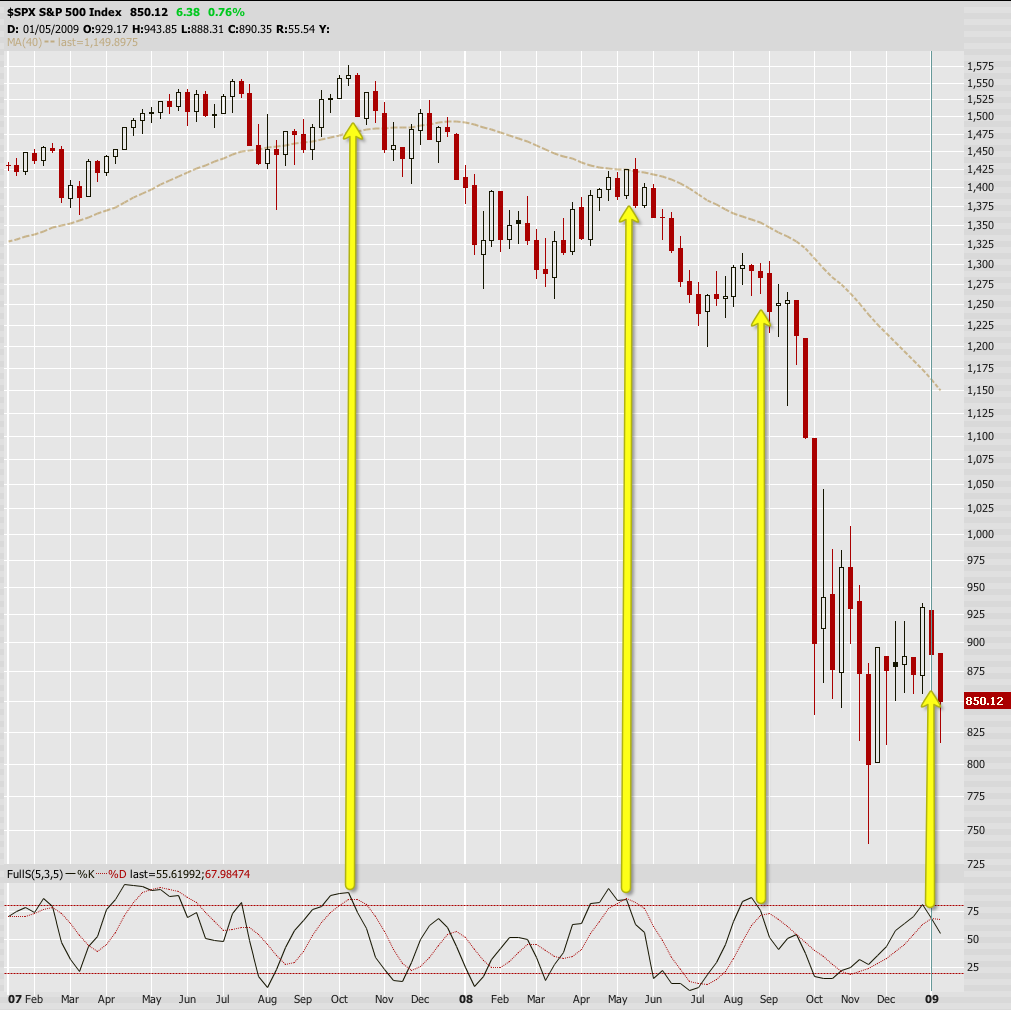
On to the charts… The $SPX has been chilling around 911 for the past few months, and we can add two more hourly closes to that support line, and now we remain below it. What is GREAT to me (beside the $VIX, I’ll get to that) is the MACD. Standard settings show a NEGATIVE MACD histogram value at the last high (either the spike, or the lower high). That is a sign that bullish momentum is dying off.

Here is the 2 hour line chart of the $NDX. Notice that all of this action has done nothing more than retested the previously broken trendline. Granted, it is at higher levels, but the rally has yet to regain the explosive upside momentum of the early stages. 1244 is acting like 911 on the $SPX, but notice the higher beta $NDX is above this line. This ($NDX strength) is to be expected in the beginning phases of a bear decline, and we will likely see a deep retracement in this index.

On the hourly, it is also sporting the similarly massive MACD divergence, as well as the negative delta on the histogram. I couldn’t get a capture because prophet wouldn’t hold the value once the cursor left the “active” part of the screen… Oh, well, I assume you get the picture.

What is more intriguing however, is the double sided gap. There is a bullish gap (likely an exhaustion gap) open between 1262.52 and 1265.54. On the other hand, the bearish move yesterday gapped below this gap (only strengthening the importance of this level), creating a gap that is still open to 1274.49, hence the speculative deep retracement.
At this point it is possible that we would get another high, more likely in the $NDX, but we will take that as it comes.
On to the $VIX. When I finally got my ToS account fixed last year, I hadn’t copied over my $VIX chart from that prophet set-up, but it was exciting doing it earlier this week. Aside from being below 40, which in current market conditions was perceived as a buy signal to me, the $VIX bounce right from previous spike resistances.

What this means to me is that if we were gonna break it, it would have been done there. Notice the previous spike were to the upside, bearish reversals, and are a very precise moment (don’t we know it!!). However, when complacency sets in, we see more of a rounded effect because we are taking longer to play out. Unfortunately, I didn’t get my $VIX sell signal, but I think I can live without it.
Hopefully those of you who missed ICE are watching it set-up nicely for re-entry. I was also tipped off by DMS of some nice looking short plays. PCP is a nice triangle, stretched to the breaking point. Yes, it has throw-over, so you non-Elliotticians may be a little confused. If that is the case, accept that it is also a BB reversal.


COL is another representative, also stretched to the 2.0BB point of breaking. As soon as that channel goes, it will be a nice short.

There are a few more that I am watching, but at the moment, I am waiting to make sure, beyond all of my doubts, that we are going lower. When I know, or even am more sure, I will tip my hand. Until then, make sure you know what you are holding.
That is it for tonight. I am moving the short term trend to up-down, expecting topping tomorrow or Monday. Medium trend will be the same up-down, leaning on the evidence that this sideways wave 4 chop is finally complete (or at least VERY near so). Long term trend can remain down, unless we make a new high, IMO, until we are making new lows.
Skål! |
|
|
 [复制链接]