- 金币:
-
- 奖励:
-
- 热心:
-
- 注册时间:
- 2006-7-3
|
|

楼主 |
发表于 2009-3-30 07:47
|
显示全部楼层
January 30th, 2009 10:10 am Market Forecasts 124 Comments
UPDATE 10:05am EST: So, we got our obligatory fake-the-open whip after which we dropped nicely. Last night I did the right thing by actually simulating taking an earlier ETA yesterday afternoon as the tape touched 846. However, when whipped up I was hit by a surge of recency bias and cut one contract - I could be sitting on double profits now. No excuses - I’m pretty steamed - if you think I’m tough on you guys - I’m a lot tougher on myself.
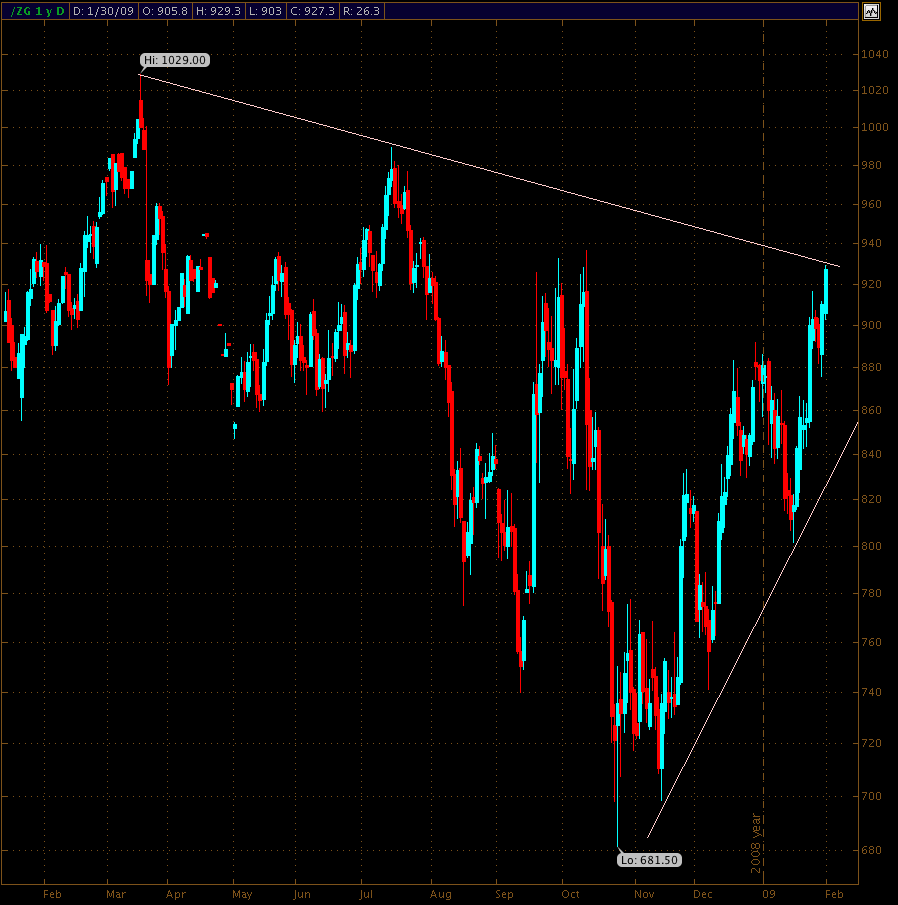
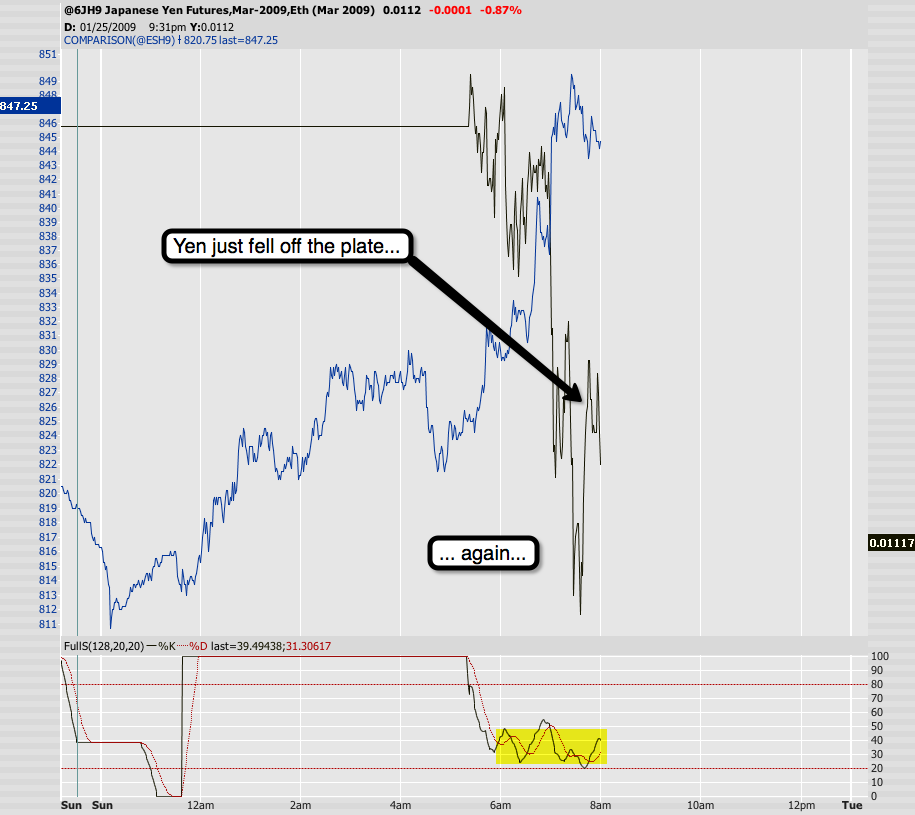
Anyway, take a look at this:

You know that Yen/ES correlation chart by now. Is this another bear trap or a sign of major weakness. The Yen has been dropping along with the ES futures - bad sign for equities. Are we lured into a trap or into the elevator to riches?
Cake or Death?
UPDATE 10:20am EST: Recently I keep seeing comments along the lines of ‘Mole - you are a rock star’ or ‘Mole - you rule!’, etc… Now don’t get me wrong - I’m respond to praise as well as the next guy - but I also have been influenced by Zen teachings long enough to realize that such praise will only serve to built my ego and in the end might become the source of hubris, arrogance and finally my demise.
Let me be very clear about something: Since I was a kid I despised gurus and the core of my existence is based around a secular mindset and the idea that each human being has great potential that can be fostered and thus led to excellence. In other (non fancy) words - if you really want something badly enough you will succeed - as long as you know that there are many sacrifices on the way. I don’t believe that any other human being is less special or less deserving than I am - or you rats!
My intention here is not to accumulate a bunch of trading disciples - if you want that kind of thing - well - there are a few blogs I can direct you to. My goal - no my mission - is to produce a community of highly knowledgeable and profitable traders in order to give non professional traders (i.e. the ‘rats’ analogy) a chance to succeed in this crazy market. Did you know that 9 out of 10 people who try their luck at trading lose their capital and give up within the first year? Those are some sobering statistics, n’est-ce pas? Pair that with a deflationary low interest environment in which many casual investors are forced to try their luck at trading, in this market, and you can take the aphorism of ‘taking candy from a baby’ to a whole new level.
Only by banding together we can succeed in our battle against the Wall Street illuminati. Those guys get all the breaks (obviously) and they know all the tricks - plus they have the power to shift markets their way - the past month is a tribute to that. We have to all be smarter, more nimble, and simply better than they are. I know those are some lofty goals, but if we work together we can become a force that is larger than the sum of its parts. Think about that please - because this is what EvilSpeculator is all about.
Now, cake or death? 
UPDATE 11:01am EST: Symbols people symbols!!! What are you trading? Chop chop! BTW, I did get a good fill on NVDA this morning - it’s rolling nicely right now.
UPDATE 11:13m EST: Yen just pushed above its VWAP and is just pushing above the 25 line on my short term stochastic (see 1st chart above). It however bounced off the R2 pivot once more - if we see it push above the 1.1154 level we might see some fireworks today.
BTW, I see only 36 votes on the latest poll and majority picked the joke response. Seriously - has everyone given up on the Zero or what’s going on?
Calculitious!January 29th, 2009 6:25 pm Market Forecasts 119 Comments
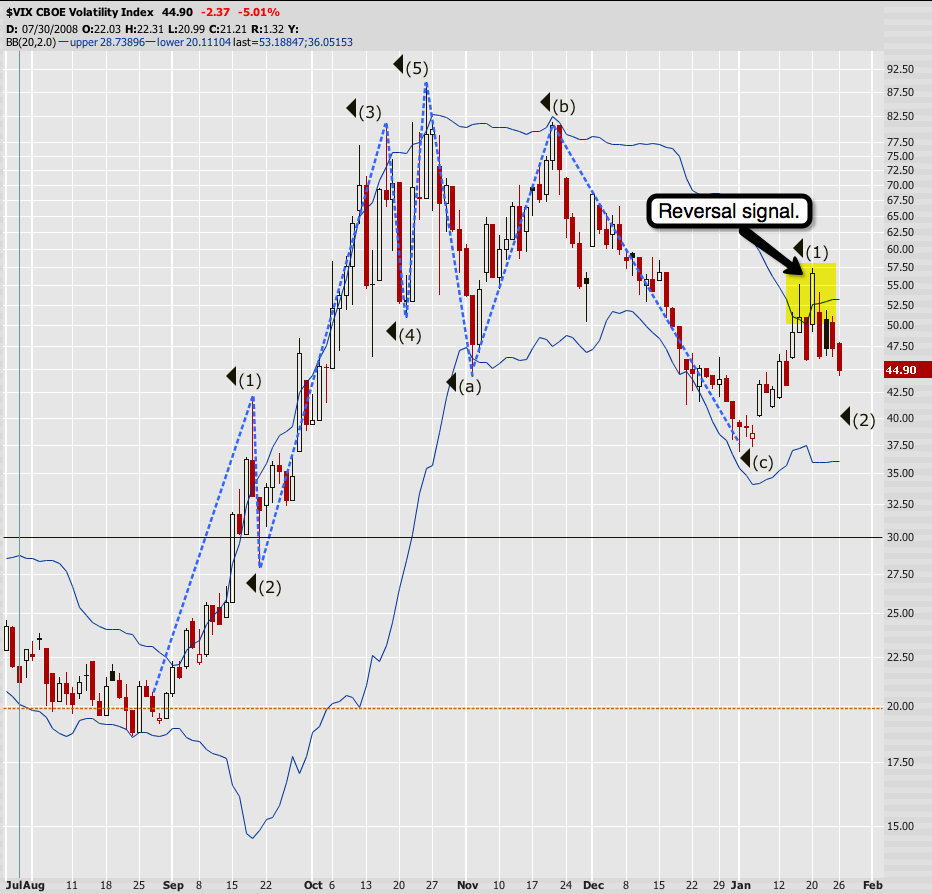
You guys held up well without me today and I think it’s time for a little reward. I already mentioned that I was doing a lot of trend trading before this market turned so volatile. FYI - as you might imagine trend trading becomes a lot more difficult when implied volatility is on the rise:

But when I was still chasing long term discretionary trend trades I also became a big fan of pyramiding. No - we’re not talking about a pyramid (ponzi) scheme a la Madoff - I’ll teach you that one later 
What I’m talking about is a popular technique of stacking additional units (i.e. positions) on top of your first one as the trade goes in your favor, therefore confirming the trend. The way to do that is to decide on some kind of price interval at which you add to your additional ‘units’. The turtles used a 10-day ATR (average true range), which is an expression of how much a stock moves on average within a 10 day range. That number becomes ‘N’ - the number you multiply by whatever risk ratio you prefer. Pick something else if you like but ATR has treated me very well in the past.
Depending who you asked the turtles used either 1N or 2N as their stop - there’s also talk that they used 1/2N on the first day and then bumped it up to 1N or 2N but I tried that and it got me kicked out of trades very quickly.

The best way to explain this and really understand it is to look at an example. For instance, I grabbed AAPL before the close at a spot which I think might lead to some downside - tomorrow’s tape will show me whether or not I should have my head examined.
The first thing I look at is the 10-day ATR, which in this case is 3.7. However, I screwed up here and actually picked the 20-day ATR, which is 4.3 - so sue me! Now what I have to decide on are my stop and the pyramid interval. Usually I use a 2N stop but since there is a resistance line I decided to use a 1N stop. My plan is to add 2 additional units at a 1N interval if the trade goes my way.
The calculation for all this is on the chart - I set an alert (i.e. mental stop) in TOS at 94.95, which is 4.3 points away from my entry (1N). If that gets hit I will cut my position. I also set an alert at 88.5, which is where I would add my 2nd unit - probably the same strike, as I want the first one to pay for the second one. Ahaaaa - I think some of you just had an epiphany! Finally, the new unit also needs a (mental) stop, and based on your trading system you either set the stop for all your units to the next stop point at 92.8, or you leave your original stop for the first unit in place and also set one for your 2nd unit. The impact of that is a different discussion and I don’t want to confuse you today. Same game for the third one - if 84.3 gets hit we add one more unit and also set one more stop at 88.5
Now, the idea here obviously is to ride a trend as it unfolds - the further it goes your way the more you add and if you are lucky you sit on three or four units as the underlying stock keeps moving your way. The maximum for me has been 5 units and only when the trend was unidirectional, fast, and clear. The result - less initial risk and compounding profits!
The problem here of course is that all this math makes your head spin and it’s almost impossible to do this while you’re trading. And even if you do it for the first unit you probably forgot your settings once the next unit comes knocking at your door. Heck, even writing this little intro was a piece of work!
But have no fear - evil Mole to rescue! Sometime last year I got sick of doing this by hand over and over again - although I’m actually pretty good in math - but I’m also equally lazy. So, I sat down and wrote a simple browser based JavaScript utility that does it all for me in an instant:

All you do is to first select your stop and pyramid setting in the drop downs. Then you type in a symbol - it won’t go online and get the data - LOL - not that sophisticated. It’s so you know what the numbers belong to. then you select whether it’s a short or long trade - that’s important as it reverses the direction. Finally you type in the current ask price and the ATR. The rest is all done for you and all that’s left is to set your alerts (or stop orders if you like) in your trading platform. I usually only set one unit alert and the stop at first - after all you don’t know if the trade will go your way. Then you set the next alert when another unit is due.
The final task is to use jing or your favorite screen grabber to take an image of your trade setup and store it somewhere. I actually post it on a private blobspot site, which is password protected. So, when my alert hits I add my unit, then look up AAPL in my blog and set the next unit plus the stop alert based on the image. You ‘could’ recalculate it of course but that’s too much work and you never get the perfect entry anyway.
So, where can you find this coveted NCalc utility for which many traders would give their firstborn just to bask in its glory? Well, right here:
That’s it - it’s free to use for all you leeches - so you might want to bookmark that sucker. Remember that you don’t have to be a trend trader to leverage this tool. Just calculating your stop usually is enough of a pain, so this will do it for you. But it’s also a good tool for your own trading blog as you basically ‘commit’ to your trade when you place it. From then on it’s all in black & white and there’s no changing plans afterward.
One more tip - make sure you reload the page once a day as the date does not change automatically. The time however changes, so not only do you have a track record of your trade, you also know what date and time you placed it. Perfect for your trading journal/blog.
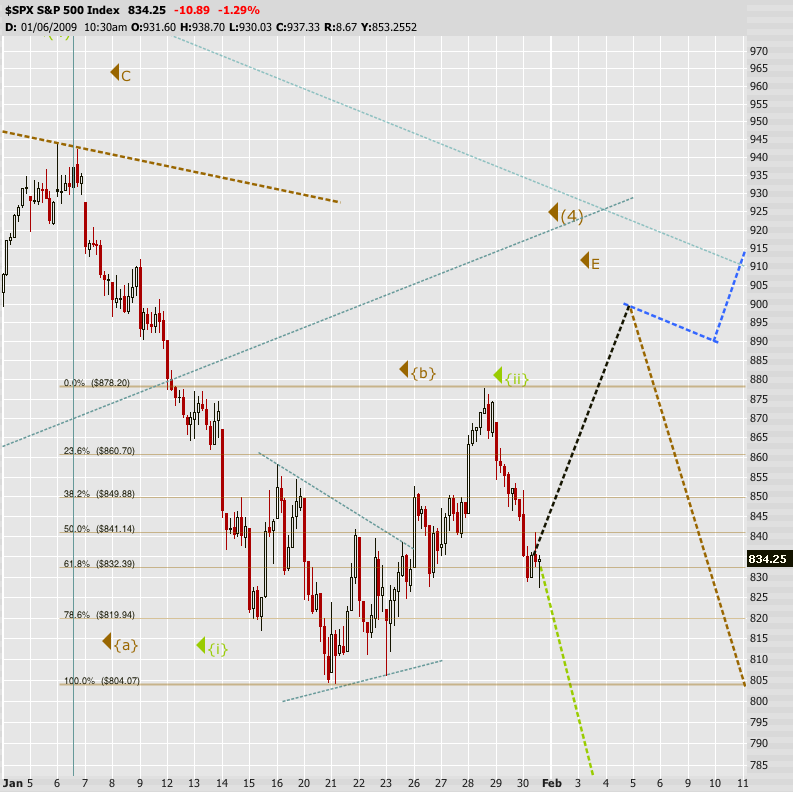
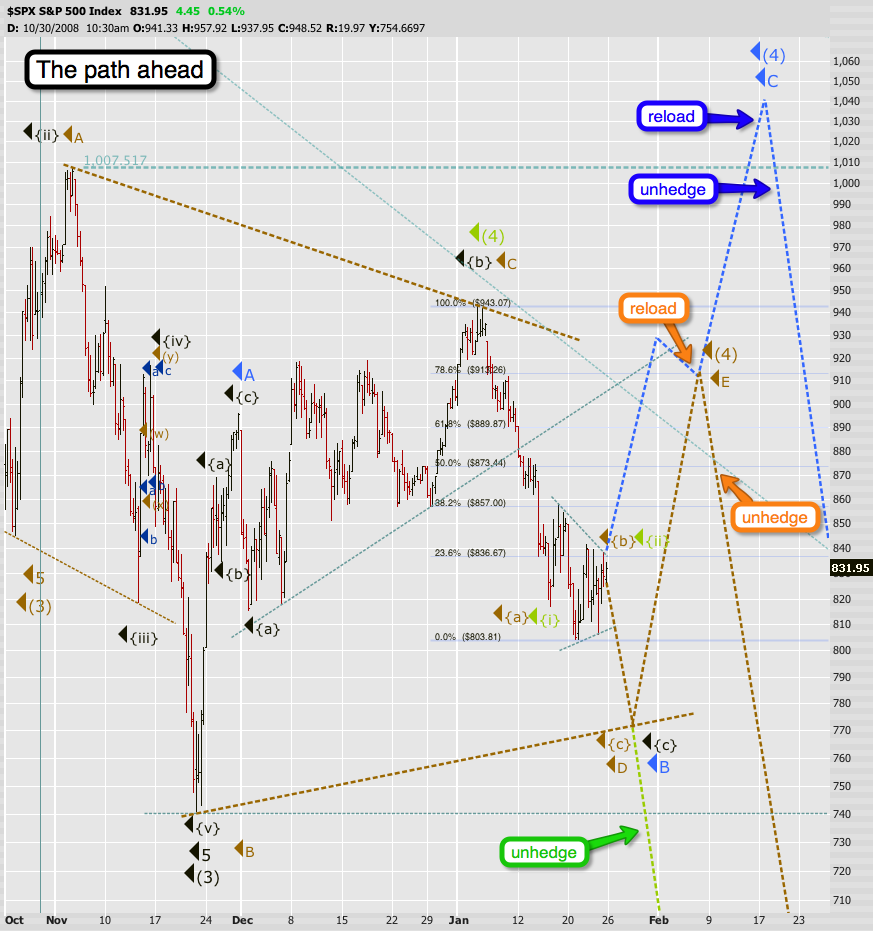
Before I let you go, let’s do a quick review of today’s tape: The chart is a bit messy but don’t let that intimidate you - I’ll explain.
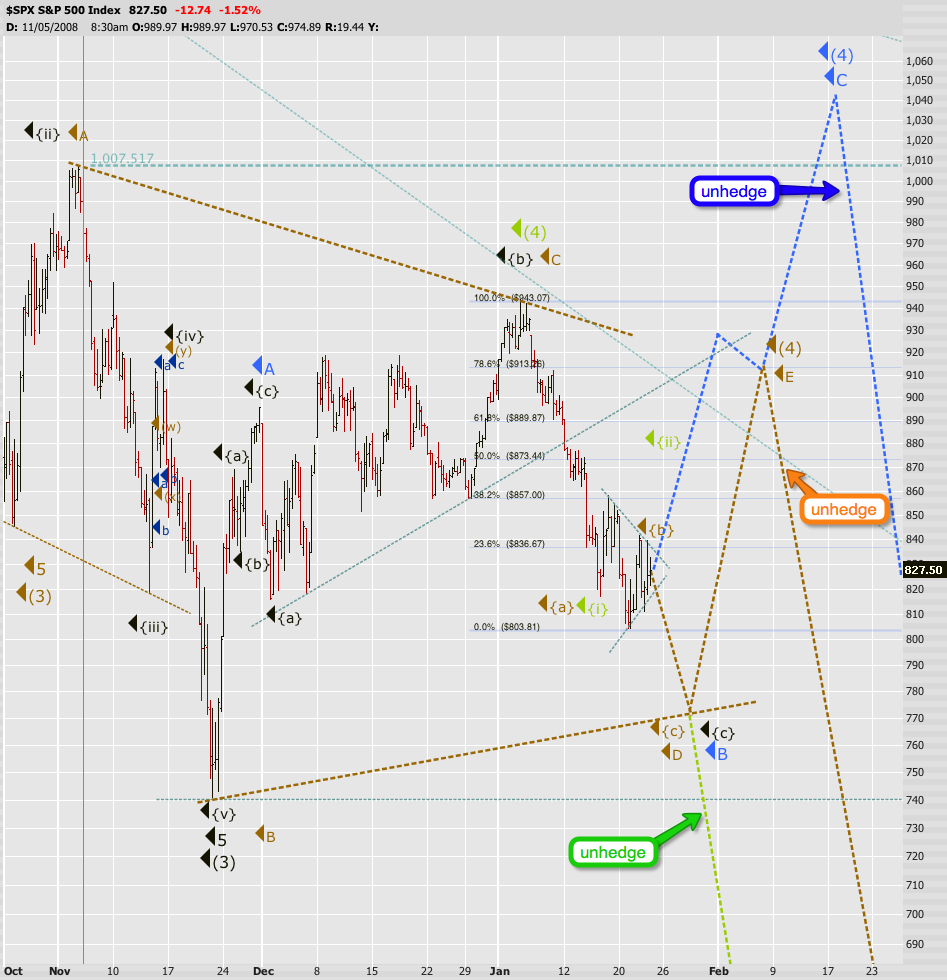
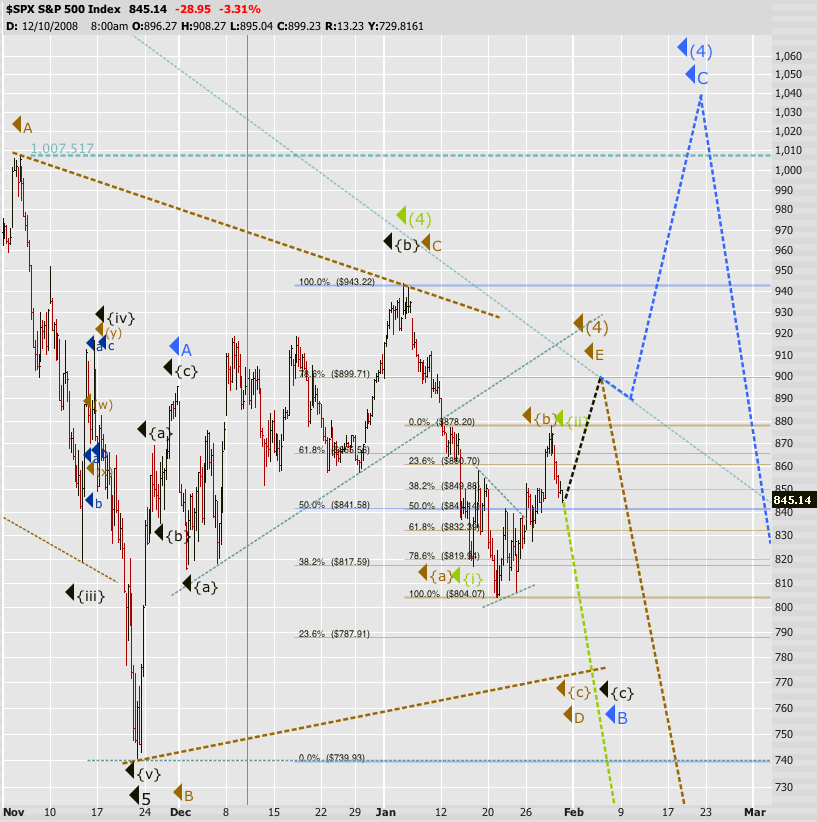
- The green line can now apply to the green or orange scenario - meaning either today’s highs (which I missed out on - grrrrr) were the top of minor 2 of intermediate (5) or it was the top of minor wave E of intermediate wave (4). If it was the former then we should keep dropping here and that pronto as we should now be in wave 3 of (5) - no more of frustrating whipsaw action. Gaps should only happen towards the downside, not the upside. So, we’ll probably know fairly soon if this one is playing out.
- The orange line scenario would have us rally to the upside fairly soon, I think 840 is what I would be looking at, bringing us to our 900 zone which we have been coveting. This would also give us relative equality with the first a wave up and thus produce a nice a/b/c. Tomorrow or Monday is when it needs to happen, so this scenario is also due to finally resolve or walk into the sunset.
- The blue scenario shares its path with the orange one until the separation point around 900. If we keep pushing past 920 it would be strike 1 for blue, and if we push past the prior 944 top then that would be strike 2. To continue our baseball analogies - home base would be at around 1020 - 1040. We would probably not get there in a straight line, so if this scenario unfolds expect more of this torturous tape we had to condone during the past week or so.
Also note how nicely the two Fibonacci scales fit into each other - the 50% lines are overlapping and the 100% and 0% lines fit right inside centers of the large ones. I’m not sure what this means, but it’s worth mentioning as it is a tribute to how omnipresent and magnificent the ‘golden spiral’ really is. Sometimes you see something that has meaning - you know it instantly - you don’t know what exactly its meaning is, and sometimes it takes you a long time figure out. But when we see truth or something truly beautiful we recognize it instantly.
In that spirit I am dedicating tonight’s post to Leonardo Fibonacci. We all greatly benefit from his work on a daily basis, but rarely do I see a tribute to his work and his genius.

‘A. Leonardo Fibonacci, Insigne Matematico Piisano del Secolo XII.’ |
|
|
 [复制链接]