- 金币:
-
- 奖励:
-
- 热心:
-
- 注册时间:
- 2006-7-3
|
|

楼主 |
发表于 2009-4-1 06:11
|
显示全部楼层
December 5th, 2008 1:37 pm Intraday Update 204 Comments
UPDATE 1:30pm EST: As you guys can tell we are still fine-tuning the zero. I just changed the smoothing of the 30min chart to 2 after Berk told me that this setting worked very well for him. I tested it for a bit and think that he’s spot on. Let’s keep it that way for a while - hope it works for you rats.
Regarding the 15min Zero: Seriously, I was actually against posting this one as I have the feeling that, although everyone wants it, it might not help your trading, IYKWIM. Do me a favor - just use the 15min as a visualization of the short term trend. But do not trade it as it can whip you - just like the market can whip you. Remember folks - the Zero is not a crystal ball. It only gives you early entries/exits sometimes because the underlying market forces shift and the Zero shows us that before prices start reflecting it fully. I hope that makes more sense for you guys.
We should all focus on trading the long term trend with the zero. If you are a swing trader or day trader - please do not use it. If you do, it may work for you, but I will not support you in any way if you run into situations where you being faked out.
UPDATE 2:34pm EST: Someone complained that the zero was ‘too jittery’. Well, it’s not our fault if you cannot follow simple instructions. Case in point:
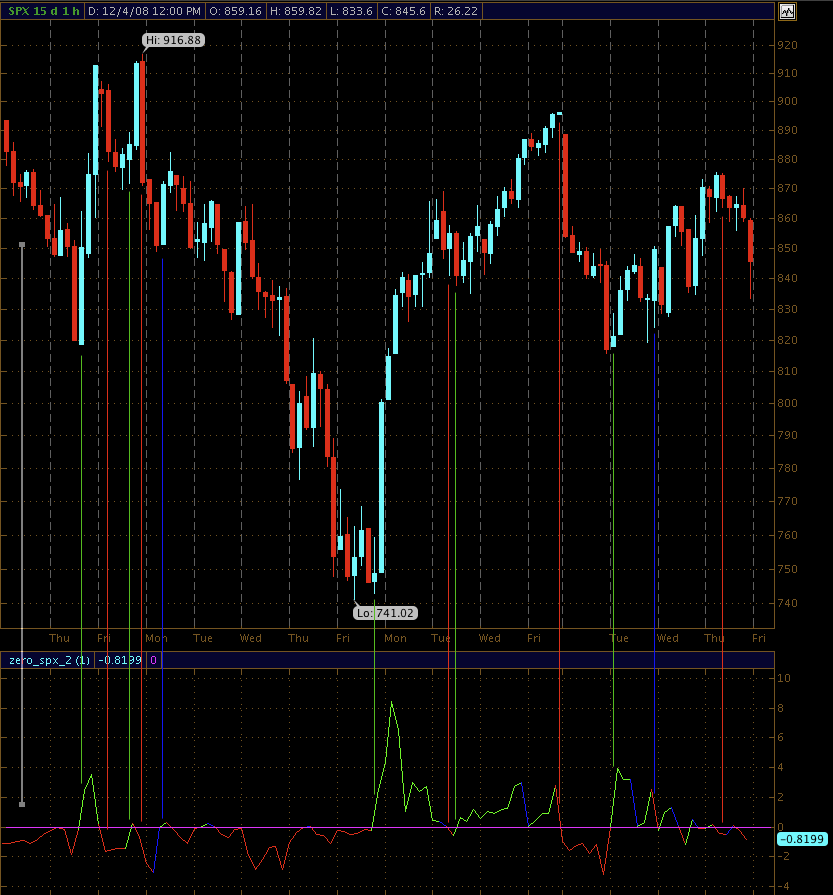
This image is part of the new tutorial I’m working on. It shows the 1hr Zero in action over the last 15 days. Red lines depict short entries, green long entries, and blue possible exits if you are light on your feet. Now, each of those trades would have been successful, assuming you would have waited for a confirmed entry.
Again, the market is extremly whippy right now - but even under these conditions I think the Zero is holding up quite nicely. After all, it started pointing up early in the morning and where are we now?
I am actually thinking of automating the Zero for my own purposes. This way I take emotions out of the equation. Which are usually why trades are unsuccessful - the tutorial is quite specific on waiting out the signals, but it seems many of you guys are on hare triggers.
UPDATE 3:26pm EST: Check this out:

How about that? Same phrase I saw last time we rallied on bad news. Remember, true wisdom is to call things by their true name. So, let’s replace ‘wave off’ with ‘ignore’ and see how that comes across. Well, we for sure won’t fight the tape though - zero has called it nicely today (irrespective of all the bickering by members show shall remain nameless).
UPDATE Closing Bell: Some of you asked for an EOD Zero chart and as I love to serve my nefarious leech legions here it is:

I even pointed out the entry point - just to rub it in 
Somebody mentioned that I talk about the Zero too much. If I do - please accept my apologies for my irrational exuberance. Just having too much fun with it. But I did post a poll on your right - let’s see what the majority thinks. After all, I don’t want to blow up the blog over that.
Have a good weekend!
Intra-Day Update: Can we trust it?December 5th, 2008 10:36 am Intraday Update 156 Comments
UPDATE 10:06am EST: I think after several days of whipsaw and chop in combination with broken correlation indicators (e.g. TNX and Yen) nobody really trusts this tape too much. However, the sad reality is, my dear rats, that these are usually the times when the market makes the biggest moves. We always kick ourselves when we get caught in a morning trap and pay for it. We ask ourselves: ‘How could I have been so stupid? I should have known!’. Well, if you had known, you probably would have gone the other way, right?
What then happens is that we step back and go into cash - rightly so, I might add. However, staying in cash can also be a trap. What often happens after whipsaw fake outs, is that the market suddenly picks a direction and makes a big move. Then we ask ourselves: ‘Damn it - how could I miss out on this monster move?’. So, you wind up chasing the market and get what you deserve.
Then you are frustrated. You look at all the money you lost and you feel you are always one step behind. You doubt yourself and your entire trading approach is falling apart. You step away from trading for a few days, a week, maybe even a month. In the meantime the market keeps moving.
These is the mental theater we go through as traders. There is nothing wrong with stepping back and waiting for a better opportunity. But do it with humility. Meaning, if you missed out on a move, smile and wait for the next one. Never chase it. But also don’t let your emotions keep you from trading. You might get faked out once or twice, but don’t let recency bias get the better of you.
- Recency bias is to think that the market will do today what it did yesterday.
- Recency bias is to think that a stock hates you because it has gone against you every time you picked it up.
- Recency bias is to get faked out yesterday and expect the same today.
- Recency bias is to double your portfolio in a month and expecting the same to happen this month.
I think you get the drift. Recency bias can swing both ways and it’s a silent killer. Every day is a new day and the only constants in your trading should be your patience and the realization that the market is going to do its thing with or without you. You are just along for the ride.
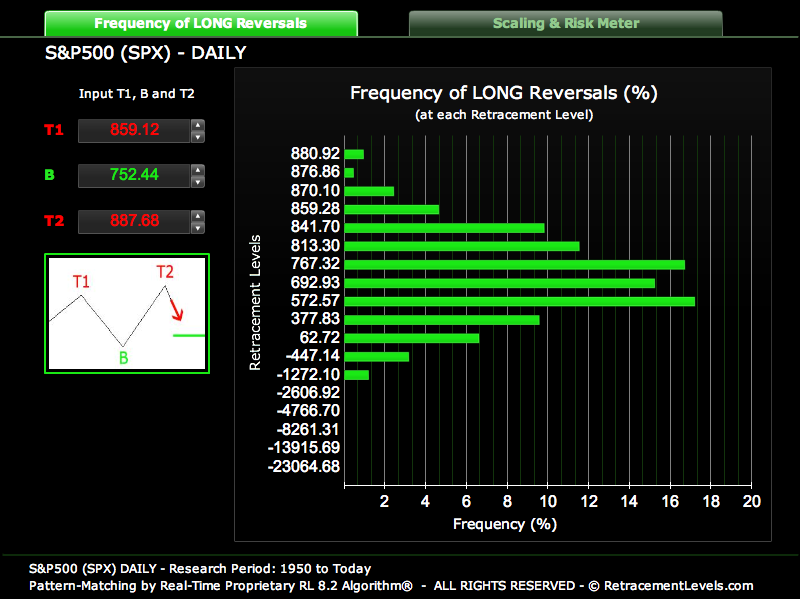
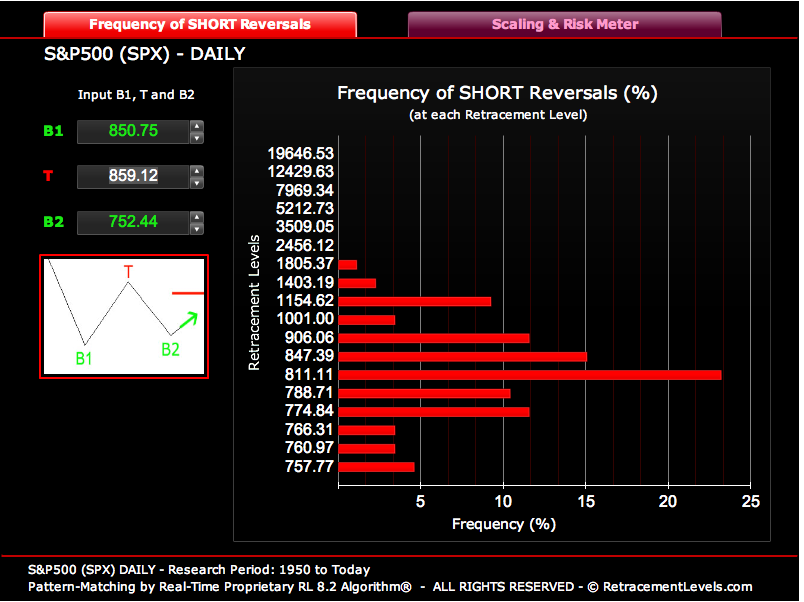
Here are today’s weekly/daily retracement levels:

UPDATE 10:47am EST: My apologies for the ‘zero outage’ but the damn screen grab uploader crashed this morning (you know - Windows…) and I didn’t expect all the settings to be wiped on a relaunch. So, it was just storing the images locally - the ftp settings were inactive. Anyway, should work now - my apologies for any inconvenience but you know how it goes with Windoohss.
UPDATE 11:16am EST: Okay, let’s try something new. I think we as a group should put together a list of our top 50 stocks that we like, trust, and are conducive to option trading (e.g. volume, slippage, 5% + 10-day ATR, etc.). So, for our TOS users I have put together a CSV file of my current favorites (comma separated values file - there are actually no commas in the Prophet format, but whatever), which you can import as a watchlist into TOS like this:
If you don’t use TOS, do not despair as you can just open the file in your favorite text editor (e.g. notepad on Windows or TextEdit on OS X). Let’s go through these over the next few days and add some more and maybe remove the ones which we agree might not work going forward. Of course this is a ‘living list’ meaning that we should keep it evolving as market conditions change.
Thoughts would be appreciated.
UPDATE 11:23am EST: In that context, there is a wonderful watch tab in TOS. Just go to heart beat icon and then select the favs watchlist you just imported. Should look like this:

Now you have a ‘world view’ of what your favorite stocks are doing. It’s also easy to find ‘pull backs’, for instance if you missed out on DRYS’ morning rally and expect the market to go up today (which I don’t right now - but just hypothetically speaking), then you can tell that it has pulled back quite a bit. So, that might be your chance to get a good entry. Anyway, just to be clear - I’m not going long here - just a good example
UPDATE 11:55am EST: Well, I guess I just ate my own words (see above). Market is forming a nice reversal right now but I’m not sure this is turning into a real rally just yet. Let’s keep watching those RLs - we are approaching 833 which is a meek short RL. If we push through that one we might go all the way. But in order for that to happen we need to see more volume/conviction. Doesn’t feel like buying pressure, more like lack of sellers. What do you guys think?
December 4th, 2008 10:03 pm Market Forecasts 124 Comments
I’m gonna keep it short and sweet tonight. I haven’t been feeling too well, and have only been casually observing the markets for the past few days.
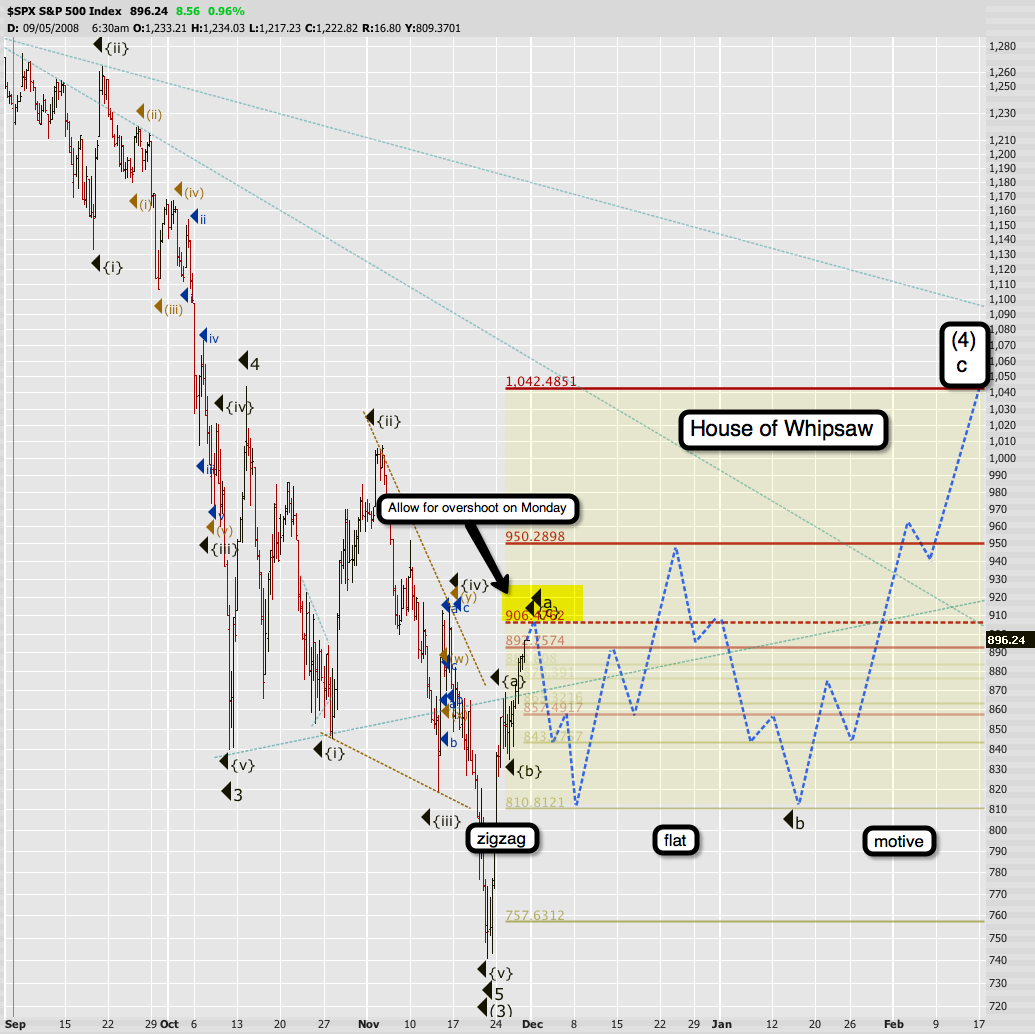
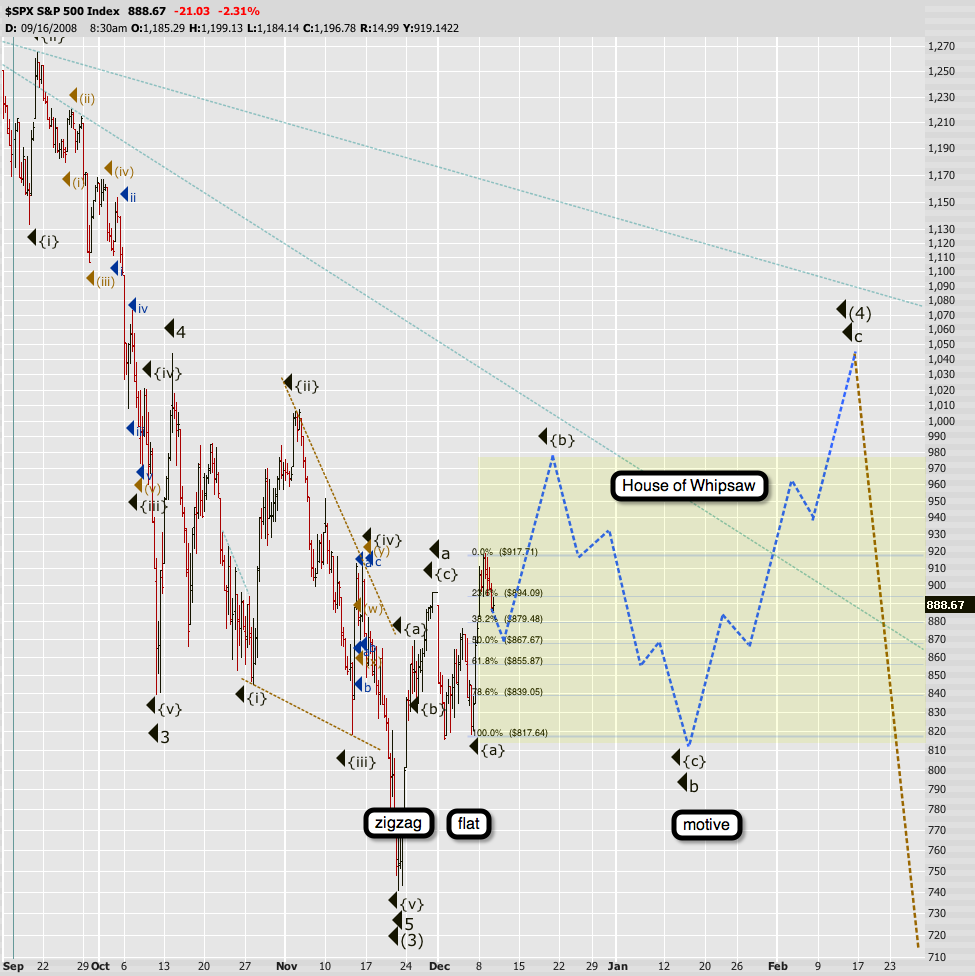
The markets seem to have broken their upward corrective channel, signaling a move lower is likely underway. Let me clarify the move lower since,at this point, we cannot decisively discern the best wave count taking place. That said, the push lower COULD stop in the area around 7900 in $INDU if the rally from the 11/21 low was a [1] up (most likely a part of [4]), and the subsequent decline, then rally, and now decline would be the A (drop), B (rally) and C (recent drop still underway) of wave [2]. This level in the $NDX would be around 1065. The other major competitor for wave count would be that the decline is just starting wave [3] of and ending diagonal. If this were the case, we should continue to chop lower, but with plenty of rallies in between.


We are also entering a seasonally slow period, as we are working well into the holiday season. Breadth was drastically negative today, not quite completely reversing yesterday’s positive numbers. Either way though, we can expect many whips for the coming future. There are solid resistance levels on both the top and bottom, and until we can break either of these levels, the near-term trend would best be called sideways. Likewise on the mid-term, though I will call it mixed until we get a clear signal. And since I favor overall down-side resolution, I am moving the long term indicator to down-up.
I do apologize for the brevity of this post, as I mentioned, I am not feeling stellar, and since I have little conviction, do not feel like rambling back and forth between views.
Skål! |
|
|
 [复制链接]