搜索
楼主: hefeiddd

一个笨蛋的股指交易记录-------地狱级炒手

  [复制链接]
 楼主| 发表于 2009-4-1 15:27 | 显示全部楼层
September 30th, 2008 1:54 pm Market Forecasts 74 Comments

I had a friend come into town yesterday that I have not seen in years, so I am going to go ahead and publish tonight’s post now, and potentially do some editing real time if need be, so I can jet outta here at the close.  There is not much to say here.  We’re up, the financial markets survived another day…  Markets are near term overbought (intraday) and at resistance levels.  The stage is set for a big move tomorrow.
Like Mole said yesterday, the market completely crashed.  We know there are a few things we should expect after a move like that.  One is a “volatility crush,” which the $VIX is gladly giving any poor sap that trades options.  Another is a bounce, and we have got a nice bounce today.
More, more, buy signals galore!

The two same options remain on the table.  The odds are fairly split, and gobs of evidence can point to either solution.  However, rally or no rally, we maintain that the larger trend remains down.
Still more to come...

I also want to encourage everyone to step back and play the charts.  Yes, there is looming news, but I can’t trade based on the reactions that I can’t predict about news  that I may or may not know is coming.  I would much rather grab things at support or resistance, and take small positions due to the massive IV here.
Gave a nice entry...

Looking at the ripples, I can make a very strong case for a complete or almost complete wave 4, meaning we should get another decline very soon.  I wouldn’t be surprised to see us move down tomorrow morning and bounce back up after the vote.  The chart below shows the $SPX on a 10day 10 minute timeframe.  If this timeframe is not what you trade, simply understand that the market is setting the stage for a decline rather than a rally on this scale.
Could be done

And here is the $SPX on a daily timeframe…
Daily $SPX chart...

And as annoying as it is, we need rallies like this so we can continue to play down our favorite stocks.  As Mole said, no matter how many 300 point rallies we get, the trend is still down.  We might have a week or two of pain in front of us, but the resolution will ultimately be lower prices.
God gives us bounces for a reason...

As it stands right now, the markets have retraced between 38.2% and 50% of yesterday’s delcine.  These are typical targets for a retracement.  Things that were down huge yesterday, and up huge today make easy targets for those willing to take some risk right here.  You guys know me, I can’t help but grab puts on Tech, and after yesterday, maybe you understand why I have that urge.  9% drop in an index is one day is a pretty big move.  In case you forgot, a list I am keeping my eye on includes BIDU, GOOG, FSLR, MA, CF, CME, ISRG, CCJ, AAPL, OI, and a few more.
As Mole likes to say…”No balls, no babies!”  But make sure your risk is managed, we don’t need anyone castrated… Finally, I will leave you with a beautiful illustration of our financial debacle, as illustrated by Mark Slavonia as displayed by tech crunch.  I want to see US Congress vs. Queen of England… or WFC vs. the Federal Reserve…
Financial Madness. Who will be the winner? Not the taxpayers...

Skål!
金币:
奖励:
热心:
注册时间:
2006-7-3

回复 使用道具 举报

 楼主| 发表于 2009-4-1 15:28 | 显示全部楼层
September 30th, 2008 9:59 am Intraday Update 25 Comments

UPDATE 9:50am EDT: The markets seem to have quieted down on the following headlines:

Overnight the London interbank offered rate (LIBOR) reached an all time high on the failure of the bailout plan, and the market sell off.
“The money markets have completely broken down, with no trading taking place at all. There is no market any more. Central banks are the only providers of cash to the market, no-one else is lending.”
-Christoph Rieger, a fixed- income strategist, Dresdner Kleinwort.
Berk and I are watching the markets right now and keeping our powder dry. If we are lucky the Senate will be foolish enough to pass some compromise of the bailout on their end, hoping to invigorate an agreement over at the House. If that happens, expect a major bounce - Christmas time for us nefarious bears. Well, one can dream - I for one am encouraged to see the Dow retrace 250 points overnight.
We’ll keep you folks in the loop with thoughts and ideas while we watch this sideways action today. I frankly don’t expect much to happen here as today is a Rosh Hashanah (Jewish New Year). Use this time to pick your new victims - watch our for retracements back to previous support lines. Remember, despite the focus on the averages, this is a ‘market of stocks’.
UPDATE 12:03pm EDT: For a good laugh point your browser
UPDATE 12:51pm EDT: Courtesy of our friends at  end result: The United Singularity:

UPDATE 1:16pm EDT: We’re planning to grab some R calls around 62 as risk can be managed very easily:
金币:
奖励:
热心:
注册时间:
2006-7-3

回复 使用道具 举报

 楼主| 发表于 2009-4-1 15:29 | 显示全部楼层
September 29th, 2008 8:59 pm Market Forecasts 38 Comments

I’ve been saving this video for a special day - crank it up and enjoy it while you count the insane amount of money you’ve made today - this one goes out to you, Tim Knight!
I’ll get right to business, because frankly I’m completely exhausted and I also don’t want to bore you with breadth stats and other technical mumbo-jumbo. The market completely tanked today, we all know that. So, let’s solely focus on the one question on our mind: What will happen next?
SPX targets and variations in paths.

The boys over at the PPT (and the market) weren’t prepared for the curve ball (i.e. no-confidence vote) Congress sent them this morning and wound up taking the ball right where you feel it most. Ouch - that oughta hurt. So, what’s next? Don’t expect Hanky Panky and Helicopter Ben to take this abuse laying down - can you say interest rate cuts? Which frankly, wouldn’t make much of a difference technically as sources tell me that the true fed funds rate behind the curtain has already been around 1.25% - 1.75% for about a week now. But it would make a statement and I’m sure the PPT feels compelled to do ’something’ as the alternative is to embrace the abyss which I have been predicting for months now.
So, my trusted chart above shows the variations we can come to expect going forward. Frankly, I intently hope for a rate cut because I’m sitting on a mountain of cash which I would like to put to work before wave 3 of 3 runs out. But there’s no way I’m buying a massive amount of puts while Mr. VIX is getting comfortable around the 45 mark - too much risk frankly. I also think that the market is shot to hell right now, but obviously that doesn’t mean much in a crash scenario. A lot can happen overnight, as our friends over at the Feds, the ECB, the BOJ, the Swiss Bank, etc. are surely sticking their ugly heads together to come up with yet another scheme to save their smelly behinds. We will just have to wait and see.
PPT Panic Line breached.

I posted this chart earlier today, and we have dropped to 10365 since, however the point I was trying to make remains. We are pushing through the lower boundary of a channel which has been the trigger zone for PPT panic action, that’s why I call it the PPTPL. Again, another indicator that ’something’ might happen over night. It was also the reason I went completely into cash before the market closed. Tough choice to make, but we all know what happened on the evening of September 18.
There is the possiblity that this market doesn’t look back and keeps on dropping, due to the lack of short sellers taking profits. Talking about a dumb idea backfiring on the market - I hope this lesson will be remembered on Oct 2nd when this hare brained rule finally expires.
Trannies finally caving in.

I do have some good news for you bearish evildoers this evening. It seems that the ‘trannies’ finally broke their trendline and are pushing towards those January lows. A close beneath those lows is needed in order to confirm the bear market signal that was triggered in November. Not that anyone in their right mind would doubt the validity of this bear market at this stage - maybe Beanie would. Just kidding Beanie - we all love you - hope you didn’t lose your pension today.
Incidentally, this is something I posted a few weeks ago about the DJ Transportation Index:
The popular belief is that the Dow Tranny Average’s June all-time high and relative strength vs. the DJIA’s October high is a bullish market signal. This is not necessarily the case. At 259 weeks, the ride above its 200-week moving average is longer than all but four similar trips. Those episodes culminated in 1929, 1957, 1987, and 2000. The closest parallel to today is 1929, when the Transports remained relatively strong versus the Industrials. In the fall of 1929, the Transports peaked with the Industrials on Sept. 3rd, but declined only 32.6% to Nov., quite a bit less than the Dow’s 49% crash in the same period. A counter-trend rally in both indexes lasted through April 1930. But then the Transports’ break of their 200-week MA in May confirmed an across-the-board stock decline in which they led the charge lower, falling 93% to a 1932 bottom, the largest decline among the Dow averages.. The Industrials erased ‘only’ 86% over the same span. The Transports‘ months-long defiance of the downtrend now many signal an even more extreme downside fate soon.
So, I’m open to any transportation related plays you had your eyes on - time to give back you blood sucking leeches!
Gold was a non-event today.

So, as the market relinquished 777 points today, Gold gained a whopping 30 points. Say what? Seriously, I’m not sure what to make of Gold right now. Obviously, the bullish trend is a non-brainer but we should have seen a 60-80 point rally at the very least. Something fishy is going on here and I think that some serious amount of TOMO/POMO repos are being used to put a lid on gold. After all, the Dollar actually surged today and certain people continue to do their very best to discredit Gold as a safe haven from a crashing market, plus perhaps even an alternative currency in those dire times. Frankly, I would be very careful with Gold long positions at this point - we should have seen Gold go bananas today and this tape is nothing but a wimper. I’m still bullish Gold, but don’t see a good entry here - if you feel adventurous I would caution you to at least keep your position size small.
These are exciting times for the bears, and many of us banked some mighty coin today. However, for the record - things didn’t work out the way I hoped. I would have preferred a rally before such a massive drop as most of us never had a chance to seriously load up on massive puts or short positions. At some point I expect to get a violent bounce back, which would be typical for a wave 3. If that happens, you must not hesitate and immediately load up on puts, the long term trend continues to be towards the downside. You know what to do - keep it clean and don’t get greedy or emotional - both will kill you in this market.
金币:
奖励:
热心:
注册时间:
2006-7-3

回复 使用道具 举报

 楼主| 发表于 2009-4-1 15:30 | 显示全部楼层
September 29th, 2008 3:28 pm Intraday Update 34 Comments

Not going to waste your time with any chatter on how sweet this move was. Yes, it was more than any of us had hoped for going into the weekend. However many of us didn’t catch much of this one, but that’s a story for another day. Something I NEED to caution you guys about as we’re nearing the closing bell is that we’re dangerously close to the PPTPL again. Take a look:
Back to the PPTPL.

If you’re holding any puts, 3:55pm EDT is a good time to close out. We don’t know what the PPT will come up with overnight, they are surely holding emergency meetings as you read this. Perhaps we get a cut of the fed funds rate to 1.5 or below - although for the record you should know that inofficially it has been already lowered to between 1.25% - 1.5% behind the scenes. So, it would not make much of a difference at this point, but that won’t stop Ben and Hank to do ’something’. Be prepared for a bounce tomorrow - which would be good for us bears anyway. I’ll be back later.
Intra-day Update: DLTR H/S TopSeptember 29th, 2008 12:53 pm Intraday Update, Update 11 Comments

This is a potential H/S top on DLTR.  IF it is not a H/S top, it is a double top, and should be heading lower either way.  IF the H/S is correct, we can target 32 for an exit.  This accounts for about a 15% drop from here.  Not bad.  We need this to break lower before we jump in, unless you are feeling aggressive in this market, in which case today’s strength would be good for a slightly better, but pre-mature, entry.

DLTR has very nicely priced options.  I really like the price of the Oct 37.5 Puts, but with a potential move like this, the Oct 35 Puts for about $.65 could get a nice price explosion.  For those of you looking for a little more time in this market, be wary as the time value you purchased today will literally be burning a hole in your pocket.  To me, the Nov 35s are reasonably priced also, but I don’t want to overpay for that time value as of yet.
Skål!
金币:
奖励:
热心:
注册时间:
2006-7-3

回复 使用道具 举报

 楼主| 发表于 2009-4-1 15:31 | 显示全部楼层
September 29th, 2008 10:03 am Intraday Update 25 Comments

UPDATE 10:01am EDT: I love to hear the sound of screaming bulls in the morning. A little warning to my legions of revenge filled bears however - don’t try to catch a falling sword - wait for a bounce (IF we get one).
It’s interesting to see the market drop 200 points through 2 pivots without even so much as looking back. As I’ve said - that short sale ban is really backfiring on the bulls now. Anyway, here’s a little chart I cooked up over the weekend:

Of course, right now might not be the time - at least wait for a rip before you load up (VIX on a steep rise).
UPDATE 10:25am EDT: The yen is simply exploding this morning, despite the Dollar painting a gap up.

The inverse relationship remains to be a valid indicator - keep watching the Yen if you want to know where the market is going.
BTW, I want to strongly discourage folks from ‘buying the dip’, hoping to ride up the bounce - unless you’re trading index futures of course. The VIX is at 39.71 right now, so the market makers are going to charge you a huge premium, the bid/ask spread is insane, plus you get killed by a drop in IV on the way back up. Our plan at this stage is to wait for a bounce to load up on puts, although I’m a bit worried as I do not see any buyers step in despite the Dow having dropped 300 points in one hour.
UPDATE 10:50am EDT: I just came across release. The interesting part (among others) is this:
The Federal Reserve announced today several initiatives to support financial stability and to maintain a stable flow of credit to the economy during this period of significant strain in global markets.
We will continue to adapt these liquidity facilities as necessary and will keep them in place as long as circumstances require.
Actions by the Federal Reserve include:  (1) an increase in the size of the 84-day maturity Term Auction Facility (TAF) auctions to $75 billion per auction from $25 billion beginning with the October 6 auction, (2) two forward TAF auctions totaling $150 billion that will be conducted in November to provide term funding over year-end, and (3) an increase in swap authorization limits with the Bank of Canada, Bank of England, Bank of Japan, Danmarks Nationalbank (National Bank of Denmark), European Central Bank (ECB), Norges Bank (Bank of Norway), Reserve Bank of Australia, Sveriges Riksbank (Bank of Sweden), and Swiss National Bank to a total of $620 billion, from $290 billion previously.
Mole here again: These ’swaps’ basically mean more ‘cash for trash’. The Fed has made its priorities clear at this opint: It’s more important to save failing banks even at the cost of the complete destruction of our currency and the solvency of our nation.
金币:
奖励:
热心:
注册时间:
2006-7-3

回复 使用道具 举报

 楼主| 发表于 2009-4-1 15:31 | 显示全部楼层
September 28th, 2008 7:54 pm Market Forecasts 35 Comments

I was hoping that by postponing our weekend post until Sunday evening I would have something interesting to post, potentially regarding the bailout.  As it stands right now though, futures have just started trading, and are down inconsequentially.  The bailout wording is supposed to be presented later tonight, no doubt in time for Asia to benefit from it.
I don’t believe there is much to review as far as wave pattern, or current options as far as the markets are concerned.  We are in a wave 3 decline, and most likely a 3 of 3 decline.  As you can plainly see by the weekly chart, the trend is still down.

We are almost all expecting a rally of some sort at this point.  The bailout will go through in one form or another, and it IS actually needed.  Considering the wording as I see it thus far, it looks like the rally will be short lived.  However, Congress is being clever by leaving it open ended as far as the funding, keeping the random PPT rallies a very real concern for the bears.
Mole and I have been suggesting the people without the nimbleness required for day-trading keep plenty of cash on the sidelines to play with.  I, personally, have been trading a select few high beta stocks.  My current list accounts for about 10 stocks that I have been trading back and forth with a high degree of success.  You are all familiar with the list, BIDU, GOOG, CME, FSLR, CF, MA, LVS, OI, and CCJ to name a few.  As you can see, these stocks have been moving around 5% a day for a few weeks now, offering for some very easy profits so far.  Also, by focusing in on a select group, you tend to get a feeling for their movements.  You notice how the stocks move, in relation to themselves and the markets, allowing for you to get very good entries and exits if you pay attention.
CCJ…
Inverse H/S or break-down?

OI giving a nice entry at resistance here…
Entry @ Resistance here

And GOOG nearing that precious breakdown…
Looking for 350!!

Finally, the $VIX has given 3 confirmed buy signals this month.  I have noted many times that “it is often the second or third buy signal that is the real one.”  That said, the $VIX is fickle on the buy side, but this is the most CONFIRMED buy signals I have seen through my trading.  Since we have failed to get a close above the 9/17 close, this is adding credence that this rally might have some ground to gain.  But, this rally should be fierce and swift, as the abundance of buy signals is another confirmation that wave 3 down is indeed underway.
Buy signals galore!

I am really looking forward to this week.  I will not make many bets until the dust has settled.  I maintain that the larger trend is down, and strong rally or weak rally, we will see lower prices in the future.  The internals continue  to be weak and/or weaken as these “rallies” continue.  As far as classic trend opinions go, lower highs and lower lows constitute a down trend.  IF we rally with some continued strength, look for the elections to stop the rally dead in its track.  I don’t expect to see it go that far, but the government has been working very hard this weekend, and anyone can guess what we will see.   Tread lightly and keep your powder dry, plenty of opportunities await us in the near future.
Skål!
« Older Entries
Newer Entries
金币:
奖励:
热心:
注册时间:
2006-7-3

回复 使用道具 举报

 楼主| 发表于 2009-4-1 15:33 | 显示全部楼层
September 26th, 2008 2:40 pm Intraday Update 34 Comments

UPDATE 2:39pm EDT: We’re waiting for wee-bit of a drop to go long IPI - info is on the chart:

If you take this trade your toenails will fall off and you will lose your premium and the respect of your peers.
UPDATE 3:20pm EDT: Mark your calendars boys and girls - Berk and I just went bullish (for one weekend). Thus we decided to grab a small amount of DIA calls. The PPT is most likely going to get some kind of bailout deal this weekend, so just for once we trade along with the baldies. Let’s see how that works out.
UPDATE 5:42pm EDT: Great article I encourage you to read. Basically, in a nutshell - government bailouts and other types of manipulation do not prevent or stem economic contraction. Incidentally, they are also priced into Elliott Wave Theory I would like to add - in the end market forces always always prevail. Don’t worry my wicket little evildoers - we will get our crash rather sooner than later.
UPDATE 9:57pm EDT: Failure Friday strikes again. This week’s (2nd) victim: Wachovia - a plan seems in the works to force the bank into a merger with Citigroup.
Intra-Day Update - Shorting LVSSeptember 26th, 2008 1:02 pm Intraday Update, Update 6 Comments

Since Mole has been stepping up his game on the blog here since the “crash” in his clout, and I am sitting on heaps of cash since about 10:00 this morning,I have been watching LVS for a re-entry here lately.  I grabbed a nice short position on the 19th, right before close (illustrated by the blue circle).  When LVS was up nearly 6% today while the markets have been churning around their bottoms, I found a nice entry.  LVS had poked outside the 2.0BB on a very small timeframe, and had pushed into the proper fib retracement levels.  I grabbed a partial at the second blue circle on the chart.

I am eyeing the OCT 35 Puts…
I am waiting for a break in the orange uptrend line before I grab the rest of my position, and I thought I would put it in front of you too.  I checked yesterday, and a 10-day ATR on LVS rung in at 4.57, yes, roughly 15% a day.  Boys, it is a mover, and the front month IV is fairly high.  IF it moves in our direction, you need not worry, but a move against you will likely push your limits.  Follow me into the Abyss at your peril….I’ll see you at the gates!
Skål!

Intra-Day Update: Evil AG Market Corner MasterplanSeptember 26th, 2008 9:51 am Intraday Update 9 Comments

UPDATE 9:47am EDT: Okay, so despite voices of opposition we chose to ignore Berk and I knew that AG stocks (e.g. ON, MOS, AGU, POT) would tank and that soon. Now, if you missed out on today’s gap, have no fear. This is what we are planning to do IF we get another pop towards that omnipresent diagonal resistance line in that sector:

Hehe, Berk just said “judging by TRA and CF, that is a big IF”.
UPDATE 9:53am EDT: I’m pretty miffed about Gold - closed out my calls last evening and it’s pushing up hard. No sense in chasing this right now - you will get burned. Let it bounce off of 900 for a retest and then maybe grab a few calls. Again, as I said yesterday, and I hate to sound like a broken record here: This is a one huge gold bug trap. We might see lower or mid 900s but I expect the PPT to step in and drop kick Gold back into the ground Van Damme style just like it has since March.
UPDATE 10:57am EDT: Here’s the IntraTrade bet on the US Congress to approve a government bailout of banks on/before 30 Sep 2008:
金币:
奖励:
热心:
注册时间:
2006-7-3

回复 使用道具 举报

 楼主| 发表于 2009-4-1 15:34 | 显示全部楼层
September 25th, 2008 10:30 pm Market Forecasts 25 Comments

I’ve coined a new song I would like you guys to chime in on:
99 bankrupt banks on the wall,
99 bankrupt banks,
You bail one out, and pass it around
98 bankrupt banks on the wall!

Another U.S. institution bites the dust - here’s the [current] Bloomberg spin - things are moving at lightspeed these days and chances are the situation has changed three times by the time I’m done writing this sentence:
The Federal Deposit Insurance Corp. plans to take control of Seattle-based WaMu, the biggest U.S. savings and loan, according to the CNBC television network, and New York-based JPMorgan will buy deposits and branches, the Wall Street Journal said, without citing any sources. The FDIC insurance fund is not expected to contribute any money, the Journal said.
This seems to be turning into a weekly FDIC kabuki dance, except that we get a bank failure Thursdays and Fridays now.
If you come across a fork in the road - take it!

Today’s tape featured more of the stair-step sideways action we’ve come to enjoy in the last few days. A day trader’s paradise - I got so bored that I started to post day trades in my intra-day updates - which were spot on mind you. If you took that trade you made some easy coin - send me pictures from whatever strip joint you decide to blow your ill-gotten gains on. I personally have not taste for dipping into the futures, although we don’t get some kind of resolution soon,  I might change my mind.
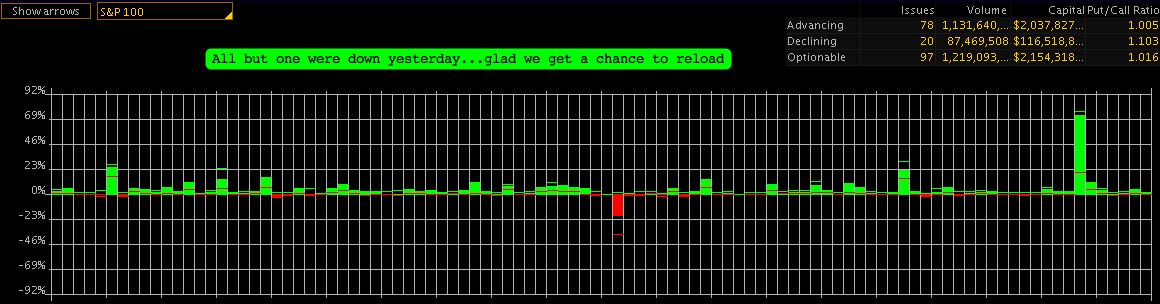
What (almost) surprised me was the bullish breadth in all three major indexes which stood in stark contrast to a wild sell off just before the close of the bell. If that doesn’t make a statement then I don’t know what. Let me see - SPX: 4.15:1 positive - $INDU: 3.3:1 positive - $NDX: 2.7:1 positive. Right, that’s a sell signal if I ever saw one, n’est-ce pas? Seriously now - it’s pretty obvious that there is some monkey business going on and that the Feds have been opening up their TOMO and POMO repo pool to their Primary Dealers (e.g. Goldman Sachs, J.P. Morgan Chase. Citibank), who apparently work under the Fed’s direction, and which are able to use these loaned funds to buy or sell various securities and futures to affect the markets. At last count that floating repo pool was at above $425 Billion - yup, you can move some markets with that kind of spare change, especially when everyone else has stepped to the sidelines plus some major hedge funds were taken out a week ago by dropping a nuke into short sell headquarters. So, next time you see a sudden spike coming out of nowhere and taking the Dow up by 100 points, you know what you’re dealing with.
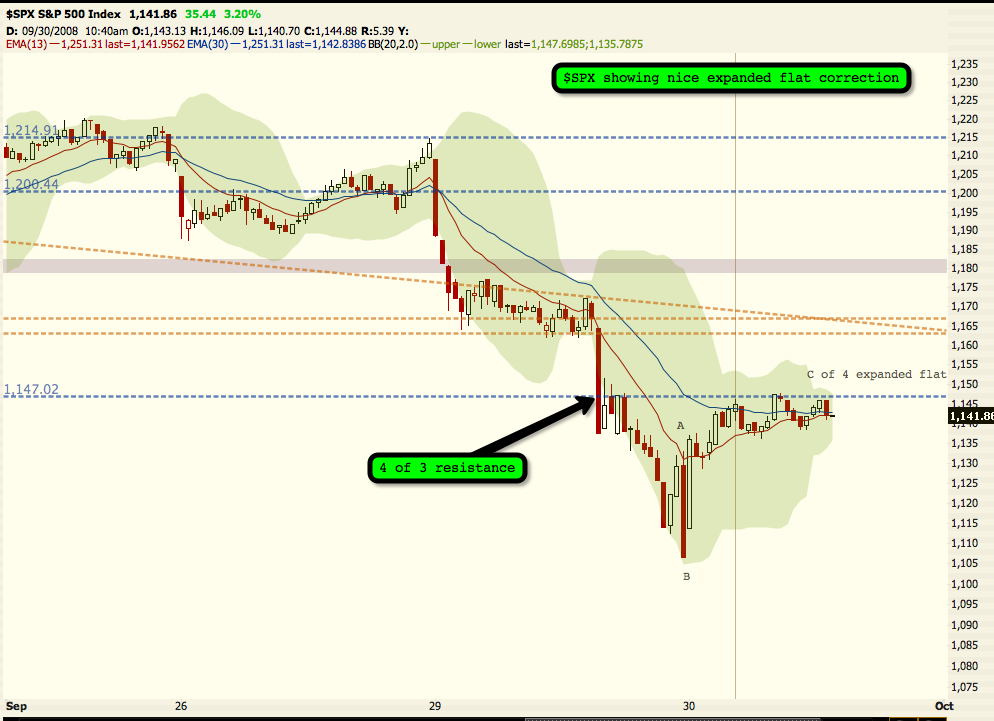
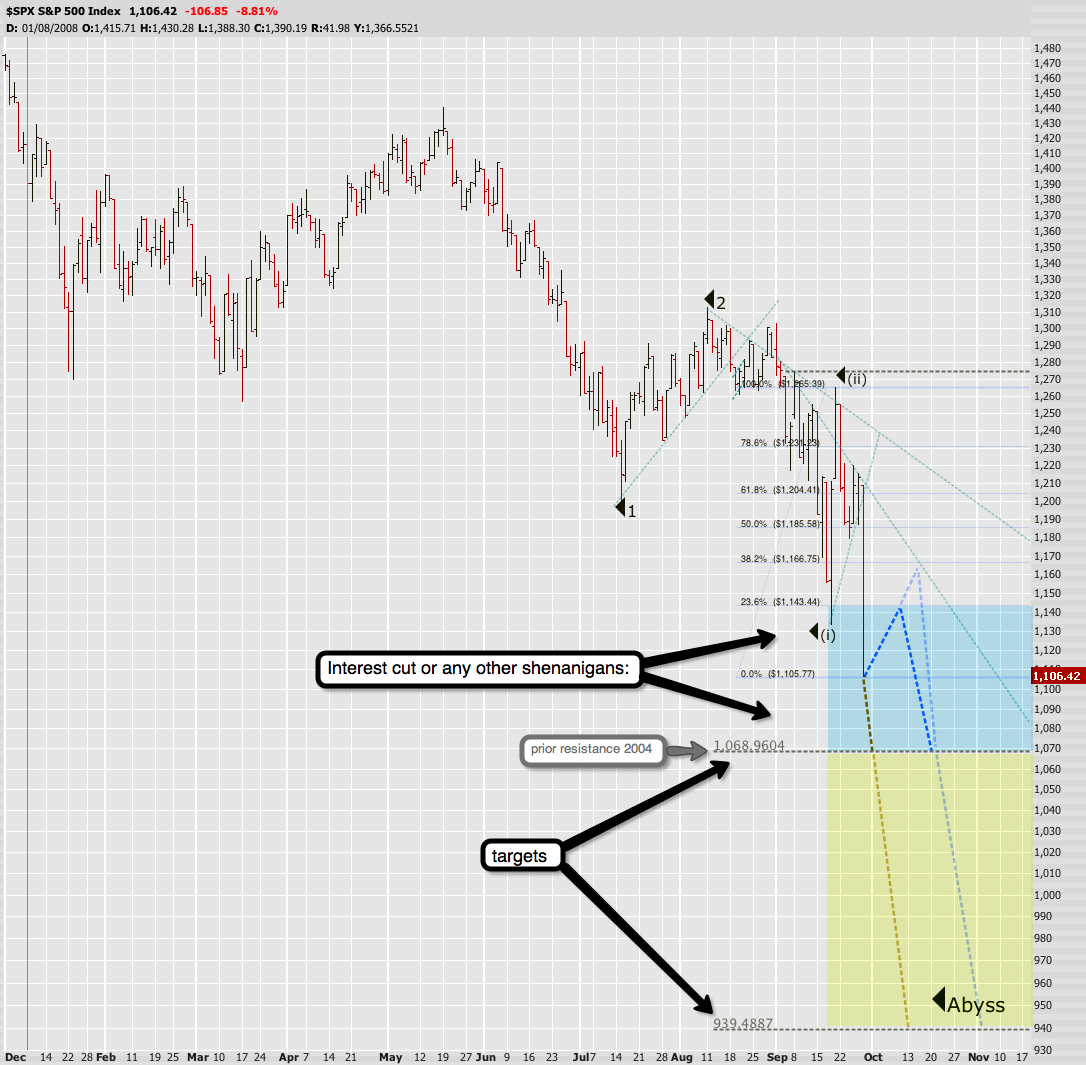
Let’s talk about the chart of the SPX above, which addresses tonight’s main concern of all you loyal leeches. I have heard tons of postulating and diverse theories regarding the bailout boondoggle in the last few days. Last time I checked the ticker it seemed a stalemate has developed, so what exactly is going to happen is anyone’s guess. But let’s cut out all that noise, shall we? Let’s look at the chart, because that’s what we have and that’s what we’re good at. And while we indulge in our nerdish ritual of attempting to predict the future by looking at squiggly lines and numbers let’s also keep something in mind Berk mentioned last night:
Buy the rumor, sell the news!
Sounds simple, doesn’t it? So how come 99.9% of investors fail to put it into practice? Because most of them are hapless idiots who are being taken to the woodshed by merciless beasts of trading like Berk and yours truly. As we are actually capable of looking at a chart, we see two directions as of now - no big surprise there. What’s interesting is the upside potential, which in my mind appears to be limited. To further clarify what I’m talking about for the numerous brain damaged among you I have taken the liberty to highlight various resistance zones which the market seems to respect strongly. One of them was touched today around the 1220 zone and was followed by the end of day sell off. There is little confidence in this market, despite the prevalent assumption throughout today’s trading hours that a bailout of some sort was almost guaranteed.
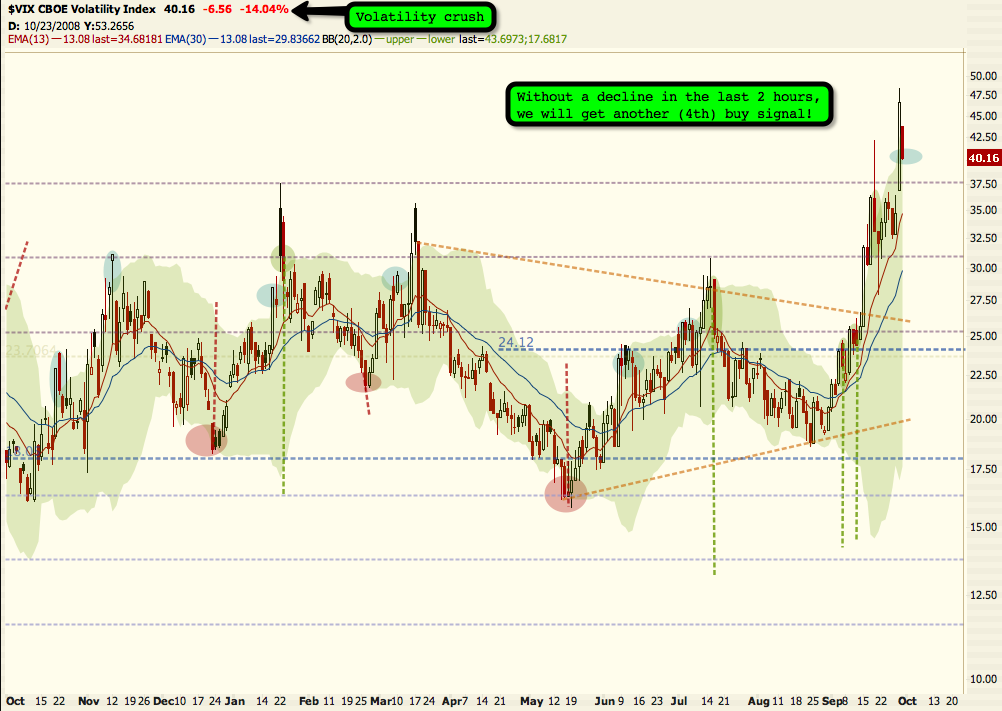
So, the point I am trying to make is that the rumor is not being bought. Add to that a clear sign of caution on the part of the bond traders ($TNX painted spinning top today), plus a widening spread between the 30 year T-Bond yield and Moody’s Abb Corporate Bond yields, plus Mr. VIX still at 33, and it seems that this impending bull rally (if we get it) has little teeth. My long term Bullish Percent indicator ($BPNYA) is actually pushing into bullish territory and give it another day or two and we might actually approach oversold turf.
Considering all this I now believe that the {a},{b},{c} scenario I have been contemplating increasingly appears to lose its luster. Can it still happen and can we still get a major rally up? Sure, anything is possible, but the evidence seems to point towards systemic fear and weakness in the market. Which would mean that a bailout might be good for a little rally but I expect it to be followed by a long drop into the abyss. If we DON’T get a bailout this weekend, well - your imagination is as good as mine.
Hence, starting tomorrow I will slowly start accumulating far OTM puts (Nov/Dec), which I intend to hold all the way. IF we get the bailout and the market pops I will NOT sell as I expect an ensuing sell-off hours or at minimum days later.
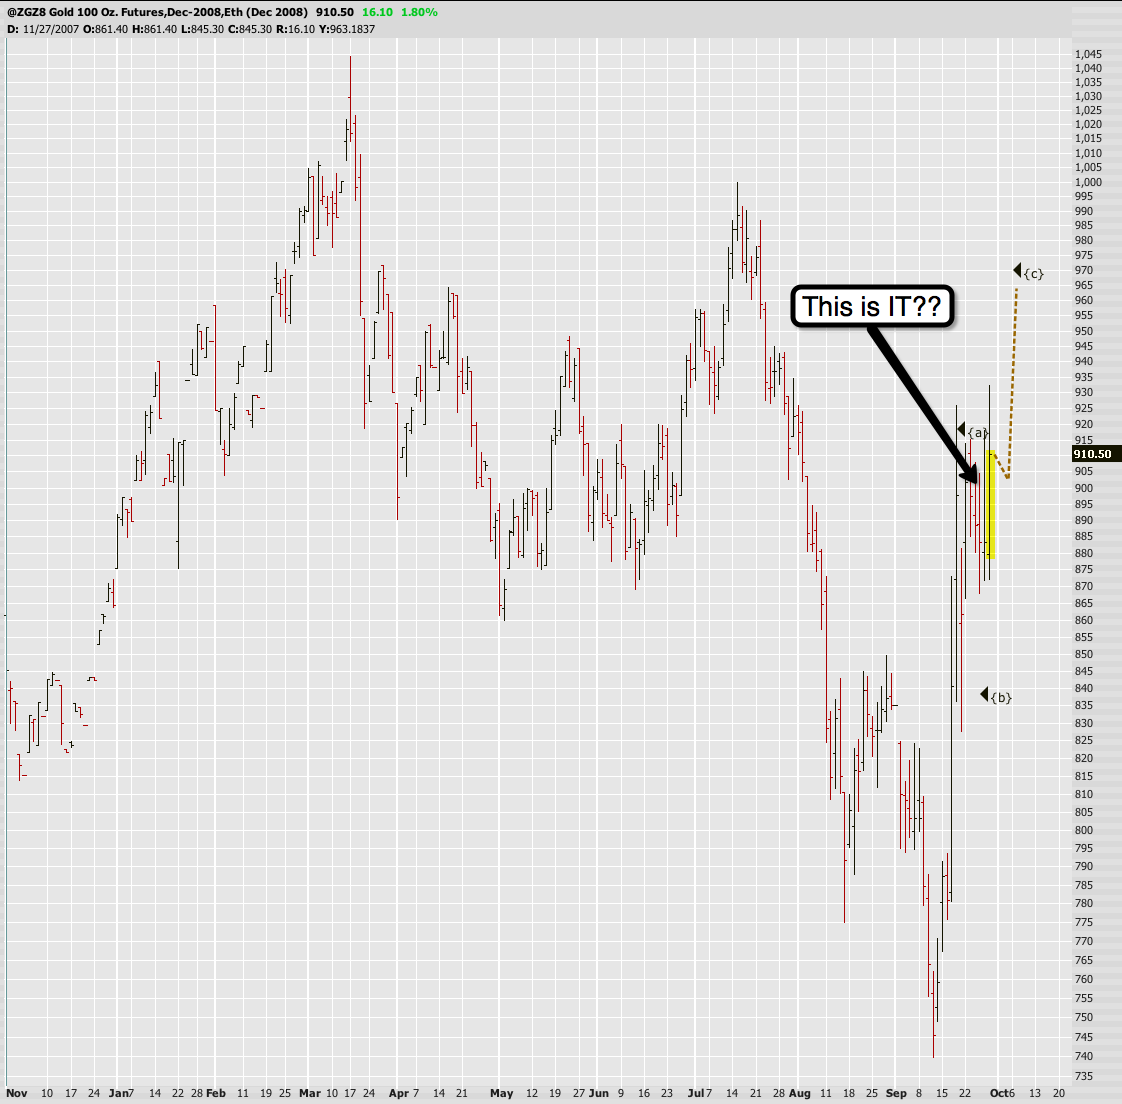
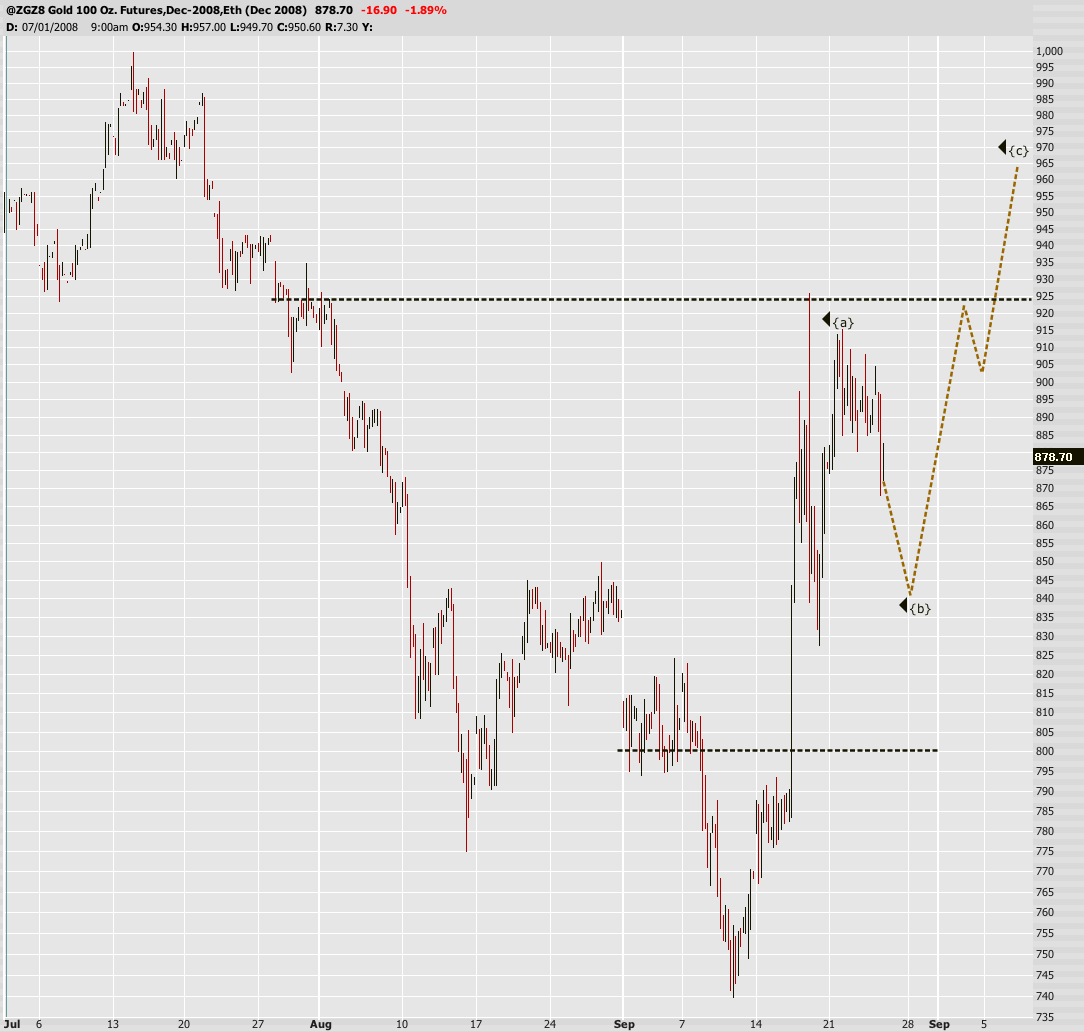
Gold seemingly forming an a,b,c.

Let me conclude with a quick Gold analysis I posted earlier today. The precious metal seems to be tracing out an {a},{b},{c} and the length of {b} which we are tracing out will depend on external factors. If there won’t be a bailout I think Gold will push up and that hard, otherwise it’ll probably time the beginning of its {c} wave with the onset of the sell-off in the equity markets.
However, I want to caution everyone once more that the upside potential here is limited - we won’t see Gold at 1000 anytime soon. My staunch belief is that this nothing but yet another gold bug trap. Will I grab some GLD calls again once I see a good entry? For sure - but if there is an explosive move up I will be taking profits that very day. You have been warned - and btw - no, I won’t debate my reasoning for my paranoid disposition when it comes to Gold. Just know that I have been trading Gold futures for quite a while and people have been disagreeing with me for months now - at their own peril.
Good luck out there - and keep it clean. And remember: One day you will be telling your children or grandchildren about all this.
Cheers!
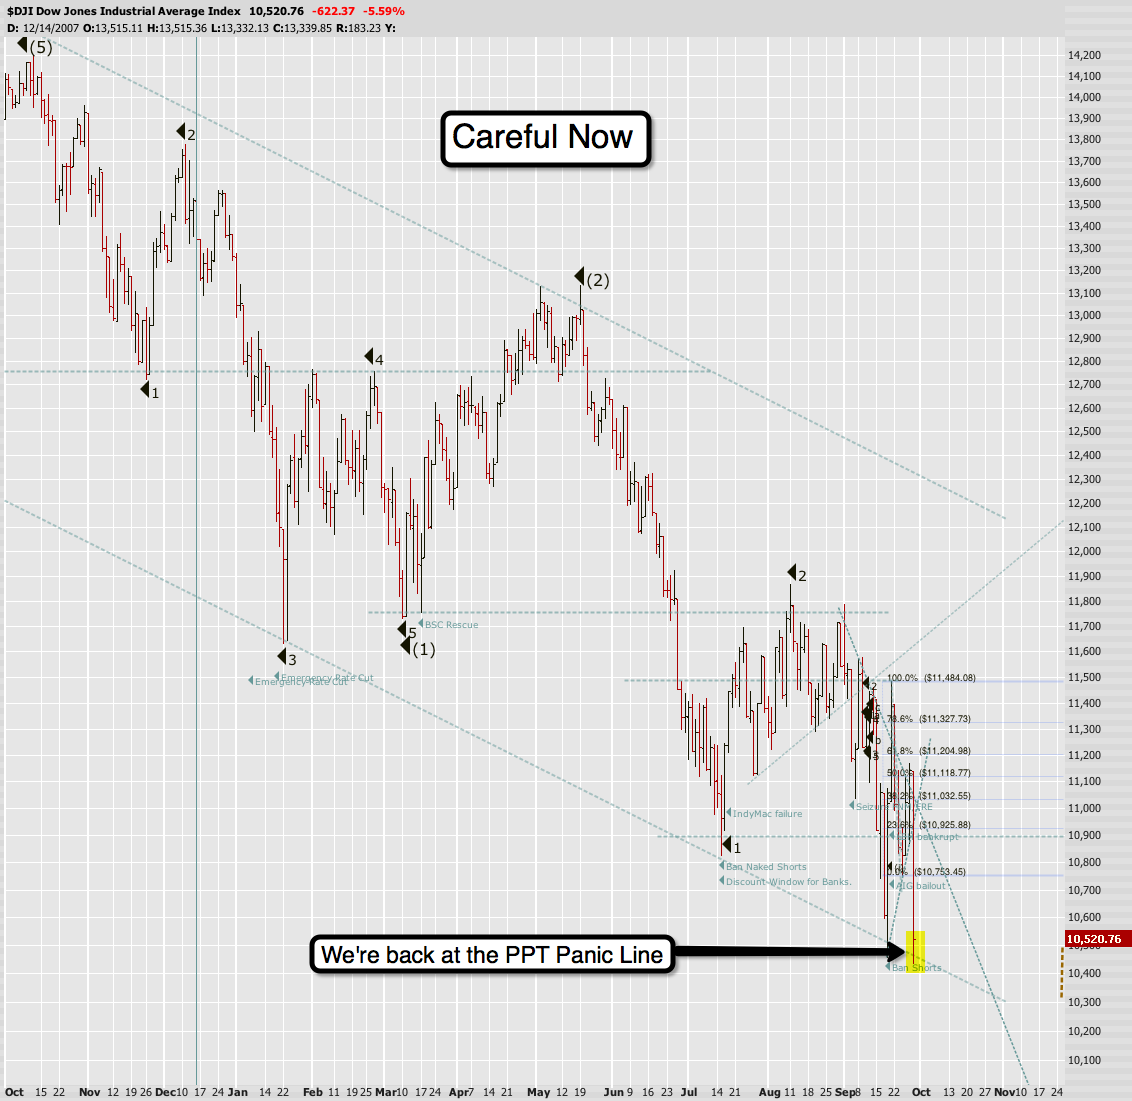
UPDATE 9:03am EDT: Berk sent me the following bit last night which I feel I should share with the rest of you:
As tempting as it is to jump in here, I would not be surprised to see this decline reversed mid-day, as one final blow to any aggressive short sellers.
If the markets are being rigged, this is the perfect opening to crush the people they are trying to kill.
Frankly, the thought has occurred to me of course and I discussed various scenarios with Berk yesterday afternoon. He’s making a great point here and this is a scenario I wouldn’t put past the PPT and its henchmen (and I have to admire their evil instincts frankly). So, please be aware, that buying puts at this stage is a HIGH RISK endeavor and that there is a great chance that you will lose the entire premium. There are no prisoners in this game as you have been made aware last Friday if you ever had any misconception to the contrary.
金币:
奖励:
热心:
注册时间:
2006-7-3

回复 使用道具 举报

 楼主| 发表于 2009-4-1 15:34 | 显示全部楼层
September 25th, 2008 1:51 pm Intraday Update 10 Comments

UPDATE 1:48pm EDT: I see the S&P futures (ESZ8) bouncing against resistance around 1224. My current take is that his will probably fail as the Yen is holding at around 0.9425. Day traders might be able to scalp a few points here in the futures - perhaps the YM from 1110 down towards 11070 or if you’re lucky to 11000 (doubtful though). This is not the time to buy options people - wait it out.
Update 1:54pm EDT: LOL - that didn’t take long - YM futures now at 11070
Update 1:57pm EDT: Some of you are short Gold and I just looked at the futures. From what I can gather - and remember things are fluid right now - it seems that we’re painting an {a}, {b}, {c}. I was holding some GLD calls this morning which I closed out as I think I can get a better entry. BTW the line up is NOT supposed to be a zigzag (of course), I just wanted to indicate where I expect resistance. This will most likely form a motive wave (i.e. a 5).
Gold futures seemingly painting an a,b,c.

UPATE 12:27pm EDT: DJI futures just touched 11000 - and bounced back up. If you took that day trade, you grabbed some easy profits. We’re in this channel between 11000 and 11125 right now and probably keep bouncing in between there unless some big news hits the wire.
UPDATE 2:45pm EDT: I grabbed some GILD puts about 20 minutes ago. Got a nice diagonal resistance line and my indicators are pointing down on this one. If you take this trade you will lose money and your wife will beat you with a pinroller.
Intra-Day Update: Twilight ZoneSeptember 25th, 2008 11:01 am Intraday Update 17 Comments

UPDATE 10:40am: The TNX is up and the Yen is bouncing off lower resistance around 0.947. That is both bullish for the markets, despite the bad earnings announcements by GE, weak durable goods, and of course lower unemployment (you’re next!). Again, don’t expect much resolution here until we get a final go out of Congress. There is NO direction in this market - it’s being kept at equilibrium right now: Bad enough to scare Congress into passing this bailout boondoggle (BaBoo), and good enough to encourage the bulltards to jump in and ‘buy the dip’.
Looking beyond today, the scenario that seems most probable right now is a market rally to about 11,400 on the DJI post-announcement of the BaBoo, lasting approximately until the 29th-2nd (which conveniently matches moontrader’s turning date). This time frame also ‘feels’ right intuitively, as this historic bailout of the financial sector on the shoulders of overextended tax payers facing a depression won’t stem economic Armageddon for more than a few days. Good times indeed - if you are an evil bear. And after what the PPT pulled last Friday, my evil meter has popped the scale.
To my nefarious minions I recommend to perhaps grab a small amount of long positions here and there, but don’t go crazy and ‘go all in’. Wait for it and ride the wave up when it comes. However, let me re-emphasize that the REAL MONEY will be in loading up on puts once this horsewash rally nears its peak. Mr. VIX will will have scaled back from alert level red to orange or perhaps even green. Option pricing will be a lot more reasonable as ‘risk’ has been greatly reduced. Remember that kicking a bull is a lot more fun when it comes unexpected. Let them have their little rally, after all we’re paying several Trillion Dollars for it. Keep it clean - I’ll check in later.
Cheers!

Tough Times…September 24th, 2008 8:09 pm Market Forecasts 30 Comments

Frustrations are rampant in the air here.  On both sides traders are getting more nervous and irritated.  As Mole stated earlier, these are typically the times when huge moves happen because EVERYONE is near the breaking point.  Once the move picks a direction, all the winners will be buying more while the sellers are unloading at any cost, effectively driving the markets further and harder in their move.
I know several people who have completely backed out of the markets right now.  Kind of hard not to, considering all the intervention.  Even if you are a bull, knowing the government is your “support” is hard to rely on.
That said, we remain in a pickle.  The markets are oversold on many timeframes from minutes to days depending on indicator, but we know that stocks can continue to be oversold.  We also know that some of the worst declines stem from drastically oversold conditions, especially when your president and presidential candidates are plastered ALL OVER public tv (no I don’t pay for cable).  Scare tactics produce drastic results, and we should keep that in mind for both the coming rally and subsequent decline.
It is time to step back and take a look at the bigger view in face of all this intervention.  Here is the $DJI on a 2 year chart showing my two new highest ranking wave counts.  The black count is me preference with the two divergences supporting its case that wave 1 of (3) bottomed last Thursday and the we likely face another sharp rally up.  The most likely targets are the range of 12100 to 11750.

The red count is the alternate right now in which 1-2s are continuing to unfold.  In this case there is a short term wave count where this could be applicable, but it doesn’t give me that “warm, fuzzy feeling.”  In its case the MACD and STO can be explained by saying the decline is still developing.  Until we push above 12250, I see no real need for a larger bullish count, so we maintain that the long term trend is, indeed, still down, despite what the politicians tell you.

People have noted the strength of the NQ here lately.  That strength is contained to the $NDX, rather than being spread out upon the broader $COMPQ.  The $COMPQ is looking pretty bearish, tracing out still-clean EW counts.  Pretty remarkable considering all the manipulation.  The alternate in this case would be $COMPQ hitting the high of an “A” wave on Friday and declining in a “B” wave right now.  This would likely lead to a strong rally in a “C” wave, looking for 2375.  That is quite a move, and it should show considerable strength early,  Look at the explosion in the MACD.  IF we get another strong leg up, the MACD should look quite similar to that.

I will leave you tonight with a simple website.  There is not much time, and it may do nothing in the end, but taking 5 minutes of your time to fill out the required information, IMO, can not hurt.  Pass it on to those you know and love.  Make sure your families know they will be footing around $10K per household to bail out people like Dick Fuld who made $0.5Billion on SELLING LEH stock THIS YEAR!!!  Some people need to learn.
I have a feeling it will be an “active” day.  Make sure you are well prepared for some strong action in one way or another.
votenobailout.org
Skål!

« Older Entries
Newer Entries
金币:
奖励:
热心:
注册时间:
2006-7-3

回复 使用道具 举报

 楼主| 发表于 2009-4-1 15:36 | 显示全部楼层
September 24th, 2008 10:13 am Intraday Update 41 Comments

UPDATE 1:06pm EDT. Today’s tape is like watching paint dry. Something’s gonna break either way. The Yen is moving ALONG with the averages, so no clear indication as to what’s happening. The TNX is up a little but it seems the bond traders are sitting and waiting for direction. Be careful out there - this market could pop either way any second now.
UPDATE 1:40pm: We seem to be breaking out of a channel on the DJI. I would probably start hedging here or perhaps cut some of your short positions:

Something I’ve noticed today is that the usual inverse indicators like the Yen or TNX are inconclusive or lag behind. So price action is king as usual and all we can rely on at this point. However, having said that, as I was watching the Yen drop I realized that the averages kind of stayed flat and didn’t give much back, in particular the NQ futures. So, in my mind this market WANTS to pop right now and bears should be extremely careful out there. If things continue in this fashion and if we break the next pivot at 1686 with confidence I might grab some GOOG, BIDU, and perhaps some CME calls.
For the record: This market is REALLY starting to get on my nerves, which might also be an indicator that a big move is about to happen. It’s pretty clear that day traders are dominating the action right now, as we are bouncing between pivot points. Due to all those sideways tape my frustration level is reaching a peak, and I’m sure I’m not alone. These are PRECISELY the kind of times when big moves happen. Just when you decided to step on the sidelines. Remember, the bus moves fastest once everyone got off. Having said that however, there is no harm in going into cash. Once we break there will be plenty of upside (or downside) to play with.
金币:
奖励:
热心:
注册时间:
2006-7-3

回复 使用道具 举报

 楼主| 发表于 2009-4-1 15:36 | 显示全部楼层
September 22nd, 2008 10:32 pm Market Forecasts 40 Comments

I’m filling in for Berk tonight who’s out working on his devious pet project of genetically cloning recently obtained mammoth DNA with that of a black bear (hence market domination).  So it’s going to be a quick one since I’m not receiving enough chocolate bribes as of late.

Today’s tape was a triumph for the bears to say the least, but I’m sure by now you’ve been exposed to much fanfare on that front. A 300+ drop on the DJI after massive bailouts and a limited ban on short selling. How’s that working out for you? Not so good it seems…
Bulls got spanked today.

But before you leeches pop your dusty bottle of Cristal I need to call for extreme caution as there is still the potential for a bullish reversal on all fronts. Today’s tape leaves the door open for the {a},{b},{c} scenario I outlined yesterday. We most likely will see some clarification tomorrow. Right now my money is on the bearish case as the breadth closed at 13.4:1 negative (of course that could indicate we’re oversold as well). Not bad for a day’s work, but I’m sure the PPT gnomes are sticking poisonous darts into their life size voodoo-bear-doll as you’re reading this.
Can you say - goodbye carry trade?

The Yen/market correlation is still in full force I’m happy to say, although the TNX wasn’t playing ball for most of the day but then caught up towards the close. Maybe the bond holders didn’t know what to make of all this - aren’t they supposed to be the ’smart money’? Anyway, watch the Yen boys and girls - Yen up = market getting hammered and the inverse.
Dollar getting manhandled.

The Dollar filed a sexual harassment suit late today as it is getting sick of taking it up the rear from the PPT. I actually expected a bit of a bounce here, but it seems the Chinese, Japanese, and Russians are finally realizing that the jig is up and are slowly closing out their treasury holdings (if they are smart - and they usually are). This of course is good for the bears and if the Dollar drops through about 74 the bullish scenario for the Dollar is completely shot to hell. That would be a crowning moment for us bears, as a buck in bear mode would do nothing less than pull the carpet from underneath the market.
Gold could go either way.

My apologies for being so ambiguous on Gold as well, but things could play out either way here. I’m not in Gold right now but went short PAAS (Silver related) after closing out a long position. I’m not fully convinced Silver is going to drop much further but I hoped to scrape a few points until tomorrow when we most likely will get some clarification.
That’s all I got for tonight. If you’re massively delta negative a little hedge tomorrow after the open might be good medicine. The bears are NOT out of the woods yet, which I realize is not a good analogy in this very context. Keep your exposure limited until we see some clarification. Once we’re greenlighting the bearish case we expect to go medieval on FSLR, BIDU, RIMM, DECK, MA, XL, GOOG, XLU, and many other victims.
Special props to AAPL which made me a pretty penny. I posted a chart early in the morning at the slope - who took that trade and smiles tonight?
I leave you with this:

Cheers!
金币:
奖励:
热心:
注册时间:
2006-7-3

回复 使用道具 举报

 楼主| 发表于 2009-4-1 15:37 | 显示全部楼层
September 20th, 2008 10:15 pm Market Forecasts 95 Comments

“You have a choice to make. You take the blue pill, the story ends, you wake up in your bed, and you believe whatever you want to believe. You take the red pill, you stay in Wonderland, and I show you how deep the rabbit hole goes.
Remember…. all I’m offering is the truth, nothing more.”
The red pill? Alright, grab yourself a beverage - this is going to take us a bit of time. Let’s take a brief stroll down memory lane, courtesy of our friends over at ‘the big picture‘. Just so happens that he tape of the last two days represents the strongest 2-day rally since 1929:
Nice 2-day rallies! What a bullish sign they surely thought in 1929.

1929 - that year sounds mighty familiar, doesn’t it? Now let’s see how those bullish monster rallies worked out for those traders of yore a little further down the line:
Ooops - 86% sell-off.

Not so good it seems. Perhaps there is truth to the notion that bear markets produce the sharpest bull rallies. Unless of course you took the blue pill and you’re convinced that history never repeats itself.
Of course one could say that they didn’t have the PPT at hand back then and that the new short selling ban will surely change things for the better. After all, it’s those evil short sellers (mainly Berk, Tim Knight, and yours truly) who caused the market to drop in the first place, right? And now that it’s fixed the market is bound to surge to new highs! Good times are afoot!
Well, if you really think that I’ll have to burst your bubble. And this time I don’t have to go back 81 years to make my point. Here’s a 2008 chart of the Karachi 100 (Pakistan):
Effect of short selling ban: zilch.

Some things to keep in mind:
  • The ban, initially for 30-days, is still in place (big surprise).
  • The limits/collars on trading were set at -1% and +10% (all trading halted for the day when stocks go down 1% or up 10%).
  • Those collars were taken off on July 14.
Could it be that banning short selling is not such a great idea after all? Sure looks like a possibility. Could it be that both PPT and SEC officials were unaware of the ineffectiveness of a similar ban in Pakistan? Very doubtful. Could it be that the SEC just shot itself and the equity markets in the foot and that royally? Most def.
Naturally, if you were in delta negative in the last two days this may be of little consolation to you, and what you really care about is how to avoid getting trapped like Bambi in the headlights again going forward. That of course is the tricky part - obviously trading options is tough enough to begin with - most folks wash out even during the good times. Throw in arbitrary government interventions, federal bailouts, and the occasional market rules change and the task becomes almost impossible.
Now, you’ve probably heard of this expression: Fool me once, shame on you - fool me twice, shame on me!
Sounds good in theory, but in order to not fall into this trap again we need a little intel. As you know, here at Evil Speculator we aspire to reduce the noise and offer high probabilities in market trends. We don’t have a crystal ball, otherwise we would have gone long on Thursday around 1:00pm (arrrgghhh - okay, give me a second….. alright… I’m good….). However, what we DO have is an excess amount of IQ points, help from our legions of nefarious minions, plus an unquenchable desire to beat the PPT at its own game. To that end the answer may lie in our charts - if we just would bother to look in the right place. Lo and behold, a hint was revealed to us this weekend by an esteemed fellow trader going by the mythical avatar of MarketMinotaur:
There seems to be a pattern to interventions.

The guy seems to not just be hung like a horse, he also appears to bring some fine skillz to the table. Unless of course he stole it from somebody else, in which case we respect him even more. I took the liberty to refine his chart a bit so that the pattern of interventions is more apparent. If you draw a simple channel connecting the tops/bottoms of the last year it becomes clear to even the mentally challenged among you that the lower channel line appears to be the psychological panic threshold for the PPT.
30-year treasury also seems to confirm the pattern.

As I’m not completely useless around here I have also been able to correlate this with the yields in the 30-year treasury, which seems to confirm the same pattern. It’s not as clean and a bit more relativistic, but in combination with the price channel appears to give us a good indication as to when it may be time to ‘pull out’.
However, as of right now most of us are probably licking our wounds and wondering what’ll happen next. Will we continue to rally or are we going to drop from here and it’s time to load up on puts? This is where I need to caution my impatient disciples of doom - right now is not the time to jump back into the market. First up we need to make sure that options will be reasonably priced again and in that context I’d like to share some great news Tom Sosnoff from TOS sent me today:
Statement of SEC Division of Trading and Markets
FOR IMMEDIATE RELEASE
2008-213
Washington, D.C., Sept. 19, 2008 — The Securities and Exchange Commission’s Division of Trading and Markets today issued the following statement:
“The Commission staff is recommending to the Commission a modification to its order prohibiting short selling in securities of specified financial firms. This modification would extend, for the life of the order, the exemption for hedging activities by exchange and over-the-counter market makers in derivatives on the securities covered by the order.”

It’s good to know we’ll actually have an option market to return to come Monday - one down. Secondly, volatility is still mighty high and unless Mr. VIX drops below 26 buying puts is not recommended as you’re giving up a lot of potential profit (I guess you could be selling calls if you eat your breakfast cereal with a razor blade while jumping out of a plane). Thirdly, it seems that we once again find ourselves at another fork in the road:
SPX at fork in the road (again).

I think the chart makes things pretty clear. The sticking point is that little correction we painted Friday after the quick spike upwards. We should know fairly soon as the wave count really does not leave much wiggle room here. We either go up straight from here and start dropping. The odds of either scenario are about 50/50 - yes, I know - not what you want to hear. But if you ask me, I would actually prefer the upwards scenario. No, I haven’t skipped my meds - no worries. First, based on the tape of the last few days it would make the most sense. Second, we would get the VIX back down to below 25 or even lower (i.e. cheap puts) and we might even get the McClellan oscillator back into overbought territory (45 and above). It would take pressure of the Feds to do anything stupid and produce more wiggle room for us bears to ride out our puts before we get near that ‘panic line’ shown above. So, we might actually dip into some calls tomorrow if things start pushing up after the open. Yes, Evil Speculator might actually turn bullish - we choose not to fight the trend.
Dollar ready to rally again soon.

Adding weight to the bullish scenario is the probability that the Dollar should soon have completed its corrective a,b,c wave and switch back into rally mode. A rising buck should give the permabulls additional mojo, as it on the surface supports their position that ‘the worst is over’ and that the U.S. economy is again ’strengthening’. It would also serve the political agenda of the Republican party (I’m not taking sides here - just an observation).
I won’t comment on Gold or Silver today as both are largely dependent on which way the market is going to flip. Wouldn’t be a great entry for positions here anyway and again - I don’t like the VIX where it’s at right now.
That’s all I have in me today. I think that this should prepare you sufficiently for what’s to come next week and beyond. I have a few more aces up my sleeve which I will share with you leeches when I’m good and ready. There are a few more indicators I’m working on which seem to give us a decent idea of when the market is ready to dip back down - before it happens of course. I’m working with the good folks at TOS to add a few necessary exotic feeds in order to produce a line chart I can share in future postings.
A final comment: Don’t get too eager to jump back in now and commit yourself fully right away - even once the market picks a direction I recommend you stay hedged if possible. Market conditions are fluid right now and our friends at the PPT obviously have pulled out all the stops before the November election - which is also why I actually favor the bullish scenario right now - it would be a lot easier to trade. Hey, if you can’t beat ‘em - join ‘em. Don’t worry - we’ll get our sweet revenge soon enough.
May the market Gods have mercy on your portfolio.
Cheers!
金币:
奖励:
热心:
注册时间:
2006-7-3

回复 使用道具 举报

 楼主| 发表于 2009-4-1 15:38 | 显示全部楼层
September 18th, 2008 8:57 pm Uncategorized 15 Comments

What a bounce that was.  What does the 400 point up day mean in context of all the government intervention we have seen lately? you may ask.  To me, it assures me that we are in fact in a wave 3 decline.  First, ask yourself when the last time you have seem back to back 400 point moves in the $INDU.  It’s been a while right?  And we all know that these large volatile moves are most likely to occur in down trends.  So far so good right?
Mole stepped out to take his woman to the beach tonight.  So I am covering with a short little update.  We were cautious that a bounce should be nearing, but I think very few of us expected the 6% reversal that we got.  I sure didn’t (4% maybe, but 6% from lows to highs is quite a move for an INDEX).  Seriously, when did we become China or Russia?
One target area in the $INDU is being tested right now.  That would be the 11K range (around 11050).  There are some additional resistance points that should be discussed also.  First would be the low of 9/11, as this would provide an interesting wrinkle in the wave count. This first critical level is 11098.  If this level is breached, we would most likely have put yet another 1-2, which is starting to get hard to believe, even for me.  There is a range around 11200 that is another critical resistance level.

A number of indicators have flashed a very bullish sign.  This includes a BB reversal on the indexes, a issued buy signal on the $VIX (3 now), as well as a turn up in almost any oversold oscillator.  In the face of a 400 point up day, the bullish potential here should be considered.  A number of things say a larger bounce could be coming.  We will just have to see where we go from here.

The $NYHL crossed the 3 day average, but until we close in on the 5 day, we won’t believe this rally has “real” legs.   As you can see, the $NYHL has been in lower territory recently, and we would expect to see it there again.

Here comes the government news and the futures are shooting higher.  I will post what I have here and perhaps post a quickie evening or morning update with our thoughts.
Skål!
金币:
奖励:
热心:
注册时间:
2006-7-3

回复 使用道具 举报

 楼主| 发表于 2009-4-1 15:39 | 显示全部楼层
September 18th, 2008 12:14 am Market Forecasts 29 Comments

Another B-E-A-U-Tiful day at the markets.  I’d like to remind everyone that the Fed calls TOPS not bottoms (at their meetings, special “emergency” intervention is a different story.  Yesterday, the markets rallied to an artificial top, leaving the Fed right yet again, glad I bought some choice gems like GOOG, BIDU, MA, CME, and the list goes on, but let me just cut to the chase.
Markets closed down hard across the board.  Breadth was dreadfully negative, volume was quite strong, and the bull rally got crushed in the last hour.  Did you see those margin calls flying in as the $INDU lost 5 points a minute for the next hour, falling nearly 3%.  What a close to the day.  Finally, the $INDU busted through the 50% retracement from 02-08, next stop is 9900, the 38.2%.

And the $INDU…

The $COMPQ, not to be put to shame, fell nearly 5% today.  What a week this has turned out to be, and it is not done yet.  However, we should be wary of a modest rally due to its oversold nature.  Not that it can’t get worse, and it often times does, but this is expiry, and strange lots of things have been acting up lately.  Notice the MACD resistance on the 2 lines.  We could bounce, we could breach, and we should know soon.

The $VIX was “up” again today, showing that some bulls are finally getting scared.  However, many will tell you, and it is a valid point, that the $VIX is approaching a resistance.  It is, and it could pull back, but I hardly think that means we will get a sustained rally, at least not at this point.  However, the $VXO was exhibiting some odd behavior.  Maybe Beanie is right….

At this point, I can surely say the trend is down, and that we should continue to take of another 7%+ in wave iii, and 20%-30%, maybe more, before wave 3 in the $INDU (wave labels as marked on chart).  I hope you already have an established short position.  If not, please use any rallies we may get to add to your positions.  Be sure to take profits and/or hedge when we reach extreme oversold conditions.  The government has been playing a lot of games, and wave count or not, the market action have been dicey.  I will leave you tonight with 2 charts.  The first is that big h/s top in $INDU I had posted a long time back, and sent to Dave even earlier.  The next is the updated chart.  So far so good!!

And the update…

Skål!
« Older Entries
Newer Entries
金币:
奖励:
热心:
注册时间:
2006-7-3

回复 使用道具 举报

 楼主| 发表于 2009-4-1 15:41 | 显示全部楼层
September 16th, 2008 5:30 pm Market Forecasts 67 Comments

Are we having fun yet? I checked in at the slope various times today and from what I was able to gather plenty of bears were getting mghty nervous there. I have to admit that I didn’t expect this rally after the Fed kept their benchmark rate at 2%. As a matter of fact I was hedged quite nicely and dumped my QQQQ and IWM calls a minute or two after the announcement. But then again - it’s expiration week and the market makers are having fun. Nothing like a end of day short squeeze after all.
Well, some of you leeches will be surprised to hear that I was smiling all the way up despite my account taking a battering towards the close. Berk and I actually added a few puts here and there just to spice things up. Why would we do such a thing? Mainly because we’re demented but also because we don’t believe this rally for a second. I’m not going to regurgitate the fundamental reasons as to why this market is doomed, this is getting pretty old and I hate to sound like a broken record. So, if you’re looking for some lamenting on why the bulls are full of crap, please go somewhere else. I for one prefer to stick with the facts, which  revealed themselves in a tea leaf reading I had my local gypsy perform for me today (she also gives great lap dances). This is where we are:
SPX continuing to produce a series of 1,2.

Looking at the wave count I’m actually getting a bit giddy, as the probabilities point towards yet another 1,2 series, at this point at the submicro degree. I first thought that we had painted a 3,4 but then realized that we closed above the bottom of {1} of subminuette ii. Thus, unless I need to adjust my drug dosages yet again, it seems that we are tracing out YET another 1,2. Which would indicate that we probably will test the area around 1220 tomorrow and then roll over.
If we keep pushing up beyond 1220 I would probably protect myself with a hedge. Again, as mentioned this morning, Berk and I have suspended our stops as we don’t enjoy keep getting kicked off the horse just before a major sprint. The name of the game here remains to accumulate puts (or short contracts) in anticipation of the continued trend down. Nothing in today’s tape indicates that we are not in wave 3. Breadth in the SPX closed at buyers leading the sellers 2:1, the NDX was most stubborn at 3:1 positive, while the INDU decided to close at a measly 1.5:1 positive. Nothing to write home about when compared with the massive negative breadth we recorded yesterday. Let’s also not forget that the VIX is still hovering around 30 - I actually expect it to be a LOT higher before we see a ‘real’ consolidation rally. However, if we keep rallying tomorrow and into Thursday we would of course have to re-adjust our assessment, but as of right now everything is in line with our initial analysis.
Gold at fork in the road right now.

I’m a bit suspicious about the precious metals frankly as neither moved much either way today. Gold closed right at the 50% fib line after going sideways all day, giving me little indication as to what may come next. I’m still long Silver, which actually decided to drop a little but I’m starting to look for a reason to exit. There is a possibility that we are not done yet with completion of wave 3 and that we might indeed see $720 in Gold and $9 in Silver. It is very much possible that this might have been yet another bull trap and that we may see a massive drop in a very short order. Tonight’s action might point us in the right direction, until then I will hold my relatively small PAAS and DBS puts. However, sensing any weakness I would have no compunction about turning the ship around here. Sorry about the 50/50 vote - I hate having to do this, but I unless I see a sign here I remain on the fence.
Dollar in consolidation mode.

The (now not so) mighty Dollar appears to be tracing out a standard a,b,c corrective wave. Nothing much to say here. I really doubt that we’re done going down at this point and would expect an ensuing drop to lead us to the 77.75 area - just enough of a ‘token consolidation’ before central banks worldwide continue to push our currency higher in this pre-election rally. Unless of course the Chinese aren’t so happy about the ‘backdoor bailouts’ planned for AIG and the remaining investment banks (three at last count). There was a major sell off of treasuries abroad on Monday and Tuesday - perhaps that was the proverbial warning shot across the bow. Keep bailing out everyone and we pull the plug. Very interesting dynamics at work and plenty of conspiracy theories. I however stick with the chart and so far the pattern looks pretty standard. The weakness in the Dollar shall pass fairly soon.
You guys know the drill I take it - use your remaining dry powder to sell the rips. In particular if we see signs of a drop tomorrow. However, be warned - it’s expiration week and those market makers just LOVE to squeeze the bulls and bears alike. Especially if you’re holding front month options (I have none at this point) - if you’re not ITM by tomorrow afternoon I would recommend cashing out of them, as Thursday/Friday of expiration weeks are notoriously flat. Of course anything can happen in this market if we get yet another news tidbit about some kind of failure or bailout.
Cheers!
金币:
奖励:
热心:
注册时间:
2006-7-3

回复 使用道具 举报

 楼主| 发表于 2009-4-1 15:42 | 显示全部楼层
September 15th, 2008 10:03 pm Market Forecasts 78 Comments

It appears that the day we have been waiting patiently for so long is finally here.  Not that this event is going to be a single day drop by any means.  Rather, my implication is that the long awaited wave 3 of 3 is finally underway.
Though it is great to be watching the futures ticking down somewhere between 1% and 1.5% while I type, when the $VIX closed up 23%.  Speaking of the $VIX, it appears people are beginning to get scared.  After two failed confirmed sell signals as we expect in a bear market, we push outside yet again.  Coincidentally, we also crossed the 50% line on by channel, signifying that the market has indeed entered an extreme selling phase.  Target resistance is around 37 unless we have a triangle break out in which we would be looking for about 41 for a target.

What is funny, (in a sick, sadistic way) is that all of the major institutions that are or have gone under, and well-established, long lived companies.  I mean BSC was over 100, LEH is 158 years old, MER is 90+, FNM was created in the 1930’s making it at least 70.  Now I have never witnessed an economic depression first hand (except the events of the past 2 years), but MY opinion is that when these elders of our financial markets are dropping off like flies, we have gotten ourselves into quite a mess.  What really sucks is that I can no longer trade these companies.  Back 6-9 months ago, ALL I was trading was MER, LEH, BSC, FNM, and FRE.  Now, all of these companies are going under, which leaves me with what, C and XL to have fun with in the financial sector.
Okay.  On to the markets.  They remain in an interesting situation, given tomorrow’s fed meeting.  I expect some decent resistance around our July and/or March lows, which are spitting distance from where we stand.   Here is the $COMPQ.  Not much new to report aside from the 3.6% drop.

The $SPX needs to be talked about tonight, as it has already breached all prior lows our our decline.  With an almost 5% drop today, we could say that it is our leader at the moment.  And we know that when investors move to riskier stocks (i.e. TECH) a market bottom is not near.  We are lower than we have been in 3 years on the $SPX, and I see a small resistance cluster around 1180, but have more evidence of a bounce towards 1170-1165.  Those target ranges hardly suggest the bottom to wave (iii) (as labeled on our chart), merely the next logical bump in the road.  Remember that a wave 3 is unfolding at FIVE degrees of trend right now.  That is huge!!  Which brings me to my next point.

Will cutting another .50 basis points really make YOU feel better?  Does that bandage fix your severed leg?  So the question is how the market will react.  The fed will cause market activity to lull into 2:15 EDT, and I wouldn’t be surprised to see us hit these lows early and churn around them until then.  I am fond of saying that the fed calls tops not bottoms, and I believe that will be the case.

There is really not much else to post despite our 500 point drop.  All of our indicators are supporting the bearish case, and we have little reason to believe that Fed action will do any more than forestall the inevitable…if that.
We really hope that you have been playing and getting good entries on our recommended stocks.  There may not be a whole lot of opportunities to reload on positions after the Fed and expiry this week, so make sure you do reload diligently.  I am happy the day went as it did, and I can sleep peacefully knowing that we are truly in wave 3 now.
Skål!
金币:
奖励:
热心:
注册时间:
2006-7-3

回复 使用道具 举报

 楼主| 发表于 2009-4-1 15:43 | 显示全部楼层
September 13th, 2008 8:21 pm Market Forecasts 107 Comments

What a week! I hope some of you evildoers were able to bank some coin - let me just say that Mrs. Evil was very pleased and even forgot to administer the weekly rolling pin treatment I receive when reporting my profit stats. Admittedly Thursday and Friday were less fun, but believe me when I tell you that those consolidations were necessary and GOOD for the bearish case. Alright, I’ve been working most of my Saturday pouring over my charts as I couldn’t be more excited. Let’s dig right in:
SPX tracing out a series of 2s.

It’s entirely possible that I’ll have to print and frame this chart a week or two from now, as it may be the moment we have all been waiting for. Judging by the wave count it seems that the SPX has been tracing out a continuing progression of smaller degree 1,2 waves. Now what is supposed to follow such a series? You guessed it - a jumbo 3 wave. Let’s also take a look at where we are from a TA prospective. Berk and I actually expected there to be a push towards 1260 on Friday (remember the previous low of (i) of 3). However, we twice bounced off of 1255, once in overnight trading and once towards the end of the NYSE trading day. We can only guess that some institutionals were stepping in here with some selling action. In any case 1260 does represent strong resistance which is also double enforced by the diagonal resistance line I am showing on the chart above. This should provide extra ‘protection’ around 1262 on Monday. If that one doesn’t hold I’m eying 1275, the extreme of (ii) of 3 as the next support line.
It’s sometimes tough to spot some of those vertical resistance lines but there is actually an easy way of finding them - something esoteric called the point & figure chart:
P&F clearly shows support/resistance zones.

Don’t worry if you don’t know how to read P&F charts - they are not chronological in nature and instead consist of columns of X’s and O’s that represent filtered price movements over time. If you want to know more about P&F charts point your browser here for a great tutorial. The point I’m trying to make is that 1260-1265 clearly represents an inflection point that I would prefer not to cross.
If we do bounce off the 1260 area, and at this moment this is my most probable scenario, it should be a beauty to behold. This drop would be massive and would render Tuesday’s tape puny in comparison.
Serg's Correlation Chart.

Here is a chart Serg, one of our favorite visitors, showed me today and which he graciously permitted me to share with the rest of you. He’s a fractal fanatic and seems to have a knack for finding correlations not only within charts but across markets. Shown here is a comparison between the FXI (China Xinhua index) and the SPX. Can you see what’s going on? It seems that the FXI is about 2.5 weeks ahead of the SPX and thus far the correlation appears to hold just nicely. Looking at what happened next over in the FXI after a large marubozu candle lends additional weight to our case. That’s of course assuming we are indeed following the same path of destruction, in which case the FXI represents a nice road map.
Gold either dropping back to 720 or done with wave 5.

Gold decided to throw me a little curve ball on Friday. I expected it to continue its drop to 720 (and maybe below) but it might have concluded wave 3 and could be on its way to consolidate back up to the 875 region. However, my money (literally) is still on a continuation of the current wave pattern down to 720. If you are still holding GLD or GDX puts I would watch ZGZ8 like a hawk Sunday night and early Monday morning. If we see buyers push gold even higher I’d probably play it safe and close out my puts. Currently the spot price on kitko is 763.70 (Prophet chart shows incorrect data), so it dropped a little bit after nearing 770 Friday afternoon.
Silver ready to rall-aey!!

Long John Silver - all I have to say here. I really have doubts we see more downside in Silver here for the moment. Even IF we’ve got some nice psychological resistance around the $10 mark (it did touch 10.25 on Friday but bounced back). This could be a wonderful play all the way up to about $15. Don’t miss out on that - let me propose you grab some DBS or maybe some PAAS.
Remember that next week is expiration week, which will present us with additional volatility, pinning action, market maker stunts, etc. On top of that the FOMC meeting is on Tuesday and who knows what those boys are cooking up right now as you’re reading this. So, it’s going to get a bit crazy I’m sure - and don’t get caught with too much negative delta in your portfolio. However, at the same token, if all signs seem to indicate the potential of an imminent drop as outline above, let me point out a risky but possibly extremely profitable trade scenario (are those ever ’safe’?). Let me also point out that unless you are an option pro and have been trading the markets for at least several years, don’t even think of doing what I’m about to describe.
We might find ourselves in a situation where the market decides to give way and, being the greedy and evil speculator you pride yourself to be, you might want to squeeze maximum profits out of your blood money. As we just happen to enter expiration week you also understand that OTM options are going to become extremely cheap as there is almost no remaining extrinsic value (e.g. time value). Now, let’s just assume for a second the market slips on a big banana peel (perish the thought) and you just happen to have loaded up on massive amounts of ‘junk puts’ - perhaps 2 or 3 strikes OTM with only a few days left before expiration, maybe even further out if you feel adventurous. IF those puts suddenly find themselves ITM or perhaps even DITM the profit potential would be something to boast and taunt your fellow trading buddies for years to come.
Personally, I recommend you do NOT do this, just so we understand each other. But I do know a trader or two who might try a stunt like that, assuming the stars are properly aligned. Of course these guys are completely nuts, which you need to be to even consider doing this. For the rest of you guys out there - stick with Oct or Nov options.
金币:
奖励:
热心:
注册时间:
2006-7-3

回复 使用道具 举报

 楼主| 发表于 2009-4-1 15:43 | 显示全部楼层
September 12th, 2008 4:32 pm Intraday Update, Market News 63 Comments

Things are about to get interesting - in particular when it comes to the Dollar. If you take a look at the Dollar index today you’ll see a sudden drop:
Dollar dropping hard for the first time in 8 weeks.

So, what’s going on? Well, we expected the 80 range to be the Dollar’s interim top for a while now, as the wave count requires a long needed consolidation in the pattern. However, I have been pretty verbose about my position that the Dollar has been manipulated by the ECB, the Swiss Bank, the BOC, etc - and the question is why are we dropping now?
Bloomberg is giving us the (btw, I love Bloomberg but they just relay the info they get themselves):
Dollar Falls Most Versus Euro Since 2006 on Pared Haven Demand Sept. 12 (Bloomberg) — The dollar fell the most against the euro since January 2006, pushing it down from a one-year high, on reduced demand for the greenback as a haven.
Duh - but why is there suddenly reduced demand? What’s really going on? Well, first up you need to understand that FOREX traders are among the best traders out there - they don’t get emotional and they know how to play the game. If we small players were up against equity traders of that caliber we’d be toast within a week. So, for them to start dumping the Dollar right now happens for a reason.
Leave it up to Mole to connect the dots - although I had to go all the way to
China may cut its dollar holdings - CICC
China, which holds a fifth of its currency reserves in Fannie Mae and Freddie Mac debt, may cut the portion held in US dollars, according to China International Capital Corp (CICC), one of the nation’s biggest investment banks.
The US government this week seized control of the two mortgage-finance companies, which account for almost half of the home-loan market in the world’s biggest economy, to prevent defaults from crippling them. China holds up to $400 billion in the two firms’ debt, CICC Chief Economist Ha Jiming said in a report Thursday.
“The crisis has made Chinese officials realize it’s a bad idea to put all their eggs in one basket,” wrote Hong Kong-based Ha. “This will likely lead to greater diversification of foreign exchange reserve investments.”
Now let’s correlate this with  I saw today which incidentally disappeared within 15 minutes, this time again on Bloomberg:
Paulson Adamant No Money for Lehman, Fed Against It (Update1)
Treasury Secretary Henry Paulson is adamantly opposed to using government funds to aid Lehman Brothers Holdings Inc., and Federal Reserve officials are inclined to agree.
A person familiar with Paulson’s thinking said Wall Street has been aware of Lehman’s troubles for a long time and had time to prepare for any crisis at the company. The access Lehman has to loans from the central bank will allow an orderly process, the person said. Fed officials are aligned with the Treasury and have a strong predisposition against use of government money.
So, now we know what’s really going on. It’s not that the PPT suddenly has seen the light. The Chinese are threatening to finally pull the plug if their considerable Dollar holdings should be exposed to further inflationary action by the Feds. That would be a BAD thing - trust me. If that happens you can kiss the Dollar good-bye. And we already know from the FNM/FRE debacle that the Feds have no compunction about handing U.S. equity holders the shaft whilst protecting the interests of foreign debt holders like the Chinese, the Russians, the Japanese, etc.
THAT is why LEH won’t be handed to GS or BAC on a silver platter paired with a juicy Fed cash injection or some kind of creative asset swap for treasuries: The Chinese had enough and are threatening to start dumping Dollar assets if the Feds continue to running their printing presses whilst bailing out every investment bank in trouble (which is most of them). The market has been ‘pricing in’ bank failures at this point (just look at the last few days of market tape) and the Feds are now forced to draw a line in the sand. They would have never done this on their own account, that’s for sure.
金币:
奖励:
热心:
注册时间:
2006-7-3

回复 使用道具 举报

 楼主| 发表于 2009-4-1 15:44 | 显示全部楼层
September 12th, 2008 12:12 am Market Forecasts 25 Comments

I am going to keep it short and sweet tonight.  Not just because the market mistress beat me for my glee earlier, but because I just got back from dinner, and I am needing some sleep before tomorrow.
I would like to give a shout out to Beanie (yes Beanie) for giving FSLR the kiss of death yesterday.  Other recomendations gave a nice rally today, allowing for some nice entries for the next move down (likely tomorrow).  Why tomorrow, because we went up today (and yesterday), and we can’t seem to go the same way for more than a day or two.  Aside from that, breadth was strong and volume was modest.  The $NDX took a much needed breather, rallying 2% today.  The maximum upside I would expect here is 1800.  Not only is this a nice round number, but would also retest the July closing lows, as well as a 4th of 3rd retracement for a typical wave 4.

What is interesting about today’s action is the NYSE new highs/lows.  We looked at this the other day, and that rally actually cause an upward movement in the 3 MA.  Here is the chart from a few days back.  I mentioned that the H/L line was positive on that day.  Check out the move on the H/L line today, with a 1.5% - 2% rally across the board.

This is today!!

One final piece of evidence that I am going to lay out tonight is neutral.  We got our second confirmed $VIX buy signal of THE WEEK!!  Wow.  Normally, I would consider this very bearish action, especially since we have not even broken our July lows on most indexes.  But the overhead resistance could be just what the $VIX needs to bounce back down while the market rallies.

So this is what the $SPX looks like today.  On a small timeframe, we are overbought.  We are tracing out a corrective Elliott pattern, whether it is just another (smaller) 1-2 or a part of a slightly larger 2 is yet to be seen.  1260 is the level everyone is watching in the $SPX, and at 11 points away, I think we have our target for tomorrow morning.  The big question is what we do from there?  I saw we fall, but I haven’t been able to get 3 days going yet.  So either sooner, or later, unless we breach our 9/8 highs and continue to rally up through 1300, we can maintain that the current trend is down, and as we have been saying, whipsaw rallies provide a nice opportunity to get short.

I am setting the short term trend indicator back to mixed, becuase I am sick of getting whipsawed.   We will revert is back to down when we see some continued selling pressure.
Skål!
金币:
奖励:
热心:
注册时间:
2006-7-3

回复 使用道具 举报

 楼主| 发表于 2009-4-1 15:45 | 显示全部楼层
September 10th, 2008 10:59 pm Market Forecasts 44 Comments

Yes, today sucked - especially after the wild ride we bears enjoyed yesterday. Did I take a hit to my portfolio? Absolutely! Did it wipe out yesterday’s massive gains? Not by a long shot! Did I back up the truck and loaded up on more puts in tech and financials? You better believe it.
Nevertheless, it was a bit mind numbing seeing things go against us yet another time. After all, the bears have truly paid their dues in the last 6 weeks and the very least this market could do is to present us with a measly week or two of down days. Well, as we all learned today, the market can be a cruel mistress as she made us sweat through yet another sucker rally. Reminds me back in the days when I was still dating - all those hoops you had to jump through before she finally put out.
Anyway, as I am not just evil but also inquisitive by nature I of course wanted to know why the heck we were pushing up in the first place. Was it something in the news? Not really - no banks were wiped out today, the PPT didn’t come to anyone’s rescue, no cooked reports either, the tooth fairy had the day off, nada. The treasury yield was mixed - up throughout the day but nothing major; it comfortably hung around below 3.7% and was actually dropping a bit while the market was rallying. So what already? Well, leave it up to good ole’ Mole to figure it out - for instant enlightenment take a look at the chart below:
Japanese Yen clearly driving the Dow today.

May I present today’s culprit - the Japanese Yen. What you are looking at are not the insane scribblings of a demented mind (I do have folders of those if anyone’s interested), but a comparison chart between the Yen and the Dow. One can clearly see that there is almost a perfectly inverse relationship. The Yen got pounded today right from the get-go; tried to rally but couldn’t manage to gain ground. And when the market suddenly pushed higher you could watch the Yen drop like a rock.
I usually am very careful to draw correlations between diverse markets as those are mostly valid for only limited amounts of time. For instance a few months back when volatility was pretty high (i.e. market was getting pounded) there was a inverse correlation between the VIX and Gold futures (ZG, GC). Whenever the VIX dropped hard, a day or two later Gold took a tumble. Man, was it fun trading those moves - until of course the VIX dropped towards 20 and the party was over. The same can be assumed for the market/Yen relationship right now. For certain reasons involving something exotic called the ‘carry trade’ (which I don’t have the time/space to explain here) a stronger Yen (irrespective of the Dollar btw) is currently dragging down the equity markets. Does that mean that we’ll see the markets push up every time now as the Yen drops and the inverse? Well, I think the answer is that it is a measure of leverage. On a no-news-day like today it seems that the Yen has a clear impact and I would wager that if we would see a very negative headline like let’s say… one of the large investment banks like LEH or LM declaring bancruptcy or being bailed out (perish the thought), a dropping Yen might not be able to lift the market as much. Not that I’m saying LEH or LM will go down the tubes, this is obviously a purely hypothetical example. I would feel truly terrible if such a thing would happen - and I’m sure a day of mourning might be my first course of action in that event. May I suggest Las Vegas as a proper venue? I’m buying….
So, why exactly am I calling today’s tape a ’sucker rally’? For starters volume on all averages was pretty measely compared with what we witnessed during yesterday’s monster drop. Also, market breadth was anemic at best, in particular looking at the DJI which barely managed to clock a 1.3:1 ratio and the SPX which closed at ratio of 1.4:1. The NDX was leading today with a 2:1 ratio. Finally, another tell-tale sign was that, just like Monday, we saw an end of day sell off instead of a buy-in. But for you EWT aficionados I do have a goody that should leave very little doubt as to why today was a typical consolidation rally as well as where we are heading starting tomorrow:
DJI painting a super clean Elliot Wave.

Frankly, it doesn’t get much cleaner than this. Monday we painted a typical ‘five’ down which was follwed today by a clear ‘three’ (a.k.a. an ‘abc’). To round things up the market even took the liberty to start its first leg down as a little hint of what to expect tomorrow: more downside potential. Could the market throw us a curve ball here? Possible, but again - the name of the game here at ES is to offer probabilities of market trends. And this seems to be the most plausible scenario for tomorrow’s action.
The astute and more devious ES disciple might wonder if, in accordance to the inverse Yen/market relationship, we may see the Yen push up tomorrow. Frankly, I am not sure I can answer that - I am pretty sure that it is the Yen which drives the market, not the other way around. But I things are fairly complex these days and it seems that the market hops from one correlation to the next on a weekly and sometimes even daily basis. Perhaps tomorrow rising crude oil prices will make an impact - who knows. For that reason I tend to stick with what I know and trust, which is traditional technical analysis with a healthy dose of EWT (which is actually quite traditional, but some people would disagree).
Now, there is a slightly related piece of the puzzle: The U.S. Dollar. Unless you’ve been trading out of a cave for the last month (in which case I’d be curious as to how you got your broadband working) you know that the Dollar has been making a shuttle run into the outer stratosphere. The Yen has been holding its ground, unlike most of the other currencies out there, just look at the British Pound or the Euro. But I actually think that the Dollar is due for a consolidation as we’re now bouncing against 80 on the DXY. So, it’s possible that even Yen/market correlation could be soon replaced by a Dollar/market correlation going forward. Moving on…
VIX painting 2nd buy signal.

Now, here’s the chart that’s making me a bit nervous. Most of you leeches are now familiar with the VIX buy/sell signals. I’m not going to explain that again - Berk has done that yesterday and on many previous occasions. If you still don’t know what they are, please sign up for an instant flogging at your local torture spa. Nevertheless, knowing the average IQ of our visitors, I have been trying to make the chart ‘fool proof’ by labeling the recent buy signals. The first one was even confirmed but then discredited a day after (Tuesday’s rally). Today we see yet another close inside the 2.0 BB which is yet another buy signal according to the rules. It’s NOT confirmed yet - for that we would need one more close lower in the VIX. It’s making me a bit nervous, but I also know that it is typical for multiple false buy signals to occur during bear markets.
Gold continuing its course to its 720 (interim) target.

Frankly, I don’t know why I keep bothering to post this as I continuously keep seeing folks here and  calling for a bottom in Gold, or attempting to convince me of the errors of my ways. Well - you should know better by now as I have been continously right on predicting Gold’s traversal to the downside for the last 3 months. Nonetheless foolish traders have been betting against me and I’m spending their money on cheap booze and expensive floozies as we speak. I know nobody really is going to believe me this time either, but here’s what I expect going forward. Either we get completely wiped out right here or we push up to suck in a few more suicidal gold bulls. I’d give the former a 65% probability and the former a 35% chance. I actually hope for the latter as I would love to re-load and add a few more puts. For the record: option players should trade GLD or GDX - if you want you can also grab some ABX as that one is enjoying the double whammy of being an equity plus being related to Gold right now.
I also see a 100% probability that I will now re-focus my attention to said floozies who are taunting me with the prospect of devious pleasures. Got to spend my ill-gotten gains somehow after all - plus, I have a bad reputation to live up to.
Cheers!
« Older Entries
Newer Entries
金币:
奖励:
热心:
注册时间:
2006-7-3

回复 使用道具 举报

您需要登录后才可以回帖 登录 | 立即注册

本版积分规则

本站声明:MACD仅提供交流平台,请交流人员遵守法律法规。
值班电话:18209240771   微信:35550268

举报|意见反馈|手机版|MACD俱乐部

GMT+8, 2025-7-27 20:13 , Processed in 0.056184 second(s), 12 queries , MemCached On.

Powered by Discuz! X3.4

© 2001-2017 Comsenz Inc.

快速回复 返回顶部 返回列表