搜索
楼主: hefeiddd

一个笨蛋的股指交易记录-------地狱级炒手

  [复制链接]
 楼主| 发表于 2009-4-1 15:46 | 显示全部楼层
September 9th, 2008 9:09 pm Market Forecasts 61 Comments

I am writing for Mole tonight, and I will discuss the $VIX (which I wrote pre-market), as well as the indexes.
As we all know, $VIX is the volatility index for the $SPX.  Essentially, it gauges the fear in the markets.  When the $VIX is high, people are scared, which typically leads to people selling stocks.  When the $VIX is low, complacency sets in, and the world eyes the moon with a stone’s throw.
I took all the data the Prophet.net has on the $VIX and started drawing some conclusions.  The most notable items on the chart, aside from the actual signals, is the 2 major channels drawn.  The red channel, the one I call the bear market range, is where we spent most of our days, chilling out maxing, relaxing all cool and trading some stocks before 2000 came through.  That range is from 19 to 47, and accounts for most of the $VIX price action during the tech bubble.  The purple (lavender) faded channel on the bottom, starting from ‘03 is the bull market range.  It basically covers 16 to 11 (11.5), and is the complacency level this decline started from.  I have some additional price lines on this chart, but they are more valid from a daily standpoint.

This is a little more than 1 year, with $SPX compared with the $VIX.  The red dots are sell signals, and the red lines take you to the respective top.  Likewise, the green circles are (confirmed) buy signals, and the green line takes you to the proper bottom.  As you can see, we got a confirmed buy signal on Monday, which could well lead to a big rally.  Normally, in a bear market move, we will see 2-3 failed $VIX buy signals before we actually get a confirmed one.  As it stands right now, with this signal, we must respect the upside potential in the form if a C wave of an expanded flat that is wave 2.

Here is the same chart just using lines to remove some of the noise.  $VIX is in black while $SPX is in blue.  Same idea, follow the lines.

Finally, I would like to discuss what it takes for the $VIX to issue a signal.  The signal is comprised of 3 candles, or daily closes.  A confirmed signal needs the following on the $VIX:
1) A daily close outside the 2.0 BB in either direction (signal alert)
2) A daily close back inside the 2.0 BB from the outside (signal issue)
3) A daily close deeper inside the 2.0 BB (signal confirmation) - (i.e. $VIX closed outside, to the top, on Thursday.  Friday, the $VIX moved back inside with a lower close, issuing the signal.  Monday, the $VIX closed lower than the Friday close (i.e. more towards the center of the BB), confirming the buy signal)
The sell signals the $VIX gives are extremely accurate while the buy signals (confirmed or not) are a little harder to read, and consequently, hold less weight (to me).  Some people have been saying that the $VIX is “broken” but I see no indication of that thought.  So far, the $VIX has been right on cue, and has called a number of the last tops and bottoms.  As I said yesterday, conventional thinking will be unraveled in this move down, and perhaps to predictive value of the $VIX with it.  But I will continue to use this while it is working.
I took those charts earlier today.  Now that the $VIX has closed higher than the signal alert close, we can likely ignore this buy signal.  A close higher in the $VIX tomorrow would confirm that notion.
So, that said, where are we now?  The indexes close down across the board.  FNM was 1 of 42 stocks up on the $SPX today, so breadth has (yet again!!) reversed back to the downside.  This breadth reversal, however, was stronger than the bullish reversal yesterday.  What does this mean?  It means wave 3 is here and in force.  We might bounce up a few more times if the markets want to keep banging out 1-2s, which I wouldn’t mind.
Here are the charts, starting with the $COMPQ because I love relative strength.  I threw out a target of 2205 a few days back, but since the $COMPQ closed on lows, I am thinking we will hit 2155-2135, and even our lower target before this is over.  In case you haven’t noticed, the markets are moving swiftly down, as we laid out.  At this point you should be using the inevitable “snap-back” rallies to get short.  The purple lines are a projected path should we be adding 1-2s like the $SPX is.

Talking about the $SPX, I think we will see 1200 tomorrow.  Most likely for a test, and a strong rally off of that level as the bulls will have their “retest” of the lows.  Since we are oversold and are really pushing down hard, this rally could be quite strong, probably looking for at least 1250, but we will gauge for sure when we get there.

I really hope you all have been enjoying this move as much as Mole and me.  We have laid out some killer names, and we hope you have been grabbing some nice profits with us.  But really, 9 out of 10 stocks are going down, so the choice is yours.
Skål!
金币:
奖励:
热心:
注册时间:
2006-7-3

回复 使用道具 举报

 楼主| 发表于 2009-4-1 15:48 | 显示全部楼层
September 9th, 2008 9:09 pm Market Forecasts 61 Comments


Here is the same chart just using lines to remove some of the noise.  $VIX is in black while $SPX is in blue.  Same idea, follow the lines.


金币:
奖励:
热心:
注册时间:
2006-7-3

回复 使用道具 举报

 楼主| 发表于 2009-4-1 15:51 | 显示全部楼层
September 8th, 2008 9:40 pm Market Forecasts 87 Comments

I only regret that my “Take a load off Fannie” post was not on Thursday, rather than a week or so ago, but we can’t win them all.  Check out this picture I saw today that helps show how convoluted our fiscal policies were (this was drawn in the 60’s).  Amazing what insight we can have…

If you are not in the market, be glad, because the whipsaw action today was rough.  At this point, the trend seems fairly dead.  We have moved up and down, and back up again.  But, we all know that the largest moves up, including today’s 350 point move, complete with gap up, of which we have had 5 in the last 2 months, occur in down trends.  Very soon the markets will have chosen their fate, and we will inform you as soon as we can be certain.
Let me recap since a lot that we have talked about has happened.  First and foremost, we got a confirmed $VIX signal (I will discuss this in a posting sometime tomorrow).  The $SPX closed inside the 2.0 BB, quite far inside really.  This is a serious indication, and should not be ignored.  Normally we would expect a serious reversal, and this was a signal we were waiting for on the topside with $COMPQ.  Finally, breadth has reversed, yet again, significantly, but not too far considering our 2% ($SPX) retracement.
This is something some of you have seen frequently, and some of you may not have seen at all.  It is interesting to use, and is frequently useful (to me) around disputed tops/bottoms for a measure of resilience.  It is the New High/New Lows indicator, but not the Mclellan Oscillator.  Obviously, the markets closed up big today, and we would expect to see the swell of positive breadth and volume that we did.  We would also expect to see a growing number of new 52-week highs if the target moon scenario was to be properly supported.  Here is what we saw today.  And the second chart is what we have been seeing since late ‘06.  Not a sign of a healthy market.


Another thing I would like to mention is from an e-mail I sent to Mole last night outlining my thoughts.  Basically, I said that this rally was on very low volume in the futures markets, and had retraced to appropriate fibonacci levels in an A-B-C fashion.  We agreed to suspend our stops, and see how the markets treated these levels.  I also asked him to look at 12-12-07.  It also depicts a day that was screwed over by government intervention.  Coincidentally, it was also towards the beginning of a wave 3, this one just in wave (1).  I was talking specifically about the $INDU, but I would like to point out the similarities in the $COMPQ’s candle.

We also got a BB reversal on the $COMPQ, the $NDX however, did not.  The $NDX has fallen 10% since the highs struck days after the reversal signal.  We must respect the chance of a rally back up, but we should also recall that this type of action is common in our preferred wave 3 of (3) scenario.  This move will unravel the conventional wisdoms of the market.
If the Nasdaq indexes, which are tracing out the most clear wave patterns, were to reverse from here, we would expect this behavior to be in an expanded flat formation.  That action would move up in 5 waves into the 2030 ($NDX) range, assuming today’s lows were the bottom of B.  Here are the preferred chart count and the alternate flat interpretation.  We would expect this rally to last long enough to allow for continued selling in a later wave 3.  It could last as long as a few months, holding up until the election is past.  Obviously, breaking our March lows would allow us to eliminate this alternate count.

There are many things to support each case here.  We have 2% up on blue chip or a weakening tech sector which threw a full 3% reversal at one point.  We have a $VIX buy signal coupled with a BB reversal, typically a VERY strong sign.  Though we did not see the same reversal flashed in the higher beta $NDX, which put in a lower low today.  There are valid wave counts to support either case.  Long term breadth supports the bear, while the short term rally showed fervor today.  The bulls have Beanie.  The bears have real life and the government.  That said, I will return the short term indicator to mixed, because frankly, who the hell knows?!?
I would like to talk about a few of the picks I have thrown out over the past week and gauge their performance.  Some of them, LFG, MBI, GCI, didn’t get taken, or got the axe.  But the select few that made it through were leading the way.    GOOG was behaving like a champ today, and helping to drag the $NDX back to where it belongs.  Get some if it bounces.

BIDU has dropped 90 pts (at lows) from my initial entry, and nearly 20% (60 pts) from our early reco.  Big volume on the exhaustion rally candle today.  A potential triangle would be targeting the 230 range, and we have found new resistance around 285.

FSLR needs to break through its gap resistance (illustrated by purple) before we can target 175 or 150.  Both have nice resistance clusters around them.  Either way, it seems the support shelf has been broken, and with today’s action, retested with a rejection.  The short term “triangle,” if we can call it that, target has been met, but I think there is more to go.

I will leave you with a chart that Mole sent me today, illustrating the strength of the overhead resistance.  I am really looking forward to the rest of the week, as I imagine by its end, we will have but one remaining choice.  Keep with us as we will keep you posted as to the developing wave pattern.

Get a good breakfast tomorrow, the early action should be telling.  As the Japanese say, the first hour is the rudder, setting the direction for the market’s daily action.
Skål!
金币:
奖励:
热心:
注册时间:
2006-7-3

回复 使用道具 举报

 楼主| 发表于 2009-4-1 15:52 | 显示全部楼层
I will leave you with a chart that Mole sent me today, illustrating the strength of the overhead resistance.  I am really looking forward to the rest of the week, as I imagine by its end, we will have but one remaining choice.  Keep with us as we will keep you posted as to the developing wave pattern.


Get a good breakfast tomorrow, the early action should be telling.  As the Japanese say, the first hour is the rudder, setting the direction for the market’s daily action.
Skål!
The Big PictureSeptember 6th, 2008 4:24 pm Market Forecasts, Update 107 Comments

As a trader I have always been fascinated by market psychology. By its definition the process of ‘price discovery’ is intrinsically a large experiment in human emotion which is driven by greed and fear. Although the former is what brings people to the market in the first place, in 9 of 10 cases it is the latter that proves to be the basis of their financial demise. As Peter Lynch put it: “The real key to making money in stocks is not to get scared out of them.”
Of course things change profoundly when you find yourself in an ensuing bear market - but in a way things remain exactly the same. Only that the dynamics now switch into reverse, in that the ‘upside’ is the continuous slide down and that the ‘downside’ are the various episodes of corrective bull rallies. Nevertheless, many investors seem to have a psychological barrier towards ’shorting’ stock and it is probably fair to say that an overwhelming majority have never shortened a single stock in their life. After all, it is a bit ‘unnatural’ for Joe/Jane Sixpack to grasp the concept of selling something now just to buy it back later, hopefully at a lower price. I have tried to explain this idea to some of my friends and most of the time they just give me a polite smile and hastily proceed to change the topic of conversation. As I enjoy getting invited back (especially since the food is free and the women are hot) I don’t press the issue. And finally, as I am an evil speculator I am aware of the fact that for every penny I wrest out of the market someone else out there has to lose it. It’s a zero sum game, no matter what anyone tells you.
The other aspect of investors losing money in a bear (and also bull) market is that they fall prey to their own cognitive biases. Let me suggest a few of my favorites - you can find the full list in Curtis Faith’s ‘Way Of The Turtle’ - a most excellent read:

  • Loss Aversion - The tendency for people to have a strong preference for avoiding losses over acquiring gains.
  • Sunk Cost Effect - The tendency to treat money that has already been committed or spent as more valuable than money that may be spent in the future.
  • Recency Bias - The tendency to weigh recent data or experience more than earlier data or experience.
  • Bandwagon Effect - The tendency to believe things because many other people believe them.
  • Low of Small Numbers - The tendency to draw unjustified conclusions from too little information.
I guess you get the picture - people often (if not most of the time) make decisions which are driven by human emotion, not by rational analysis. The natural instincts of our deeply ingrained reptilian brain might be well equipped to staving off natural enemies and surviving a cold winter, but are completely orthogonal to the skills needed in making money in the market. Yes, we all like to believe that we are stone cold traders who can press the buy button when our instincts scream at us to start selling everything now! But evidence points quite to the contrary - most traders fail because they sooner or later fall prey to their own fears. Of course there is a good portion of people who have a trading system without a statistically reliable edge or have no trading system at all, but this is not today’s topic.
Reducing the ‘Noise’The Internet and modern information technology as a whole has given small time investors/traders access to a wealth of data and tools that was reserved to a wealthy elite just a decade ago. I should know - I was there and remember paying top Dollar for a trading platform that does not even come close to what I am now able to enjoy for free today. On top of that I am able to access a vast amount of information and news at the push of a button, right from the convenience of my home. I can also watch financial networks covering the market pretty much 24×7 (not that I personally ever do, but it’s there). For the fundamental trader I can only guess that this is pure heaven, however for the technical trend trader (yours truly) all that data in some ways may be more of a curse than a blessing. You see, the human brain is not very good at absorbing vast amounts of information. We are good at averaging - some call that ‘fuzzy logic’, and most of us are very visual. Which is why man traders eventually embrace technical analysis. As the thinking goes - all that vast amount of fundamental data which we could not possibly hope to digest is simply reflected by one main denominator, the actual market price of the underlying equity or commodity as depicted by a price chart (remember, I was talking about ‘price discovery’ at the beginning). Add to that some time tested chart patterns like ‘triangles’, ‘head and shoulder formation’, ‘double tops/bottoms’, etc. and you’d think that trading should actually be fairly easy, right?
Well, as you probably have learned from the tribulations of life as a trader - the answer is no. We just can help ourselves it seems and sometimes - and I actually dare to say most of the times - the majority of us are unable to see the forest for the trees.
Unable to See the Forest for the TreesThere is is - the topic of today’s posting - thanks for bearing with me so far, it’ll be worth it, I promise. And in my opinion the timing for bringing this up could not be any better. What inspired me to take a step back and to write today’s intro were my own personal feelings when I learned about the FRE and FNM bailout half an hour after the market closed on Friday. I have to say admit for a little while I was very worried - but I quickly snapped out of it and actually became very excited, as we bears will get yet another chance to load up on short positions at bargain basement prices.
If you have been visiting this site for a little while it won’t be a big surprise to you that both Berk and I are extremely bearish on a medium to long term basis. And as stern proponents of technical analysis our own findings and that of people we deeply respect indicate that the market is heading towards a veritable financial tsunami. This should be readily apparent to anyone looking at a long term chart of one of the main averages. However, due to the reasons touched upon above, there is a lot of ‘noise’ and disinformation in the news as well as in the general financial blogosphere, which Berk and I sought to remedy. This was the general inspiration that lead to the birth of Evil Speculator - our motto after all can be summed up as: “Dedicated to identifying probabilities of price targets in the financial markets.”
I think so far we have been fairly successful in an extremely volatile and hostile financial environment. However, even we sometimes fall prey to our own fears or cognitive biases and fail to see the big picture. Or perhaps we take our own convictions for granted and thus fail to properly convey the larger picture many of you seek to get a grasp on.
I believe today is a unique opportunity to take a step back - to get up from your chair and walk all the way backwards until your back touches a wall. Once you’re there, look at the chart below:


The Trend is Clear.

This is a weekly chart of the last six months in the Dow. I think it is abundantly clear what I am trying to illustrate. We usually look at a lot more detailed charts as as traders we are concerned with what tomorrow brings. And admittedly the last few weeks were fairly volatile and full of whipsaw moves, right?
Or were they?
I actually beg to differ! If you look at the chart above it becomes clear that the Dow has continuously been dropping in the last month! Of course the market was whipping up/down pretty hard on a daily basis, but perhaps the key here is to do the opposite of what most people have been advising which was to focus on day trades and to take profits quickly. Perhaps, looking at the chart above and even with a rudimentary understanding of chart patterns even a 10 year old would come to the conclusion that the general trend is most distinctly to the downside. The question here is: are you mostly interested in making a few bucks trading the swings? Or is this an opportunity to position yourself for a continuation of the larger trend? This of course is something you have decide for yourself based on your personal risk tolerance, trading style, profit goals, etc.
MondaySo, will we probably get a bounce to the upside on Monday morning as the perma-bulls use the FNM/FRE bailout as an excuse to retest some of the prior support lines which are now have turned into resistance? Yes, most likely so, but it should be clear where we are heading on a weekly/monthly basis even without believing in Elliot Wave Theory or any other types of technical analysis. So, my advice for you bears would be to stick with your guns and to protect your long term short positions with hedges.
Here’s the short term forecast for Monday - this has been a long post, so I’ll make it very quick:


Retest of 1260 already in process in after market trading.

Not long after the bailout news hit the ticker the spiders were already resting at 126, so it is fair to say that we will re-test that previous support line again. Notable is also the fact that 1260 on the SPX (or ES futures) almost perfectly lines up with the 38.2% fib line. There is actually a good chance that ‘irrational exuberance’ might lead to a retest of the 50% or even 61.8% fib lines, so be prepared. Again, short of dumping your existing puts (or short positions) an alternative may be to properly hedge yourself. I already loaded up on some SPY calls but must report that they were not compensating as much as hoped. Therefore, based on the strength of the $RUT I would propose to load up on IWM calls instead.
This rally should not last more of a day or two, after which we should push down very hard, as we continue to trace out wave 3 of 3. If we keep pushing to the upside beyond 1275 on the SPX we might however have to question this scenario again, but as of now there is not reason to make any pre-mature assumptions.


Gold at psychological support line.

I’m skipping the remaining indexes as they are on a similar path, perhaps with the exception of the Nasdaq which remains to be leading the drop. As expected, Gold has not been able to drag itself much higher (not for a lack of trying) and the chart indicates that it will continue to retest its psychological resistance line at 800. I am usually not one to make market correlations easily because they only hold for limited amounts of time, but considering the bailout news it is a hgh probability that Gold will not be able to muster another try of the 850 consolidation target. It may be that even a short term market rally will be the ’straw that broke the camel’s back’ and that we will find the precious metal way below the 800 mark on a double.
Something I have not pointed out previously is the reason for the 850 target should Gold find the strength to push up one more time. I believe that 825 should in that case a distinct possibility and if that is reached I expect the September 2nd gap to be filled as well. But again, the probabilities as of today seem to favor an immediate drop starting in late Sunday night trading.
Our interim target in either scenario remains 720. We have little doubt that Gold will reach that target and that a push up would only delay the inevitable.
Alright, if you made it all the way here you are truly an evil speculator, who however should get a life during weekends. With that said - grab yourself you favorite bottle of brew and enjoy some time with your family (or if that is not an option I would suggest you support your local nudie bar).
Cheers!

[ 本帖最后由 hefeiddd 于 2009-4-1 16:01 编辑 ]
金币:
奖励:
热心:
注册时间:
2006-7-3

回复 使用道具 举报

 楼主| 发表于 2009-4-1 15:53 | 显示全部楼层
September 4th, 2008 10:50 pm Market Forecasts, Update 70 Comments

Wow!!!  What a day!!  Did anyone see this coming?  Honestly, I can say that I did, but, evil as I am, gloating isn’t really my style.  Suffice it to say, I was quite happy with the move today, and for a number of reasons.  Follow along… I have a few things to point out today, and I will do my best to not compose an 8000 word financial masterpiece, but I can’t be sure.
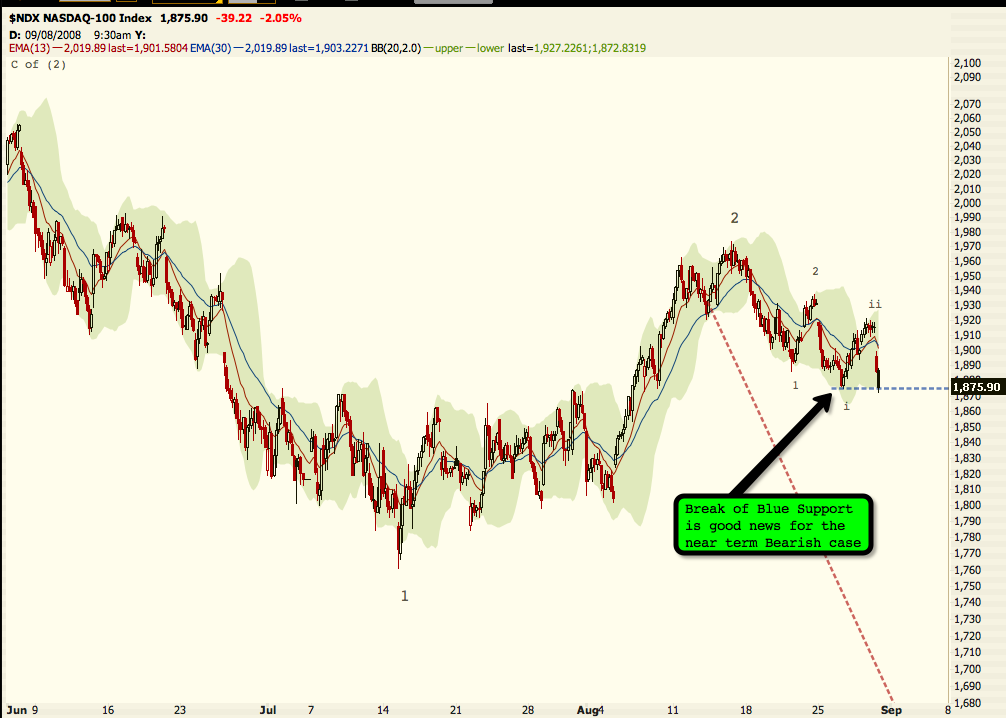
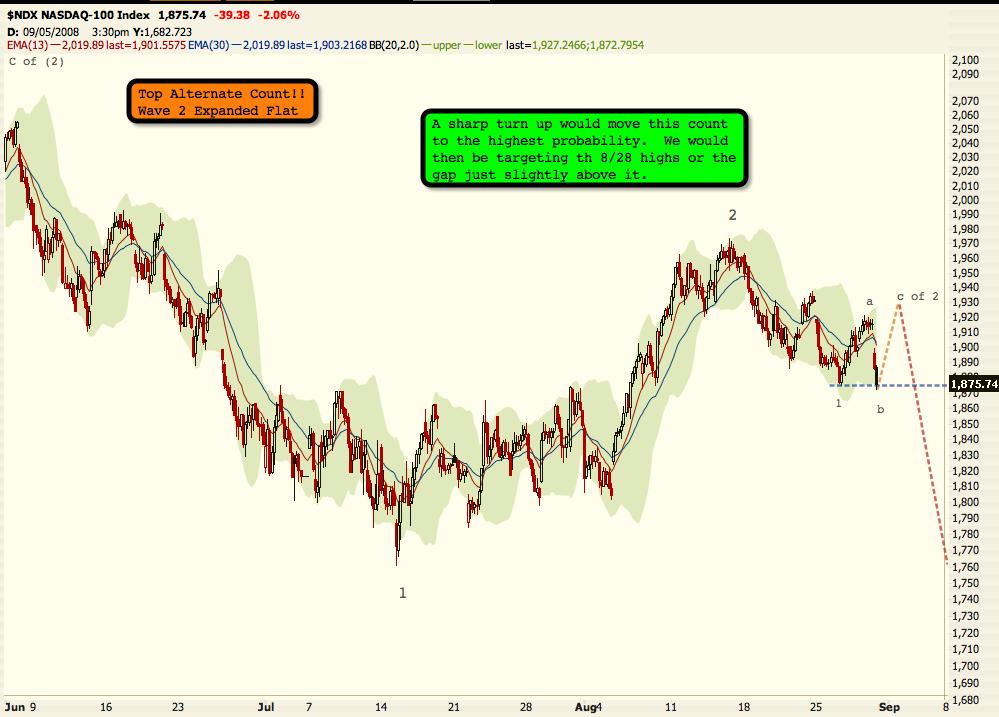
First up, we have the market action.  I am gonna throw out 3 indexes tonight, starting with the NQ.  Keep with me as there is a lot of information on this chart.  First off, check out the 3.2% drop in an index in one day.  Suweeeeet!  Second, notice the BB bands and the last time we pushed out on such a, “marabuzo,” if I may, of a candle, we spun and snapped back.  I expect a lot of spinning, and perhaps, less of a snap back, depending on how things play out.  The former would indicate wave 3 of (3) is underway and we will fall in a relentless decline.  The latter implies that we must wait, yet again, while wave 3 continues to subdivide into additional 1-2, i-ii, (i)-(ii)s.   But, we did almost push outside the  3.0 (not shown) BB today, which is very rare.  But today’s action does show a complete reversal from the BB break to the upside we talked about a month ago.  Point number 3 is the teal trendline which represents wave 3 (of wave 1), a basic path from which we can project.  As you can see, my original orange trendline is a little more accurate, but still underestimated the speed of this move.  Finally, we talk about targets.  An easy target is 2205, but that is really close at this point (potentially only 1 day away).  The most probable target range surrounds the March lows (not shown) into the range of the July lows.  This covers the 2150-2160 range, and there are a few potential targets on the way down that we will discuss should the NQ have no regard for common resistances.

For the $RUT, things are just beginning.  We have yet to break an important resistance resting at about today’s close (718).  We are pushing the BB’s and are in the same price location, but further along in the wave progression, as the rally following 6/11.  Once we break our support, we should look predominately to 680 in real short order, perhaps hovering a little under 700, as we kiss that psychological level good-bye.  We will keep you posted as this index is quickly stepping up its game.  The three points on this chart are the 3% decline, the short-term RSI and mid-term momentum indicators turning down, and the ATR moving up rapidly.  As far as the ATR, notice how today’s candle was as large as the range of 7 full days of trading just a few weeks ago.  Things are really starting to click here.

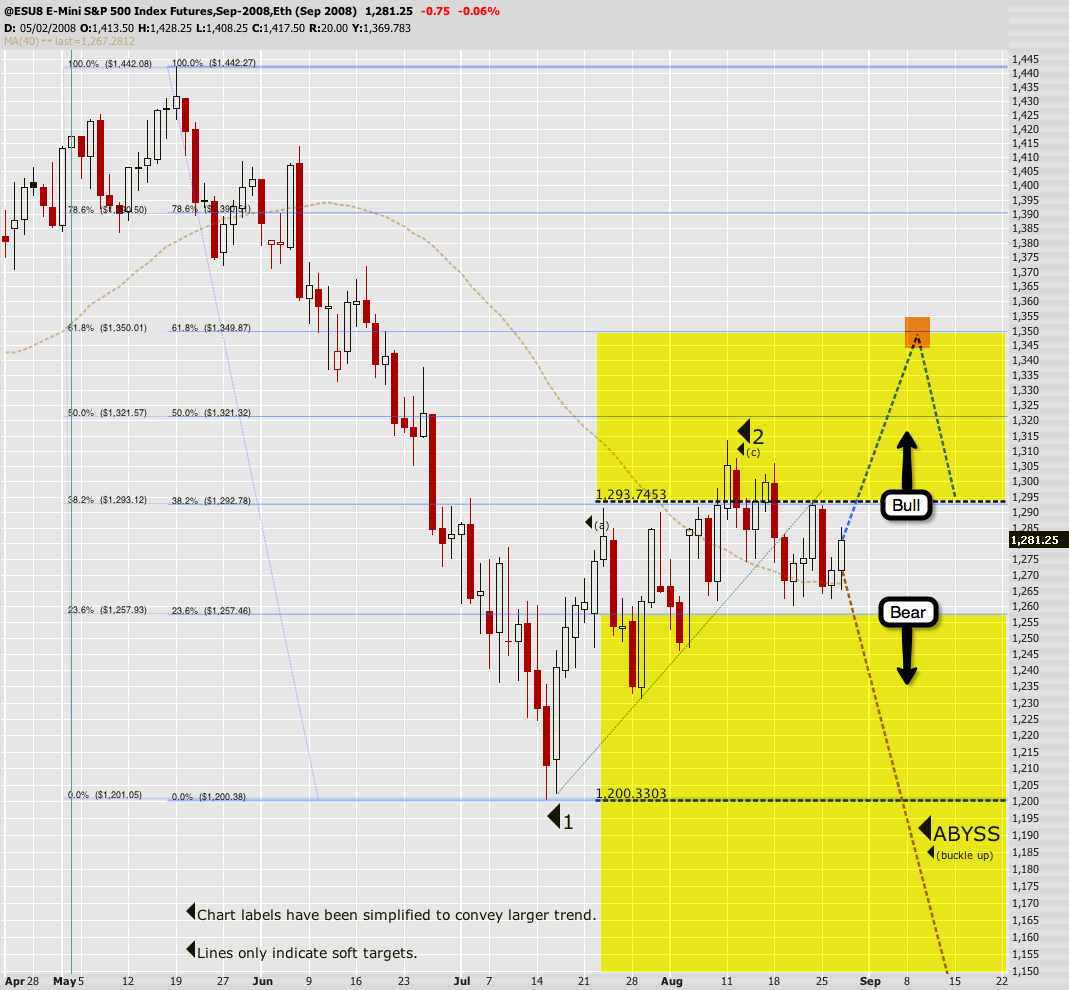
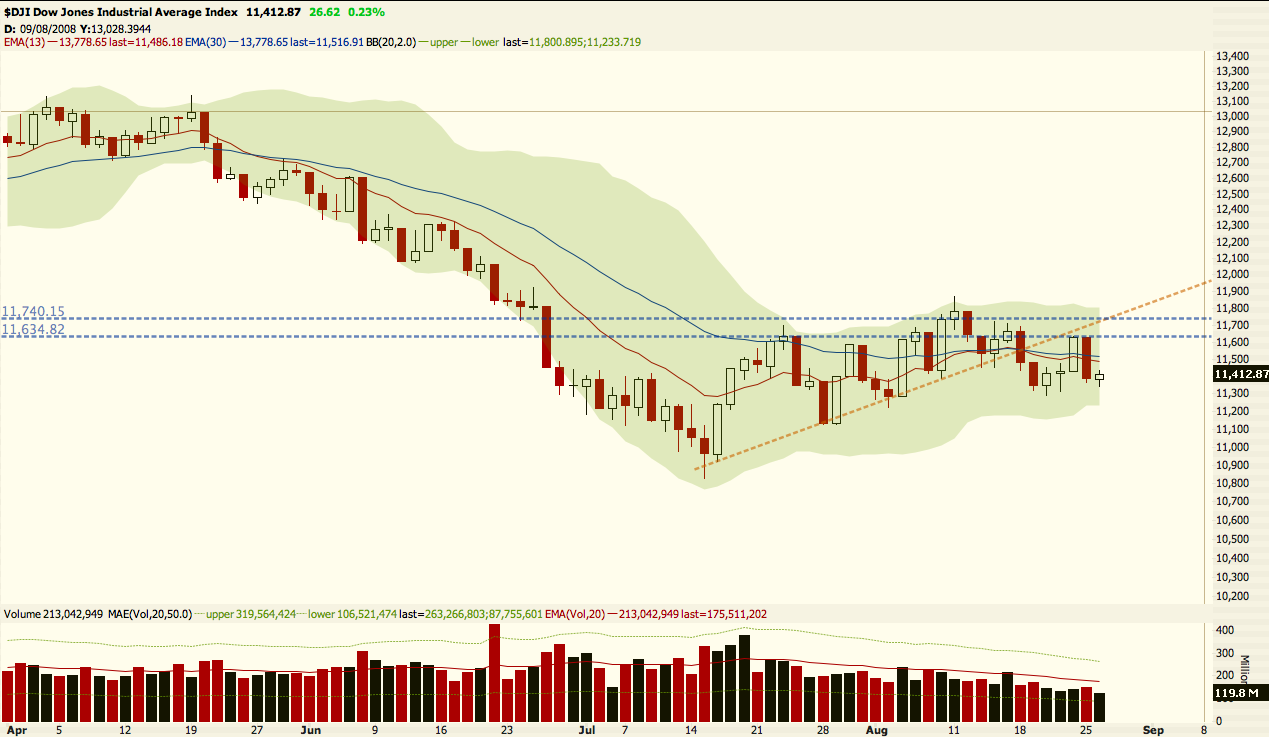
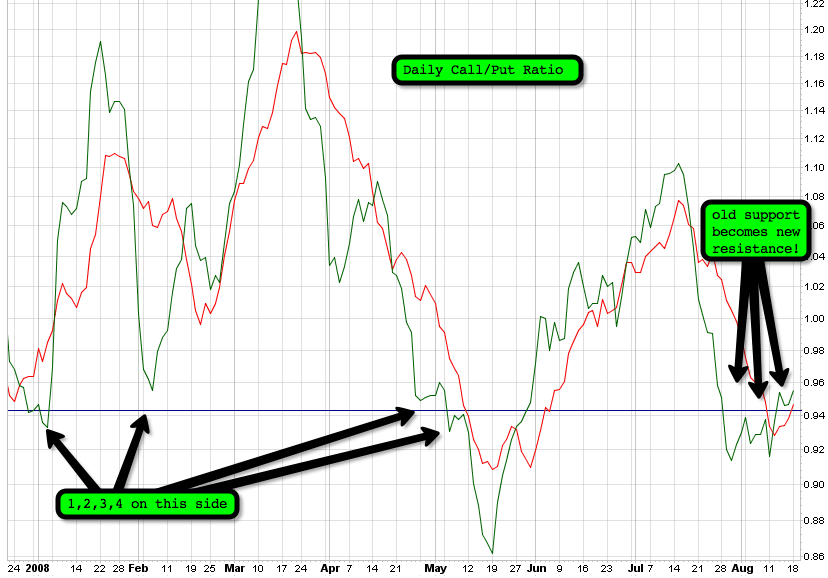
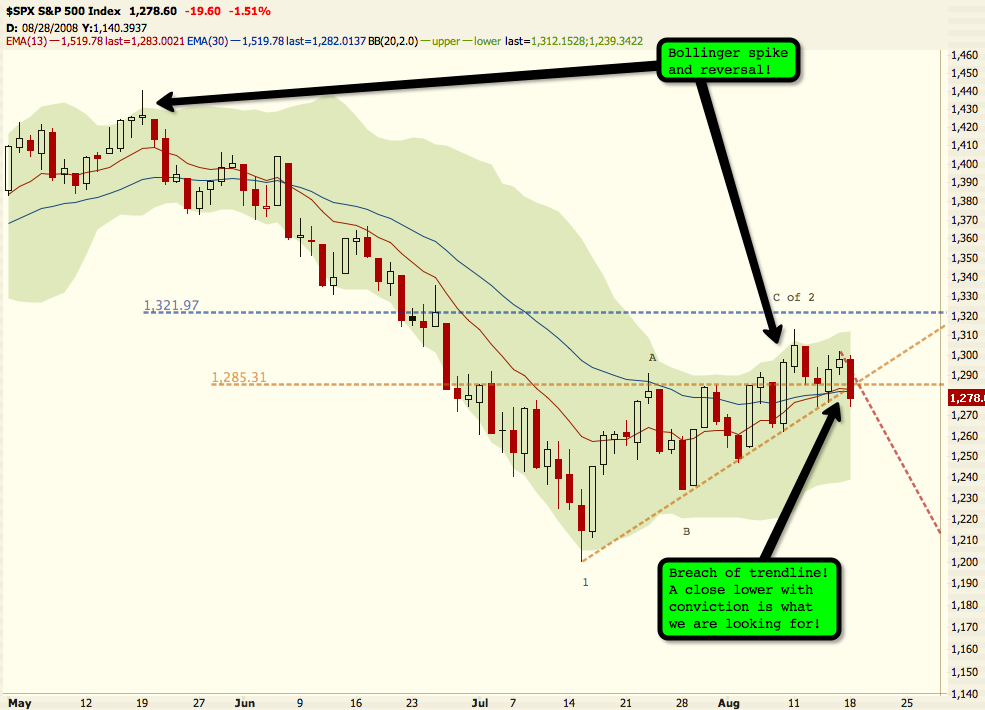
Finally, my least favorite index on the planet.  Yes, the boring one that all the “standard” and “conventional” financial nut-jobs cover.  Let me assure you that I am not any of the plain words in the above sentence, but I will call this a shout out to CNBC.  Go Cramer! Go Cramer!!  So, the $SPX has some interesting points as well.  I will be a little “risky” and talk about the $OEX breadth a little.


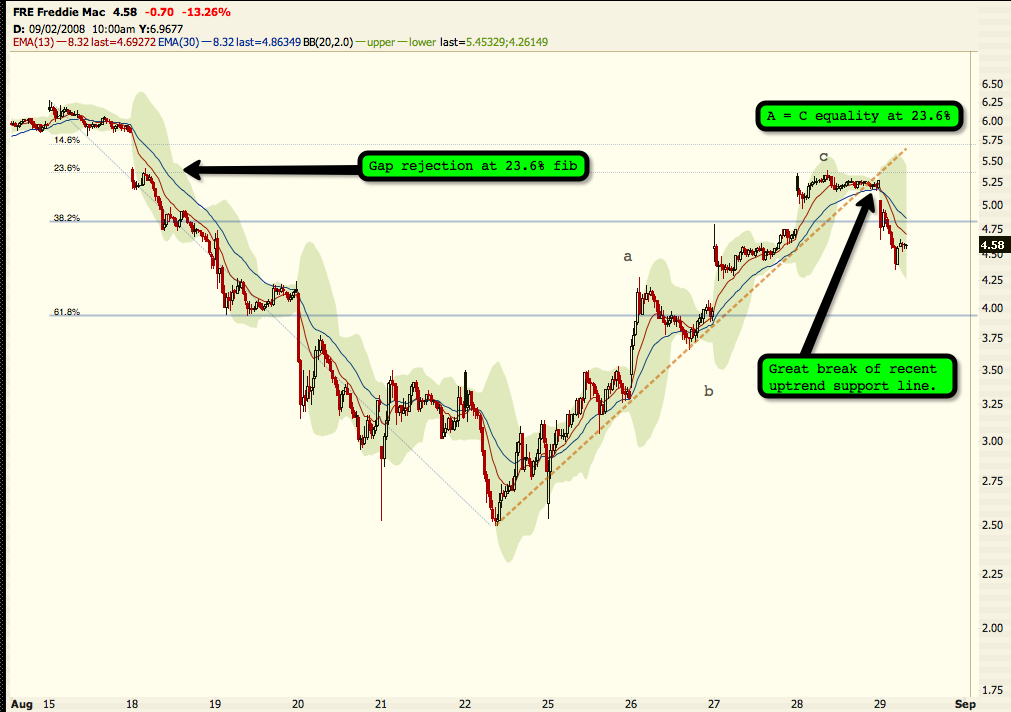
These two pictures show $OEX breadth (top) and my ever-popular “Breadth-O-Meter,” complete with EOD volume numbers.  Notice the blue chip volume indicating this is not over, while interestingly, the leading $RUT and $NDX are showing weaker volume percentages.  Breadth was down more than 9:1 across the board, with financials (LEH, MER. FRE, FNM, etc) back to leading the way lower.  Okay, back to the $SPX…The banks have started to turn down (check $BKX for that), and the $SPX can no longer maintain its bullish ghost.  Today’s action technically breached to low on the 28th of July, but bounced back a little towards the close.  I think all the big wigs would have to agree that this means we will be “testing” the July lows.  The two most common targets, which coincidentally are the most common fibonacci clusters are the low and close of July 15th.  The $SPX has closed below it’s 2.5 BB today, meaning that a close back inside (the 2.0, not 2.5) should not be taken lightly.  Finally, the $SPX has the same large moves in the ATR, MOMO, and RSI, indicating that we should be progressing lower from here.

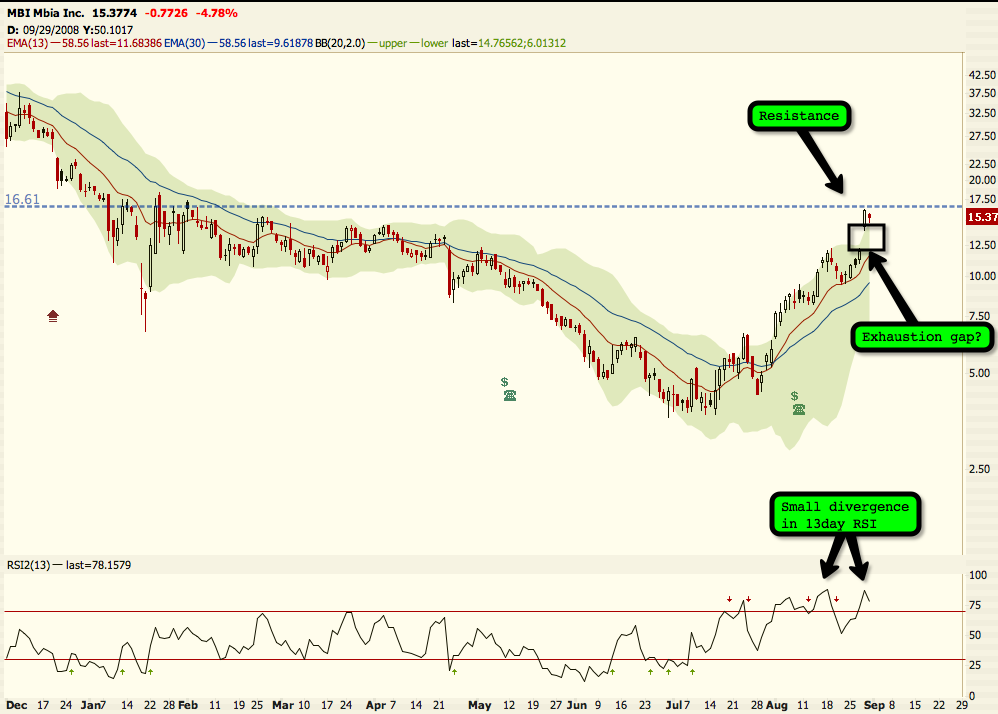
Okay, I have rambled for quite a while now, and I really wanted to cover some of my picks, as well as some others.  BIDU, GOOG, CME, FSLR (which gave a nice bounce to enter on this morning), GCI (finally breaking).  CCC just couldn’t fight the tide any longer, and LFG I think is in the same boat, and should be drowning soon.  And I’d like to bring a few more to the table…BDC on the retest, ICE is about break from a rising channel, TRA could be a confirming double top or an ugly H/S top, but either way is about to break horizontal res, PCR about to hit 52 week lows, and the moves in AG machinery, DE, CNH, MTW, BUCY, JOYG, LNN.  Man, the list goes on, but I still want to talk about the $VIX.

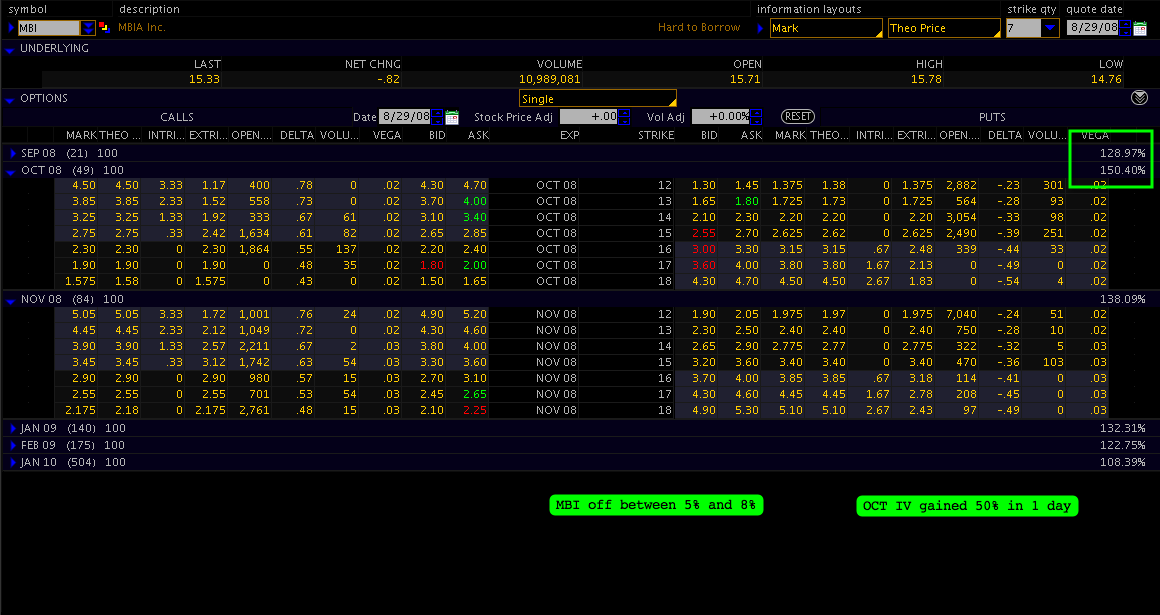
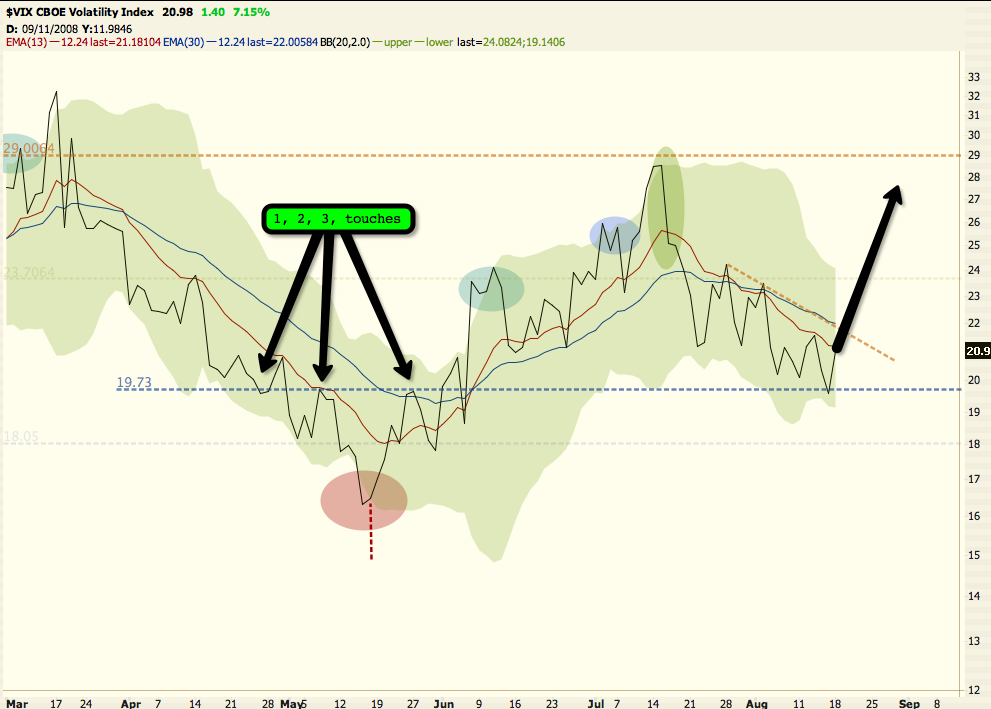
There is a lot to say on this, and I am going to move quick to finish on a bang.  $VIX closed outside the 2.0 BB, meaning that next time it closes inside, it will issue a short-term buy signal.  The beautiful thing about this, is that this is the exact level as the first failed buy signal of wave 1 or (3) down.  I do expect a close back inside shortly, but I expect the signal to fail, meaning that we won’t get a consecutive lower close.  There should be several of these fake signals during this wave 3 decline.  Just seeing the potential signal, to mean, confirms undoubtedly, that wave 3 is here, and that we are moving considerably lower from here.
Okay, I know I flooded everyone’s already frazzled brain, but hang on, because you may not get the best entries from here on out.  I wouldn’t be surprised to see indexes gapping either ways on opens, and very short, steep rallies.  Keep tuned in and we will keep you on the right track.
Skål!
金币:
奖励:
热心:
注册时间:
2006-7-3

回复 使用道具 举报

 楼主| 发表于 2009-4-1 15:53 | 显示全部楼层
September 3rd, 2008 10:50 pm Uncategorized 79 Comments

The truth that is - however slowly. Yesterday morning we saw exactly what I was predicting about a week ago going into Labor Day weekend: The big boys returned from their vacations in the Hamptons only to press on with snorting six foot long lines of funny powder and destroying our financial system as we know it. First order of business was to squeeze any remaining short holders out of the market (that would be yours truly), but for some reason about one hour into the fun somehow somewhere on Wall Street reality suddenly started to sink in (a rare event, so mark your calendars). Perhaps by then a sufficient number of market pimps had finally received the ‘You Are So Screwed’ memo that I have been taking the liberty to mass mail out for the last few months. Whatever the reason was, some chain reaction kicked in and the market proceeded to tank like an anvil dropping from 30,000 feet.
It’s been all smiles for the bears since. Today’s tape ended on a slight up tick except on my favorite index, the S&P, which had the decency to put in another low. Breadth was pushing back/forth between 1.3:1 positive or negative - pretty much a non-event. As for the coming days and what to expect - I have some nice charts to show you right after sharing some interesting news I ran across today:
It just so happens that the first in many hedge funds with major exposure in commodities went belly up today. The Ospraie Fund managed to lose 26.7 percent in August, after - I quote “a substantial sell-off in a number of our energy, mining and resource equity holdings” - end of quote. Well, the commodity desks of most of the leading investment banks were the only profit makers in the last few quarters. With commodities dropping through the floor recently this sweet little spigot has now effectively been cut off, which in my mind should be a water shed moment (pun intended) for this sector. What is left for those guys to fall back on? Exactly - nada, zilch, nothing. Hence, expect a lot more ugliness to rear its beautiful head in the glamorous world of investment banks.
Okay, I’m all giddy after today - so let’s get on with it:
Looking better - but still in limbo.

Right off the bat let me disappoint anyone who expected me to predict immediate doom & gloom for tomorrow. We should be so lucky! The S&P futures chart above makes it fairly clear - we are on our way and the last two days were fun, however we are still in limbo land, ladies. We got close to breaching that 1260 low I have been sacrificing a perfectly good chicken for, but then Ralph Elliot ran out of motive waves and we proceeded up for a healthy consolidation. Expect a further push up tomorrow towards the target area of between 1280 - 1290, which magically lines up with 50% - 61.8% fib lines relative to yesterday’s peak and today’s low. After that, it’s back to shedding more points on all averages.
Unless of course we somehow breach that zone and keep pushing up. However, we are okay as long as we stay below 1303 - beyond that it’s bye-bye short term bear scenario and hello more of that dreaded bullish whipsaw upside down inside out fun. Let’s hope we won’t have to even think about that, but I need to make sure ya’ll understand that this scenario has not been invalidated just yet. But WHEN - oh magic Market Oracle who we depend on for every of our trade decision - WHEN can we finally rest in peace without the use of massive amounts of sleep inducing recreational drugs? The answer, my blood sucking depraved disciples is and remains 1260 on the SPX - once we cross that we can kiss the short term upside potential goodbye. However, before you start popping that Mumm champagne bottle you bought off some vagrant for 2 bucks last year - we are not completely out of the bull infested woods until we breach the July 15 lows which remains to tease us from a still safe distance of 1200. We’ll get there, but it’ll take some convincing and continuous action by the bears. Enough said.
Nasdaq leading in every direction.

While we’re looking at indexes let’s also peak at the Nasdaq futures. Now here’s a well behaved average for a change - what can I say - tech stocks just have been hammered lately and I hope the good ole’ NQ is paving the way of what’s to come for the $COMPQ. Again, 1,764 for the NQU8 futures and a little bit more distant 2170 for the $COMPQ cash index are the final confirmation that the bullish consolidation rally from hell has ended.
TNX breached through 37 resistance.

Moving on - somehow surrepticiously in the murky depth of the financial markets something pretty exciting happened today. The 10 year treasury yield managed to close at below 3.7%, which is something I have been waiting for. For the uninitiated - if panic money moves into so called ’safe investments’ such as treasury bonds, the inversely related yields usually start to drop. We haven’t seen 3.7% since last May and since most of you have been tragically bereft of a long term memory let me remind you that the equity markets weren’t doing so well back then. In a nutshell: A drop in yields usually equals a drop in the equities markets. As you can see, there is not much resistance stopping the yield before 35.5. Not a bad omen to finish the day I might say.
Am I calling it or what?

Finally, on to my favorite precious metal - Gold! Which still can’t get much respect, but first take a closer look at the chart above. This is actually a snapshot of a ‘leftover chart’ which still shows some of the crazy lines I drew on the 25th when I was doing one of my internationally renowned (ahem) predictions for the yellow metal. On closer inspection it becomes clear that the Gold futures did EXACTLY travel the path I projected for it. Expect to see me on Opra and DeGeneres in the near term future where I will perform amazing acts of mind reading and pocket picking (preferably the latter).
Gold poised to fall below 800 soon.

So, can I double down on this? Only the future will tell - as far as I can see Gold had it’s chance for a respectable correction and should now take the express elevator to the basement level at first 720 and eventually 600.
And that’s all for tonight, folks. Berk and I will continue to post our favorite short picks in the coming days as things unfold. We both expect another more significant counter rally, perhaps starting as early as Friday or next week. So, don’t go all bananas about loading up on puts - make sure they are strongly defensible, so you don’t whipsawed out of the market again.
Cheers!
金币:
奖励:
热心:
注册时间:
2006-7-3

回复 使用道具 举报

 楼主| 发表于 2009-4-1 15:54 | 显示全部楼层
September 2nd, 2008 2:01 pm Intraday Update, Market Forecasts 42 Comments

What a massive reversal set-up we have brewing here.  Talk about strong and fast…just the way we like it.  Of course, we are still in need of our long awaited confirmation.  However, a 150+ point $INDU reversal, and a 30 point reversal in the NQ is huge boost to the bearish case.  $VIX was up all day, meaning that even though the market moved up huge on positive breadth, traders were scared.  Scared of what?  A new bull market?  Or was all of this action just silent short-sellers accepting the fate they had been prepared to receive?  I think the followthrough answeres that question.
$COMPQ has been great here lately.  Giving us some of the cleanest wave patterns since the last major decline, and continuing to lead the market.  The $COMPQ also has this tendency to “double touch” its 200 day moving average before becoming set on its direction.  Let me show you what I mean…

Notice that on this past move, the $COMPQ has touched 4 times, with 3 closes, right around the 200DMA.  I personally don’t care much for MA’s, but the institutional traders use it, and it gives a nice picture of relative performance over the past 6+ months.  To me, this market seems to know exactly where it is, and where it wants to be.  That doesn’t mean that the sadistic beast does not want to string along as many unsuspecting fools as it can, because it assuredly does.  It just means that “IT” is aware of its location.
Here is the short term chart.  An expanded flat could still be playing out in wave 2 that would lead to a lower low, followed by a push up to a higher high (below 8/15).  Given the magnitude of this reversal, I am more inclined to give the benefit of the doubt to the larger wave 3.

I spent some time last night and this morning highlighting some trades I though had nice potential.  Unfortunately, I had some technical difficulties getting onto the site last night to post.  Consequently, you are receiving this information now.
First off…FSLR.  Yes, it would have been great if this could have been posted last night.  Notice the nice BB squeeze.  This thing should move fairly quickly.  It is down quite a bit here, so watch for a retest, or play some other names in the industry.

GCI…One of my favorite surviving publishing companies.  If we can break a little lower, I will be the proud owner of some puts on this guy.

LFG is still bouncing along in its channel.  The drop back to prior lows represents a 50% decline in stock price, so this is nothing to take lightly.

Last but not least is a little gem from my IRA.  CCC broke out to new highs on Friday with nice, increasing volume.  I am a little skeptical, especially after today’s move, but I think this still hold some long term potential.  I would suggest some long-dated calls, or ever snagging a few shares since this guy is cheap.  BTW, it is a water ute, and should have lots of upside in the future.

One last trade that I have been eying that is finally deciding to make a move today is BIDU.  BIDU, and big brother GOOG, are finally looking to be breaking down.  I already own a small position in BIDU (and GOOG), but will be looking to add as the beasts get marched in to the slaughterhouse.  Feel free to join me while the options are still fairly cheap.

Steel continues to break down.  ZEUS, SCHN, STLD, and AKS continue to be great candidates.  Commodity relate equities are getting blasted today also.  Coal, Oil related, and mineral miners are being sliced up.  Check out GMXR, CNX, ACI, BTU, BHP, MDR, ACGY, FCX, etc.  Finally is the AG sector.  Looks like some of those long awaited break-downs have finally materialized.  CF, TRA, POT, MOS, MON, AG, BG all remain nice targets.
I will walk you through one more trade that I am going to take down today.  OI is looking mighty tasty here for a number of reasons.  I was looking for a push up towards 47.5-50 to complete the wave 2 retracement.  Right now, we have a massive shooting star (inverted flying (because of the gap) Jesus, as I so fondly call it), a classic reversal candle.  During this push up today, OI decided to push itself outside of the 2.0BB, and has quickly pulled back.  All of this is in the context of a larger H/S top preparing to unwind.

Considering the length and depth of the predicted pattern, one should either buy longer dated options, or take this as multiple trades.  Right now, I am inclined to start out with an OCT 40 put position, and be willing to see part at we get towards the neckline at 40.  Every 10% or so would offer an easy target with great profit potential.  I have been watching and waiting for this pattern because the 2 open gaps remain open into $26 and $20.  Either would represent a loss of at least 35%.  That type of move translates very well in an option position.  IV has also had the chance to move down, providing with nice cheap options for this move.
Finally, I will cover gold today since it has decided to be a great hedge this morning.  After a nice consolidation (i.e. Bear flag; I will accept bearish Pennant also) gold has decided to break beautifully lower.  By no means do I think this move is done, but I do think that it is presenting a nice bounce for us to get short with.  I will use GLD as an approximation of the futures (/ZGZ8).

Notice the nice flag/pennant break out.  Volume is with us today, needless to say.  The only remaining major resistance in this area, IMO, is the level surrounding 77 (GLD).  Once that level gives way, it is a short step into 72, and potentially into the 68 range.
I will leave you with those thought today, to ponder upon, until our sadistic markets start becoming masochistic.  I am patiently waiting for that personality to reveal itself.  And if it does not show, I will be on the phone to by institutional buddies to get there canes ready for a beating!!
Skål!
P.S. Before I could get this out, the NQ decided to breach Friday’s low, and continue to fall like an elephant being dropped from a jumbo jet.  I would love to place the Short term trend firmly donw here, and very much believe that is the case for the NQ, and even $RUT.  But until I can get all indexes to confirm, I will keep it at mixed…
金币:
奖励:
热心:
注册时间:
2006-7-3

回复 使用道具 举报

 楼主| 发表于 2009-4-1 15:55 | 显示全部楼层
August 29th, 2008 12:28 pm Intraday Update, Market Forecasts, Update 79 Comments

Financial markets are known to push people just past the breaking point before reversing strongly back to the larger trend.  This is perfectly normal for wave 2 behavior, which I believe is over at this point.  While our line in the sand laid forth on Wednesday was pierced to the upside, the utter lack of strength in our once leading indexes, the $NDX and $COMPQ, certainly beared watching.  As I write, the $NDX is down a little over 2%, while the larger $COMPQ is down just under 2%.  Yes, I know that DELL had bad earnings, that accounts for one stock.  Something else had to give to get the reversal in breadth, and price, that we have this morning.  For those of you who use pivots also, you might note that /NQ (Nasdaq futures) opened below the S1 pivot this morning, rallied up, and turned down from a little beneath it, a strong bearish sign.

This image represents a complete reversal in breadth from the past 2 days.  The chart below indicates that the price is confirming this reversal by breaking through the lows of 8/26, a previous 1st wave low.  As Elliott allows it at this point, the probablities of a corrective pattern taking us to a lower low is almost solely contained to an expanded flat.  As it stands now, that is still a possibility, as the market has only had 3 waves down thus far.  If this is the case we should be looking for around yesterday’s high for a target, as illustrated by the other chart below.

And the best working alternate…

On Tuesday I mentioned that everyone was watching FRE and FNM.  I told Mole yesterday that their momentum and/or rate of change was falling off a cliff, and that that was a strong bearish indication. Today, they have both finally decided to turn down.  While this is just one day, it ends the four day uptrend in which these stocks have almost doubled.  We need moves like that in a bear market, otherwise we would have nothing left to short.  While I wasn’t happy to see it, I am happy to see it coming to an end.  Here is a quick chart of FRE, 20day 10minute.  I used the most recent move down and up as a reference.  There are other highs that I could base this off of, but the implications remain the same no matter which high you use.  Notice the break of the trendline, the A=C equality, the retracement to the 23.6% fib, and the beauftiful gap rejection.

This is another chart I posted on Tuesday night.  While the major two that we have been watching (FRE and FNM) are breaking down, we need some confirmation by the rest of the sector.  As soon as the $BKX breaks that lower support level, we would have great confirmation in that the financials are moving lower collectively.

Lastly, I will toss out an interesting trade that I took yesterday.  This is not a recomendation to follow me into danger, but I think there are some interesting elements that combined to make this a high probability trade IMO.  I grabbed a small put position on MBI.  Let me throw up a chart, and I will walk you through my reasoning.

After rallying nearly 500% since it’s June lows, MBI gapped up and ran an astounding 30%+ yesterday.  It made a higher high on a slight divergence in the RSI.  It pushed outside the 20Day 2.0 Bollinger bands, as well as outside the 2.5 Bollinger band on a 100Day setting (not shown).  A move back inside either of these would be a fantastic reversal signal, as we are outside of the range of 95% of the past 20 days, and 97% of the action in the past 100 days.  That is a pretty good indicator that this rubber band is stretched to the breaking point.  I think this stock can easily head back to the $5 range in a short matter of months, as soon as it closes inside these levels.  As I said, I only picked up a small position yesterday, but here is why I did it…

Notice the IV in the back months.  100% for OCT and 133% for NOV.  These may seem very high, but looking at the average implied volatility, we would see that these levels are relatively low.  I also notice that by the end of the day, the volume on the OCT 14 Puts had pushed about 15K contracts changing hands on ZERO open interest.  This is a tell tale sign, while not always correct, it is a great indication of an explosive move. I ran through some quick calculations, and found that certain options could potentially double on volatility alone.  Then when you throw in a 60% loss or so in stock price, these things have fantastic potential.  Here is how they are trading today, with MBI down between 5% and 8%.  Notice the IV’s today…

With a vega of .02, a 50% gain in IV should translate to a $1 increase in option price.  That alone is a 30% to 50% move in option price depending on your strike.  I got a chance to get these options at a low IV yesterday, and it is much higher today.  Ideally, you would look to enter positions with a low IV, especially if in the past the IV has exploded above 200.  Typically, I do not trade options with IV over 100% because I trade OTM options, and that IV greatly affects the time value in my options.  I decided to go ahead and take this because I liked the set-up so well, and liked the “multiple streams of income.” (delta and vega)
That said, the market is treating the bearish case very well today.  In fact, given the action of $NDX and $COMPQ, the indexes I follow closest, I am forced to return the near term trend to down.  Almost everyone that I have heard expects the “big boys” to come back and squeeze the shorts out of the market.    Since that is what everyone expects, I am not surprised to see the market selling off hard today.  It should be an interesting day on Tuesday.
Hopefully this can spark some interesting discussion.  I would love to hear thoughts or questions.
Skål!
金币:
奖励:
热心:
注册时间:
2006-7-3

回复 使用道具 举报

 楼主| 发表于 2009-4-1 15:56 | 显示全部楼层
August 28th, 2008 11:53 pm Market Forecasts 14 Comments

I will apologize for my absence tonight, I had a few things come up.  This will be quick, but I will follow up with some more commentary during the day tomorrow.
As the market stands right now, we have breached Fridays highs on some of the indexes ($SPX, $INDU, $RUT), leading us to seriously question our wave 3 count.  Here’s what I mean.
$DJI

$RUT

While losing status quickly, the true EWT rules allow for a retracement of up to 100% of the first move down.  Any sharp turn down could quickly accelerate lower.
The probabilities of the near term bearish case are waning rapidly.  Any break of the uptrend lines of this rally (not shown) with conviction should be monitored closely.  Likewise, any push above critical levels should be viewed bullishly into the 12200-12400 range at this time.  That said, near term trend indicator is set to mixed (with positive overtones), while longer term remains firmly down at this time.
I will be back tomorrow with some longer term ideas that you might find interesting.
Skål!
Two Lines in the SandAugust 27th, 2008 8:39 pm Market Forecasts 54 Comments

I’m going to make things extremely short and sweet tonight as our comments counter indicates that the majority of our audience is either enjoying a week in the Hamptons or has simply walked away in disgust until after Labor Day.
I’m not going to sugarcoat it - today was not a fun day for the bears. I expected a little rally today, but low volume or not, the breadth was very strong and the bulls were in complete control. Even though we had a bit of a pullback late in the day, we closed not too far from today’s highs. So, the one question in your mind is probably where do we go from here. The answer is in the only chart I’m going to post tonight, which pretty much tells the story:
SPX in limbo land.

Tomorrow should be extremely interesting, as we are at a fork in the road on a short term basis. You know as Yogi Bera once said: ‘If you come to a fork in the road - take it!’ :-)  In all seriousness: If we wind up breaching the Friday highs we will need to completely revise our wave count, and in that case our upwards target on the SPX would be the area around 1350. Now, that is the scary scenario for us bears, but the highest probability remains a drop towards challenging the July 15 lows and that very soon. In order to put the bullish scenario to the sidelines we would need to breach the 23.6% line which marks the 1257 zone. Once we get there things should speed up quite nicely.
The one thorn in my eye is something that became more apparent when I was drawing the ‘fancy’ chart above. As you can see we have been spent a LOT of time inside 23.6% - 38.2% zone. It’s about time that we push outside of this ‘limbo area’ with some confidence otherwise this implicitly would defeat the wave 3 of 3 scenario. For the EWT challenged, let me explain: According to EWT this third wave down is supposed to be extremely violent and put the fear of God into those pesky permabulls. However, if we forget the wave count for a moment things are still looking pretty sideways as of now. Berk and I have been arguing about that point today and I concede that the wave count can be interpreted that we are moving down fast enough. But I personally need to see a bit more conviction - pre Labor Day week or not. At some point we are running out of excuses and need to see a monster drop that whipsaws the bulls for a change. That’s my personal opinion and I have tried to visualize my prospective in the chart above.
As a final point: The treasury yields ($TNX) actually finished down today after rallying up in the morning. We had the same situation happening yesterday, when I was looking at the treasuries after the market closed and liked what I saw as a bear (e.g. dropping yields = bad for market). However, in early morning trading they pushed up strongly and that in combination with futures in the plus (@ESU8, @YMU8, @NQU8) gave me a strong indication that the market was going to rally today.
So, my plan is to go to bed early tonight and get up 1/2 hour before the market opens (hey, I live in CA - I need my beauty sleep) to make sure that those yields don’t paint a rally again while I’m not looking. If you are short the market right now (and Berk and I are) and you see a situation forming where the futures and yields are pushing up ahead of the opening bell, then you might want to get ready to grab a hedge position to soften the blow (e.g. IWM, SPY, QQQQ calls). This will give you some profits to enjoy while you start closing out the short positions you don’t want to hang on to. In the case of Berk and I that’s a lot of negative delta to close out, so we plan to sacrifice a few chicken tonight to sway the market Gods to our favor. Be aware that we might see a fake-out as well - the market might push up, we back up the truck on some index calls, and then we bounce off the 38.2% line and trace back down to new lows. Hey, who said options trading is easy? Unfortunately there is not perfect answer right now and if we see a meek pre-market action to the up side tomorrow you might want to hold off with loading up on those calls until we do breach that line with confidence. After all, we are not that far away.
But enough with the doom & gloom - chances are we drop like a rock tomorrow and party like that until the weekend. But now you’re armed with a baseline of what to do when, so adjust your trading according to your personal risk/capital/exposure levels.
Cheers!

« Older Entries
Newer Entries
金币:
奖励:
热心:
注册时间:
2006-7-3

回复 使用道具 举报

 楼主| 发表于 2009-4-1 16:02 | 显示全部楼层
August 27th, 2008 12:16 am Market Forecasts 14 Comments

I am not one of the random speculators out there that is willing to believe that the market is being “held up” by any particular stock.  Or that their is one particular “shoe” that is waiting to drop, but I do think the action of FRE and FNM actually are on everybody’s minds.  While in some instances, this would be an argument against a particular wave pattern, I feel that the due to extreme herd mentality surrounding these issues, they are worth observing.  The orange lines on the chart represent an equality Elliott often speaks about in corrective moves.

The green channel is also used to identify corrective patterns in EWT.  I have drawn it using the first two highs of the pattern, and basing off of the wave B low.  Remember, we draw channels differently depending upon a corrective or impulsive move.  Last thing of note of the chart is the small scale fractal 1-2 which bears considerable similarities to this chart.
Here is the $INDU chart.  Not much new, the retest remains in place, anemic volume remains the norm, and today’s breadth was modest at best.  e, anemic volume remains the norm, and today’s breadth was modest at best.  While everything continues to support our view that a wave 3 is beginning to unfold throughout multiple timeframe, my personal “line in the sand” is 11,100 in $INDU.
Lowest volume trading day of the year!!

The $VIX is giving a nice retest of the break-out level I had been watching closely.  I will be continue to eye this for another confirmation that the trend is accelerating lower.  Either way, the fact that the $VIX close down 2% while the market barely kept its head above water is classic bullish optimism.
Here’s my view of the $COMPQ.  I have outlined two previous spinning top-ish candles that the $COMPQ displayed in the first move down.  My view is that we are in the second (right-most) box, and that we should speed lower.  The alternate view is that we are close to finishing an impulsive move to the downside, and should be prepared for a rally if indicators begin to point up.  The great thing about the location of these two candles is that they are accompanied by a gap lower.  I mentioned to Mole on Friday that the $COMPQ has a nasty habit of gapping away from it’s second wave peaks.  Finally, the 13EMA is about to cross the 30EMA to the downside, which has led to some serious declines the previous 3 out of 3 times it has occurred.  I do not use this as a trading signal, rather to watch the short and intermediate term trend.
$COMPQ daily "road map"

Let me close out by throwing up another chart I believe the mass public (at least those with some financial exposure) have seen frequently here of late, the $BKX.  Yes, I will finally toss the spotlight over to the current star of the world stage, the banking index.  Notice the orange trendline, and the 5 closes $BKX has had at or very near this level.  This index is sandwiched between a support level about to break, and both the 13 and 30EMAs.  Today’s high also represents the 61.8 retracement level of the move since the top in either April or May, the first of our typical targets. Volume has been “seasonly” decreasing, and we are about to have “good seasonal patterns” also.  What I see from the chart is a nice BB squeeze with the index positioned for a bearish break-out, to be easily confirmed with any volume.

Remember, patience is a virtue, and an absolute requirement for trading.  Confirmation is king, and he will be making his rounds soon enough!!
金币:
奖励:
热心:
注册时间:
2006-7-3

回复 使用道具 举报

 楼主| 发表于 2009-4-1 16:03 | 显示全部楼层
August 25th, 2008 11:41 pm Market Forecasts 34 Comments


What a difference one weekend can make. Friday turned into a major bear squeeze and anyone getting scared out their short positions probably kicked themselves by about lunch time today as the tape painted a complete u-turn on all averages, the S&P even dropping as much as to returning all gains since last Wednesday.


Market suffering from bad breadth.


As expected the market suffered from pretty foul breadth today, as no amount of Listerine was able to wash away the stench of a complete lack of buying interest (see ratios above). What’s interesting and a bit encouraging is that the NDX was leading the pack with a 31.7:1 decl/adv ratio today; and the Dow was completely flat-lining with not a single of its thirty stocks in the black.
A line in the sand has been drawn.

Let’s focus on the S&P tonight, as it’s painting an almost perfect short term Elliot Wave pattern and since it  tells the story for the other main indexes. The S&P futures chart above shows us that a ‘line in the sand’ for the bearish case has emerged around the 1294 area. For the $INDU that line hovers around 11,625 and for the $COMPQ it traces the area around 2,415. Should we push back up in the coming days and challenge or perhaps even breach this line, it would greatly diminish our chances that this is our wave 3 of 3 scenario. Implicitly this would also mean that we would most likely push up higher and re-test 1320 or even 1350 on the SPX again.
SPX in the process of painting a clean EW motive wave.

However, today’s tape made no single attempt at challenging that resistance line and immediately proceeded to the ground floor via the express elevator. I was previously mentioning how the S&P traced out an almost perfect Elliot Wave today: Looking at the chart above its a rare occasion to see the SPX paint an almost perfect motive wave; only to be interrupted from completing its 5th down by the closing bell (how rude - how about some overtime?). We usually don’t see such clarity at such short time intervals and that alone gives additional credence to where we are heading, which is down. In any case, the inability to continue Fridays challenge of our support line makes a strong case for a continued bearish trend and we expect to soon revisit the prior July 15 lows on all averages.
Treasuries pointing the way forward?

But it wasn’t just the equities that took a heavy beating today - almost everything was going South today: Sweet crude and Gold were both down as were the 10-year Treasuries yields, falling to 3.79%, matching levels from early May and July. Despite the headlines in the news indicating that the equities managed to drag down the treasuries today, it was actually the other way around, as the early morning action in the treasuries gave us an inkling of were the rest of the market would be heading today. In that context I came across the following quote today on Bloomberg:
“I’m bullish on Treasuries now because of the economic situation,” said , chief manager for fixed income, equities and currencies in Tokyo at Mitsubishi UFJ Trust & Banking Corp., part of Japan’s biggest bank. “The housing market is sluggish and the financial institutions in the U.S. have many, many problems. There is no fuel for the economy.”
Bando-san is spot on with his analysis - as the market is extremely cash starved right now. But what’s even more important is that the treasuries are hanging by a thread, as apparent form the chart above. We are in the process of dropping through an important resistance zone and our next stop should be somewhere around 35.75 - there’s not much to hold them up unless banks suddenly start lending again. If today is any indication as to the correlation between the treasuries and the equities market, this adds another piece to the puzzle for both our short and long term bearish outlook.
Gold bugs at the beach this week.

It wasn’t a big surprise to us that Gold didn’t move much in either direction, although those folks over in the ‘market/gold correlation camp’ have to explain to me why Gold was down while the market took a beating. Those poor Gold bugs who I (almost) pity, are currently consoling themselves by rationalizing the action of the last few days as ‘base building’. However, I expect a push towards the 855 level to soon put an end to this consolidation period, followed promptly by another rapid drop back down to below 800 and then some. I think we should call this period in Gold as its ‘Rodney Dangerfield Phase’ as the precious metal ‘just can’t get no respect’. It’s even possible that we might see an immediate drop from right here - I would give both scenarios a 50/50 chance right now.
The only regret Berk and I have about last Friday is that we didn’t load up on even more index puts when the markets started topping out. Today, those puts were paying us handsomely as we had loaded up on FOTM options which are now accruing negative delta on the double. That makes exactly the point I have been driving at all last week: Forget about day trading at this point - yes, the market is still whippy - but this is not the time to focus on short term gains. This is the time to leverage bullish retracements as buying opportunities for strongly defensible short positions. Those puts we bought on Friday have stops sitting above that mighty ‘line in the sand’ - if we breach that one the jig is up anyway. But unless this happens we’re sitting on some mighty strong resistance here. Shame on you if you did not take advantage of that - it took a bit of courage - I give you that; but in the end everyone following our postings should have been very familiar with that long standing vertical resistance/support line and should have recognized the apparent inability of the market to breach it. I think even Jeff Kohler over at OA and Tim Knight on the Slope of Hope have had postings to that effect.
The market will always do its best to scare you out of even your best positions. That’s where a solid trading system comes in, something that Jeff over at OA has put a lot of work into conveying to his community. We won’t try to emulate his example and would like to refer to his blog for excellent insights on how to structure your trades and to pick entry/exit signals which are defensible and have the highest probability to bank some coin. Our approach may be more long term, but the general idea is the same.
Finally, the  this week is packed - we have a bunch of market reports coming out, at least one every day this week. One that keeps me awake at night are the FOMC minutes - it seems no matter how bad the news are the Feds are always good for at least 150 points on the Dow. Whatever happens - I suggest to keep cool and use the occasional spike up to ‘build your case’.
Cheers - and may the market have mercy on your account tomorrow.
金币:
奖励:
热心:
注册时间:
2006-7-3

回复 使用道具 举报

 楼主| 发表于 2009-4-1 16:04 | 显示全部楼层
August 23rd, 2008 12:10 pm Market Forecasts 114 Comments

Let me start out by saying that Friday’s action could have been better, but it could have been a whole lot worse.  The markets pushed up in the larger retracement that we had expected, though not preferred.   The $COMPQ moved up into the range of the previous 4th wave, filling the gap of 2417 in $COMPQ.  This is a good sign my friends, a good sign.  We also have retested the break-out of the up-sloping trendline, but have not been able to get back above it at this point.  Another indication that the larger decline should be quickly accelerating.
While certainly not my favorite scenario, today’s action certainly has some strong points for the bears.  One is the filled gap I discussed earlier this week, there remains only 1 upside target in the $COMPQ if it is to remain below it’s 8/15 high, and that is the range between 2430 and 2445, which represents the 38.2% and 23.6% retracement levels.  As previously noted, the $COMPQ prefers to spike its targets, so the upper level is where I will be watching closely for a reversal.  The blue lines are common EWT targets for wave 2 retracements as far a pattern standpoint, as well as the fibonacci retracements.

Second is the volume.  What volume you ask?  That is my point, “What volume?” Don’t tell me it is a seasonality, that is a load of crap.  Just look at last year in August.  On the $DJI that is the highest volume August on record.    Today was about tied for the lowest volume day of the year…with yesterday.  And one of the lowest volume days since 12/24/07.  Speaking of that date, Christmas Eve represents a great fractal perspective.  Of the larger first wave, termed (1) in the proper Elliott nomenclature, 12/24 is in the same place we suspect this market is in right now.  That is, a 1-2, i-ii.   Our location is very similar, except inside wave (3) rather than (1).  When you combine the placement, as well as the large scale volume contraction, the markets appear quite ready to fall from near-current levels.  The bulls will tell you otherwise, and I cannot say that the breadth today was not overwhelmingly bullish.  I can only tell you that this 200 point move up in the $INDU, was met with no fear and made by no volume.

A nice picture of the retest…

The third point is my favorite.  Yes, you guessed it, the $VIX.  This little bugger is fantastic for marking reversals.  It is not screaming as loud as Mole’s first born that was auctioned off at a poker game, but it is clearing its throat.  I suggest you take a nice look at this, even take a picture of this chart, because it comes in handy.  The red circles are confirmed sell signals, the most accurate of the $VIX signals, while the purple circles are unconfirmed sell signals.  Notice there are not very many purple circles.  The green circles are confirmed buy signals, while the teal circles are unconfirmed buy signals.  There are more unconfirmed buy signals than anything else on the chart, and the total buy signals (confirmed or not) out number the total sells by nearly 2.5:1.  Just ignore the large red lines right now, as they remain on the chart for overlay purposes.  Horizontal lines are important S/R points, and the lower channel is what I refer to as the “bull-market” range.  

That said…I leave you this weekend with a beautiful fractal relationship in both the $INDU and the $VIX, as well as being .25 points from pushing outside the 2.0 BB, which would be the first inclination a sell signal is brewing.  We do not need a sell signal to start this leg down, but it would be the ultimate in confirmation.  If and when this does happen, I will go over the requirements for confirming the $VIX signals.  I also leave you with a stong advance on no volume, and a push up into our reversal range, as well as a retest of the break-out line.  All things considered, we should have an intersting next week or two.  Stay posted as we will certainly keep on top of this.
Enjoy your weekends, I will be enjoying mine…
Skål!
金币:
奖励:
热心:
注册时间:
2006-7-3

回复 使用道具 举报

 楼主| 发表于 2009-4-1 16:05 | 显示全部楼层
August 22nd, 2008 12:04 am Market Forecasts 89 Comments

Tonight’s post is dedicated to Tim Knight - fellow bear and ‘friend of the blog’ - who also happens to run our favorite blog called . Well, who am I kidding - most people reading this probably came directly from his site, as Tim generously allows us to place links to our measly web presence. At the rare chance that you haven’t heard of Tim - go visit  (after you finish reading this of course ;-))
Now, there’s a second reason for tonight’s theme, as it aptly describes the general context of where we currently are in the market as well as where we are heading. It has been said that markets ’slide on a slippery slope of hope’ and ‘climb upon the bricks comprising the wall of worry’. There is a lot of truth in this expression, as history shows over and over again that the human capacity for denial appears to be almost infinite. Maybe this chart will demonstrate the point I am trying to make:
Where is the fear in this market?

So, it’s 2005 and you are sitting in your local watering hole sipping on your favorite glass of lager. Some bloke walks in, buys you a beer, and then starts telling you that he’s got psychic powers and that he can tell you the future up to three years in advance. Just ask and he’ll tell you anything. Of course you don’t believe a word he’s saying but hey, it’s free beer so you play along. ‘Okay, how’s the economy in 2008 and where are the markets heading?’ He responds: ‘We’re in a recession and banks are going out of business one after the other. The Feds are bailing out some of the biggest investment banks to the tune of billions; are printing money like there is no tomorrow, and Freddy Mac and Fanny May are insolvent and are about to get nationalized. Oh, and something called the VIX is below 20′. ‘Yeah right’ you think to yourself - ‘I like free beer but this guy is out of his mind.’ Then you ask him what he’s smoking there…
Seriously, would you have believed that guy a few years ago? Well, I probably would have, but I’m a sucker for tall tales as well as an evil speculator, so to me 2008 would been something to look forward to. After all - when there’s blood in the streets - buy property. But it’s not surprising that most of my contemporaries wouldn’t share my sentiment. Because people want to believe that tomorrow is going to be better than yesterday and that a ‘golden future’ awaits them. If you tell them that we’re heading for doom and gloom they will most likely hate you for it, which is why in the days of kings and queens the ‘bearer of bad news’ was also often the recipient of an untimely demise. Nobody likes a party pooper - especially when it comes to money and the financial markets.
So, where are we? Let’s start with the S&P this time:
Bottom floor, please!

The S&P didn’t put up much of a fight today - although it managed to climb a 1/4 of a percent the breadth at closing was a feeble 1.03:1 - basically on par. As I have pointed out on previous occasions, each consolidation rally (if we can call the last two days a rally at all) is now exhibiting diminishing breadth ratio and volume percentage. Which is exactly what happens in a Minor 3 wave of Intermediate 3 - rapid and accelerating drops interrupted only by short and anemic retracements.
A bit more detail for the EWT nerds.

The hourly chart shows the retracement of the past few days in more detail. It’s a bit premature to count those short term waves accurately but it looks like as if we have been tracing out a 1,2,1,2 pattern at this point, which means that ‘wave 3 circle’ is about to paint it’s 3rd leg down. But there’s of course the chance that we might push a bit more higher, which would be healthy for the bearish case - after all nothing goes down in a straight line. 1287 -1290 would be a possibility here. For the trip down, Berk was so kind to donate a chart with some targets:
Some preliminary targets for the SPX.

Moving on to the Dow - which again was pretty anemic today:
The index that tried to rally, but couldn't.

The breadth in the $INDU (shown below) was 1.14:1 - and it’s possible that we might see a bit more consolidation here. If that happens my target is 11,550, which is the 50% fib line from its prior wave.
The Dow cash index in more detail.

On to the Nasdaq - remember how it was leading the market in the past few weeks? Well, as the saying goes: the higher they climb the deeper they fall:
Nasaq leading in every direction.

I’m skipping the futures tonight and am only showing the cash index ($COMPQ). We measure the $NDX breadth however, which closed at a breadth of 1.94:1 negative - it seems that Nasdaq wants to lead in every direction.
Gold ready to roll over.

Gold made some progress in the consolidation department today and touched my first target of 940, which led me to bulk up on some GLD puts. Yes, it’s entirely possible that we’ll see 960 tomorrow but I’d be surprised to see a push higher than that. As many of you have learned the hard way - the real action in Gold  happens mostly overnight as its futures are now traded almost 24×7. Check out this link:
http://www.kitco.com/charts/livegold.html
What you will see on the bottom on the main chart is something called ‘New York Globex’ and ‘NY Globex’. These two didn’t exist until a few months ago and were added without much fanfare sometime in April, if I recall it correctly. By pure coincidence this also was the very day that a huge Gold take down occurred - overnight of course. Coincidence? Yeah - probably In any case, we ‘mortals’ don’t get to trade during those owl hours, so when it comes to Gold and its related ETFs such as GDX or GLD you have to make your bet between 8:20am EDT to 1:30 EDT (which is when COMEX Gold closes for the day). My risk assessment here was that puts at this point are defensible as I am expecting a large drop from here, plus I don’t expect a lot more ‘damage’ than 960.
That’s it for tonight -I can’t believe tomorrow is Friday already - time flies when you’re getting whipsawed. Don’t worry, plenty of fun straight ahead - but in order to partake, make sure to get yourself positioned during those up days.
Cheers!
金币:
奖励:
热心:
注册时间:
2006-7-3

回复 使用道具 举报

 楼主| 发表于 2009-4-1 16:06 | 显示全部楼层
August 20th, 2008 11:43 pm Market Forecasts 82 Comments

Fairly uneventful day across the board.  Stocks rallied in the morning, dipped down around lunch, and decided to rally into the close.  Not much gained or lost today.  Yes, today was better for the bearish case than a 200-point up-day (which I would gladly take at this point), but not as nice as the blood in the streets we have been calling for.  But as I said, we cannot fall straight down.  Nor can we manage a continued trend at this point.  If we fall tomorrow, we will be closely watching for a slightly stronger retracement, targeting 11550-11600 in the $INDU, which would give the bulls the confidence we need to drop.  Conversely, closing beneath 11100 with some strength would be a clear confirmation.
But let me step back here.  Mole spoke last night about the minute and minuette scale moves that are going on right now, so I will talk about the larger degree moves that are unfolding.  As long as the 8/11 highs in the $INDU (11867.11) and $SPX (1313.15), and the 8/15 high of 2473.20 in the $COMPQ are not breached, it will be down-hill from here.  We have completed a very large scale (1) and (2), as well as an intermediate 1 and 2, which has the stages set for intermediate wave 3 of the larger wave (3).  Yes, this is where Elliott Wave Theory can become complex due to it’s fractal nature.  The entire wave (1) down in the $COMPQ took 138 days, while its component waves 1 and 2 took 27 and 15 days respectively.  Wave (3)’s component waves 1 and 2 have taken 40 and 30 days so far.  A rough estimation would give the larger wave (3) an expected time range of 207-223 days.  That would have us nearing the a potential bottom of around 1400 by this December to January of 09.  This $COMPQ chart is constructed using the slopes of past moves so I don’t get that “but that is straight down.”

A number of indicators still support the case that this decline is still in its developing stages.  RSI break-outs have occurred across all indexes.  The $VIX was down sharply today which means, despite a 100 point (high to low) drop in 4 days in the $COMPQ, people are not scared.  In fact, this is one of the tell-tale signs I have been waiting for.  What we are really waiting for here is a nice move lower with some volume.
And now I will step back again and give you another view.  This is a LONG term view of $SPX (actually, two) that will help you understand the scope, and can get my targets on the chart.  Again, I have only preliminary targets on the charts (now that they will fit).

Here’s the other (this one covers only 30 years)…

So, whether the $COMPQ decides to fill it’s newly created gap @ 2417 or not, the end result is the same…starkly lower in a rapid decline.
So…how long does it take paint to dry?  If this is wave 3 working its magic here, the tape should start peeling away very soon.
Skål!
金币:
奖励:
热心:
注册时间:
2006-7-3

回复 使用道具 举报

 楼主| 发表于 2009-4-1 16:07 | 显示全部楼层
August 19th, 2008 11:26 pm Market Forecasts 51 Comments

There is one question in the mind of all bears tonight, which can be summarized as follows:
Is this one for real?
In the past few weeks since the July 15 bottom we have rarely enjoyed more than two or three days of continuous downside momentum.  And judging by various comments and postings I came across today the consensus at this point seems to be that an upside correction tomorrow is almost guaranteed. After all, this is the kind of rhythm we’ve gotten used to: two steps up - one or two down - and then one or two up again. And all that blended with a healthy dose of sector rotation.
Which brings me to tonight’s title - it is apparent that we are about to ‘cross the rubicon’. What I’m getting at is that no matter which type of charting voodoo (EWT and others) you throw at the current scenario, we are at an inflection point that upon crossing would leave little doubt in anyone’s mind that the mind numbing bullish consolidation of late has come to an end, and that the long journey into the abyss (i.e. Dow @ 10,000) is in full swing. Having painted the picture a bit - let me now present my case:
Dollar weakens.

Let’s start with the Dollar tonight. As anticipated we saw the beginning of a medium term consolidation today, even though Prophet charts again paints a faulty candle (I have tried to approximate what I saw today before the close - so please forgive me if it’s not spot on). A rough target for the bottom of this down wave would be 75 - 75.5. Similarly, the Euro reversed course today and started to shoot higher after crude oil starting climbing its chart.
Gold in consolidation.

As expected Gold was able to drag itself into 2.5 Std. Dev. territory in after market trading after a positive day. I’m shooting for about 840 - 845 as our turning point. Again, expect considerably more weakness after we roll over.
Silver in selloff limbo.

Silver continues to be extremely oversold, which at this point is a bit of a mystery to me. Referring to the chart above: it’s obvious that we are still way outside the 2.5 Std. Dev., which is ‘unnatural’. I expected a lot more conviction here in terms of buyback action - my only guess would be that we are still experiencing heavy liquidation by some (still) unnamed hedge funds which are forced to sell massive amounts of contracts at unfavorable prices. Keep your eyes on the news ticker for some pertinent headlines.
S&P beginning its downtrend.

Now on to today’s market action in the main averages. The S&P made quite a bit of progress in the last two days, managing to breach the vertical lower support line (shown on chart) on Monday. This morning we saw a strong move down followed by mostly sideways action for the remainder of the day - frankly I would have preferred to see a stronger sell-off. Nevertheless, breadth in the S&P at close today was a negative 4.5:1 which continues to strongly support the bearish case. I do expect a brief consolidation, probably at the open tomorrow morning before we head further down. As mentioned in previous discussions - if this is indeed Minor wave 3 down expect it to be fast, long, and furious. Thus, on a preliminary basis I am numbering the first two waves as Minuettes (i) and (ii), as I strongly doubt that this constitutes the higher progression waves Minute i circle and Minute ii circle. A Minor 3 wave of Intermediate 3 is one of the strongest and most violent motive waves known in EWT, and in my mind what we are seeing here is nothing but a gentle preamble of what’s to come. So, it seems that we are currently in the process of tracing out Minute 1 circle of Minor 3. BTW, the same reasoning applies to the Nasdaq and DJIA charts below.
Dow continuing on bearish course.

The Dow is almost mirroring the action of the S&P right now and continues its bearish course downwards. Breadth on the $INDU at close today was a negative 8.3:1 and strongly supports the assumption that we are tracing out wave 3 at this point. I however need to see 11,200 breached, hopefully by the end of this week, before I can completely dismiss the possibility that we are in a continuation of wave 2.
Nasdaq supporting bearish case.

Extremely encouraging was today’s breadth in the Nasdaq 100 index ($NDX), which closed at negative 5.5:1. The Russel 2000 closed at a breadth of negative 3.9:1 - thus strongly indicating that the two leading indexes are now following in the footsteps of their currently weaker siblings.
In summary - what we are looking for now are continued sell offs interrupted only by brief (but often sharp) consolidation periods which should last one day or less. If we start going sideways from here again, in a similar fashion to what we have been experiencing in the last four weeks, we would need to re-evaluate the short term bearish case. However, at this point the probabilities are clearly in favor of a continued drop downwards, the pace of which should accelerate rapidly. Use the occasional rebound to load up on defensible short positions of your liking. Berk and I will surely keep posting our favorite picks here, so stay tuned and drop by regularly. In that context may I suggest to keep a very close eye on heavily overbought sectors (e.g. technology or financials) for potentially profitable counter trade plays in the days/weeks to come.
I am setting the short term indicator to mixed for tomorrow as I am expecting a brief push upwards in all four indexes before we head back down again. I don’t recall there being any crucial reports scheduled for tomorrow but any bad news (e.g Russians bombing Georgian pipelines) could of course lead to an immediate drop down. The long term indicator stands at a down trajectory.
Let’s have some fun tomorrow and don’t get scared out of all of your short positions if we see a pullback. Remember that the goal here is to find defensible positions at resistance zones. The name of the game is to plant your flag and prepare for several weeks of nasty downward action. The day trading approach we were forced into in the past few weeks will surely yield short term results, but would defeat a potentially very profitable long term strategy of riding strongly defensible short positions during the course of several weeks. In closing I would also like to propose that you consider FOTM (far out of the money) options, or at least grab a small amount of FOTMs in combination with OTMs and/or ATMs (depending on your trading style).
Cheers!
金币:
奖励:
热心:
注册时间:
2006-7-3

回复 使用道具 举报

 楼主| 发表于 2009-4-1 16:08 | 显示全部楼层
August 18th, 2008 9:34 pm Market Forecasts, Update 87 Comments

Most likely, yes.  Positively, no, we have not recieved all of the signs we were awaiting.  But, on a lighter note, we have registered enough to be able to comfortably call the decline in place upon further weakness.  You follow?
Let me review…We have the $VIX turning up from a bounce off of a minor resistance, that’s bearish.

We have a nice retest and a turn up in call put ratio, that’s bearish too.

We have the $SPX and $INDU, and a horizontal trendline in $SPX.  That’s a two-fer today, and that’s bearish.

Those of you who know me, know that I keep a real close eye on the breadth, measured by advancing and declining issues, of the major indexes.  Today was a beautiful sight when glancing at my daily “breadth-o-meter.”  Here’s what I saw today.  By the way….it’s bearish!!

Notice the two blue boxes.  The first one is breadth, read as a straight percentage for negative issues (i.e. $INDU had 100% negative breath, all issues were declining).  Anything over 3:1 in either direction is major, and we were sporting about 4:1 negative across the board today.  The second blue box is a volume ratio.  The larger the number, the more negative the volume.  Notice the 120%+ on the $OEX, can someone say “large scale liquidation?”  What a great day to start the week off.
Let me finish by clarifying my timeframe of the earlier targets.  This targets should take a couple of weeks for the markets to reach, not likely extending past 2 months.  And, as I stated earlier, these represent only preliminary targets, and the final resolution targets remain significantly lower.  Lastly, the market rarely moves straight in one direction…be prepared for some wild whip-saw rides as we come crashing down, and keep in mind that the steepest rallies occur in bear markets.
So I leave you today with a quick haiku, as we are simply waiting for one last confirmation.
Lone bear atop a
hill - waves crashing below.
Furious beauty.
Skol!
金币:
奖励:
热心:
注册时间:
2006-7-3

回复 使用道具 举报

 楼主| 发表于 2009-4-1 16:09 | 显示全部楼层
August 18th, 2008 1:53 pm Intraday Update, Market Forecasts 19 Comments

So it appears, as usual, that the financial markets are divided into our standard two camps, bullish and bearish.
Over in the bearish camp, where, as many of you know, I have been firing up some high-quality bison burgers for my bearish brothers. I have the hammock tied between two select trees, and I have my bug screen firmly tied over my picnic table. What is there left to do but wait and bask in the coming glory that is the sunshine?
Meanwhile, across as river, and up the mountain are the blundering bulls. Notice that the bearish camp is waiting patiently, while the bullish camp, which includes the financial media, most traders, almost all investors, and quite a few well-respected newsletter writers/blog hosts. Maybe there are just so many people in that camp that they have to mull around, but I think they are really busy trying to take every ‘little’ upward rally as another excuse to try to catch the moon. The bulls are antsy. They ‘know’ that we have been making higher highs and higher lows.
What they don’t know is that while we having been rallying higher, we are still below the Jan. lows, and barely could muster the strength to touch the underside of the March lows. Perhaps the market is just making sure previous support is now resistance?!?

Given today’s action, I am starting to see some movement in the bearish camp, and with good reason. I am sure some of the bulls would like to call our “sit and wait” method complacent, but the real complacency is in the people that are still bullish after lower highs and lows. See, as far as my bearish stance goes, I knew that the $INDU could push as high at the 12250 level. In fact, that was my first target, but I had to lower it considering the utter lack of strength in these rallies. So, if anything, I have a reason to get excited.
With the $INDU down about 180 points, knowing the location of those pesky upward-sloping trendlines, and knowing the time proportions I laid forth on Thursday are ringing quite true at the moment, things are looking good. The $VIX, while not issuing the standard jewel of my eye, the “sell signal,” I think it is safe to say that the intra-day H/S top was not real or is not going to play out.

Here’s a chart of where we stand with the trendlines…

So, the long awaited question is targets. How far will we fall? How fast will we get there? Do you really think $INDU will break 10K? The answer to the last one is abso-freaking-lutely!
Here’s what I have drummed up thus far. Please note that these targets will continue to get refined as I continue to get data. But as of the wave 2 top, which occurred on 8/11 in $SPX and $INDU, and $COMPQ on 8/15, here is what I have.
$INDU = 10777 is a first target. Short, sweet, and the July lows!! If this is wave 3, the highest level the entire pattern should end at is 9558.13. As far as time goes, this decline should be swift and persistent, likely chopping of 10%+ in a matter of weeks. When more form develops, I will be sure to key everyone in on probable time scenarios. At this point, let’s just concentrate on getting into some bearish positions before we get left behind.
$SPX = 1212 for a first target, expecting a push to test July lows! As it stands right now, $SPX has a strong confluence of fib levels at both the 1150 and 1050 ranges which would represent additional near term targets. For the $SPX the highest level final target would be 1073, which would be around the 1050 range.
$COMPQ = 2252, which targets the mid-July consolidation. This target is a little off in position when compared to the other indexes, and hasn’t completed enough smaller wave for me to feel comfortable offering a different target. The highest point this move can stop at is 2089, which is just below the July lows. I see us falling much farther than that, but at this juncture, that is where we stand.
Did anyone notice the classic evening star pattern on the $COMPQ, or is that just me?

If you have been watching, we have been throwing out little tid-bits here and there. For those that have followed astutely, BOOM, BIDU, and CME have all been performing nicely today. NIHD is ripe for the picking here too, but wait for confirmation.
This is just an intra-day update. Yes, I know, tons of information crammed into an intra-day update, but don’t worry. I will be back this evening with our standard follow up. Until then, enjoy this slide!!
Skol!
金币:
奖励:
热心:
注册时间:
2006-7-3

回复 使用道具 举报

 楼主| 发表于 2009-4-1 16:09 | 显示全部楼层
August 16th, 2008 7:29 pm Uncategorized 89 Comments

It’s sunny in Los Angeles today - not a cloud in the sky and the temperature is in the lower 80s - very little smog - call it a perfect day. What do you expect - it’s summer in California and people are streaming to the nearest beach to pursue their weekend pleasures. Los Angelinos love to sizzle in the sun for that perfect summer tan (mixed with some early stage skin cancer), take a stroll down the strand, or take that Jet Ski for a spin, assuming they can still afford the gasoline that makes it run.
But little do they know that a perfect storm is brewing - not above in our skies, but in the domain of our economy and hence in our financial markets. If you are a trader and happen to be on the bullish side of the equation you would most likely disagree. After all, the Dollar is up up up - the Euro down down down - Gold has been beaten to death - the Nasdaq has been steadily pushing up for weeks - and Crude has been tanking. Life is good again, right? We’re back with a vengeance and it’s back on Easy Street.
Well, today’s posting aims at bursting that bubble - and no - we’re not sorry because the inherent profit potential is humongous. The last two weeks could be described as the proverbial ‘quiet before the storm’, which has given the permabulls plenty of confidence, signified by a sinking VIX, which is at last count has receded back into bull territory (19.58). But as the evil speculators that we surely are, our job is to look beyond the obvious which drives the herd of clueless investors from which we derive our ill gained fortunes. So, without further ado, let me paint next week’s picture for you:
Let’s start with my usual S&P futures chart:
S&P running out of steam.

Pretty similar to a few days ago. ‘Timid’ would be a good word to describe the last few days of trading in the S&P futures - ‘going out with a whimper’ would be a fitting label on this chart. As I indicated in my last post (and I will spare you the boring details today), as prices have been chugging higher, each step up has been weaker than the prior in terms of its momentum. This can be measured by the a/d ratio, the peak upside volume, or an indicator I recently started to appreciate, the force indicator:
Divergence between momentum and price.

As is blatantly obvious from the chart above, this push up is running out of steam as it is a textbook counter-trend rally. What’s fascinating is the lackluster performance of the financials and banks, which although having enjoyed every iota of relief action made available by the Feds, have been running into resistance, and since then have languished. Sometime next week I expect the triangle support line shown in the first chart to be breached with confidence, thereby initiating the signal for us hungry bears to circle in for our first feast. Things should transpire quickly at that stage and on our end it will represent the signal to start loading up on short positions. The astute reader will notice that I have swapped the ‘most likely scenario’ to down, although we don’t want to discount the possibility that by some unholy market manipulation (i.e. continuous Dollar loading by the ECB, the BOJ, and the Chinese), we may see one last push up to the 50% retracement area around 1320.
You can run but you can't hide.

The Nasdaq has been the darling of the bulls as of late, mainly lifted by the technology sector, but even it is running out of steam. A breach of 1920 will signal that the rally is over and the downtrend is resuming. However, I won’t lie to you - the Nasdaq has been a thorn in my eye. Then again, as the saying goes - a diverging market is an unhealthy market, and given the factors I will discuss below it seems that this rally is destined to end.
Dollar over-extended to the max.

Which brings me to the Dollar. Don’t let the ‘fancy chart’ confuse you - what you’re seeing is a Bollinger band set to 2.0 and 2.5 Std. Dev. Not surprisingly after such an explosive action, the Dollar has moved FAR outside the 2.5 Std. Dev. boundary - I even checked and it is actually bordering the 4.0 Std. Dev, which could be described as being ’stretched to the max’. Incidentally, the same applies to the Dollar’s currency nemesis - the Euro. I have never seen a commodity, equity, or currency remain that far extended for that long, which is indicative of some artificial buying by some big players (i.e. the ECB and the Swiss Bank) - this kind of action does not occur ‘naturally’. In addition, EW theory also dictates that we need to see a retracement here very soon, probably starting early next week. So, expect the Dollar to start retracing and the Euro to start gaining over the coming weeks. In the long term the Dollar will continue its path upwards, but for now this wave seems to be in its final stages. Similarly, the Euro is destined to continue to depreciate against the Dollar, but in the short term we expect it to surge back up. More details on those targets once we see both currencies embark on their corrective waves.
Gold craters.

I have to admit, evil speculator or not, I feel bad for those poor gold bugs. This is a similar chart as the one I have shown for the Dollar - after yet another brutal drop Gold is currently stretched to the max and is bound to slingshot back starting Monday or Tuesday at the latest. Don’t get me wrong - the Bear isn’t done yet with Gold and in my last posting I predicted 720 as the next stop. However, I was a bit hasty to read the short push up to 840 as the completion of its consolidation, and after Friday’s precipitous drop we will need to see one more push up to around 840 to 850 before we will consider going short again.
Silver oversold to historic levels.

The other (now less) precious metal, Silver (ZIZ8 in TOS) , appears to have completed its 5th wave down after losing 11% overnight. I suspect that after the dust settles we will see some headlines that several large hedge funds have been forced into liquidation and had to blow out all of their positions. It is ready for a rebound VERY soon - most likely starting Sunday night. However, as commodities often tag on an ‘extension’ to their 5th wave, there is a possibility that we may see some further weakening. I do have some doubts in that respect however, as Silver has been shot to hell in my mind and is stretched like a rubber band. It is so oversold at this point that its disparity index has reached negative levels we have not seen for a quarter century. Gold is in a similar situation, but not as extreme. But the big picture here is that both precious metals are ready for a correction, so if you are holding short positions I would recommend exiting Monday.
Now, at the beginning of this posting I was talking about the ‘perfect storm’ that seems to be brewing. Now let’s put all the pieces together and see if we can’t project forward a little to see what the near term future will bring: We have a market that’s divergent and which is running out of steam. We have Gold and Silver - stretched to the max and ready for a rebound. We have the Dollar completing its wave up and ready to consolidate back down - and the Euro ready to bounce back from its oversold condition. And expect Crude to bounce back a bit as the Dollar drops and Gold is consolidating. Does that sound like the straw that might just break the camel’s back?
What I’m getting it is that we all know that this bear market is just in its beginnings and had it not been for the incessant but expected meddling by our esteemed ‘plunge protection team’ this consolidation period would have been short and sweet. But as I’ve said before - you can run but you can’t hide - the market is a cruel mistress and it ferrets out the weak whilst mercilessly imparting its justice. The entire financial sector is being held together by scotch tape right now and a tumble in the Dow and the S&P will be all that’s needed to rip off the band-aids and lead to a barish escalation. This is where we come in. What gives us scavengers of the financial world an edge in times like this is that we are ruthless realists who will have zero compunction about leveraging any unfair advantage. After all, the bulls had their month in the sun, but this summer vacation is coming to an end and hell just froze over. Oh, and before I forget it - remember that the VIX is in the teens right now and our put options are going to explode once volatility kicks back in.
Let’s have some fun next week and bank some mighty coin. When it’s all over and done by the end of fall, let’s all meet in Vegas for a Dow 10,000 party. Which reminds me - LVS, PENN, WYNN, etc. will be excellent candidates for short positions once things get rolling.
Cheers!
« Older Entries
Newer Entries
金币:
奖励:
热心:
注册时间:
2006-7-3

回复 使用道具 举报

 楼主| 发表于 2009-4-1 16:11 | 显示全部楼层
August 14th, 2008 11:12 pm Trading 23 Comments

Every day we churn higher on lagging breadth and volume is a day closer to our long awaited top. Don’t believe me, check you local A/D line. Here’s mine from the leading index, the $COMPQ.

Notice how the rise leading into the June peak had 3 periods of lagging breadth. Here we are set up again to have 3 new highs on weaking market internals. Even the MACD is sporting a nice divergance. Not much else to be said. As long as the markets keep under their vital levels, or push ever so slightly higher, our forecasts remain intact. I don’t expect anything tomorrow, due to expiry, but a small few time indicators suggest a change in the next 2-3 trading days. Keep in mind that a large number of recent reversals occured within a few days of expiry. I’m keeping a close eye on all of our indicators, and we will pounce once we get our signal!
That said, aside from loading up on puts in an index ETF of your choice, I will outline a few sectors that are going to be very weak once the shit hits the fan…which should be very, very soon!
While shorting the banks, specifically C, is still a great trade in my book, I am focusing on things with a little less risk of being bailed-out. The first sector on my list is the UTES, excluding water utilities as these have a solid fundamenal backing. The $UTIL was supposed to be in a (non-Elliott) “supercycle expansion” that should have gained around 400%. This happens about once every 30 years, and we did jump from 162 to 555, sporting a healthy, but sup-par 340% gain. That should be enough to satisfy this cyclical move. I think as people start “going green,” (i.e. turning off their lights because they are broke) the utes are going to continue to get pounded. Also, due to the mass exodus out of homes and into multi-family housing, the utes should be taking it in the ear. Look at that beautiful H/S Top on the 2 year chart. Zoom in the the 6 month chart, and you can see that the right should is formed by a smaller head and shoulders top. Aren’t market fractals awesome.

And here is a close up of the right shoulder. Yes…one could argue it is just a confirmed triple top…

Some top names I have been watching in this area are CEG (which might be too far gone now), MIR, AYE, ETR, and FPL.
Another logical decline should be found in Advertising. Obviously, as companies have less money to spend, they will spend less on their advertising campaigns. Some top choices in this sector include FMCN, a nice China play, OMC, and MNST. I think that GOOG and perhaps BIDU could fit into the advertising category as well, considering GOOG gets quite a bit of revenue from those silly little ads. Either way, those two will be fantastic shorts in the near future. Going along with advertising I think we will see a nice slide in Publishing - newspapers, magazines, books…your choice. Publishing has been weak for some time, and many of these name are quite beaten down, but the are still some nice moves left in them. Specific names I am watching are GCI, PBI, MHP, MDP and NWS.
Recreational stocks should take a pretty big hit too, namely the casinos. I am watching MGM, IGT, WYNN, LVS, PENN, as well as a handful of others.
Homebuilders and the material sector should continue to fall, but I think the reward in the homies is less than in some other sectors, namely consumer discretionary. Big names there would be TIF, GES, M, BBY, GME, WFMI, SBUX and this list goes on, but I don’t want to give it ALL away. If you are not in the mood to single out stocks, be sure to pick up puts on XLY or XRT. Weight loss stocks will probably go on a diet themselves, as less income forces people to eat less anyway, sorry WTW, NTRI, and LTM.

It’s not that I don’t think most of the banking sector include FRE and FNM will not join BSC, ABK, MBA, etc, in the woodshed. Quite the contrary. I think that about this time, the government will be busy helping its friends and screwing the little guy, as usual. The little guy in this case is the local banks. Yup, the nice, quaint regional banks that offer you chocolate-chip cookies when you open an account. I think that they will take an axing, and you should certainly have some exposure. Just be prepared for the banking sector rallies!
Since Mole and Duuuuuude brought up targets and H/S tops, I have to put in this chart that I sent to DMS quite a while back. Just to note…I sent him this e-mail before the end of April.

I have several retracements and projections that target 6K in the $INDU as a very strong target. Obviously, we won’t just drop straight down, there are some very “reasonable” (in the credit bubble/perma-bull sense), targets on the way down that I will discuss as soon as we know wave 3 is rolling. And please don’t tell me we won’t break 10K…
That should give everyone a nice headstart on banking dough in this decline. I still have a post in the works about some specific trades we are eyeing. I will be sure to get it out when I can finally confirm that the big, bad wave 3 is in force!
Skol!
金币:
奖励:
热心:
注册时间:
2006-7-3

回复 使用道具 举报

 楼主| 发表于 2009-4-1 16:11 | 显示全部楼层
August 13th, 2008 11:03 pm Uncategorized 20 Comments

You could also call it Whac-A-Molecool - at least that’s how it felt right after coming back from lunch today. Let’s not fool ourselves - despite the tall tales from some traders I won’t mention here, this continues to be an extremely difficult market to trade in. We are shifting from one market sector du jour to the next and unless you’re a stone-cold trigger happy day trader, it’s tough to hang on to profits long enough to actually bank anything. Today, after revocation of the naked short sale rule the financials had their expected day in the bloody dungeon, although we saw some easing up late in the afternoon. Energy and basic materials were back en vogue encouraged by modestly rising crude prices.
Happy/Unhappy Sectors Today.

The usual circus we have come to enjoy in the last few weeks - out with the old - in with the new. No trend over three days in sight by a longshot, with the notable exception of precious metals, which completed its scheduled thrashing this week. If you had the foresight to take my advice a month ago and shorted either Gold or Silver around 960 you’ve had a fantastic run. Congrats - now cash out and take that money to the bank - you’ll need it for what I now will coin D-Day. Yes, you’ve heard it here first. I still like ‘the Abyss’ as our final destination but for now we remain in eager anticipation of the ‘Allied Bears’ to make landfall and overrun the ‘Permabulls’ triangle shaped defenses. More about this further below.
Alright, today I decided to go ‘Tim Knight’ on you guys - which means tons of charts which will make your browser whince and your chart reading skills switch into overdrive. For starters let’s look at my personal favorite theme, the S&P futures:
S&P futures within target zone.

As I eluded to two days ago (and as Berk explained so brilliantly yesterday), breadth (advances/declines) continues to keep lagging as well as up/down volume continues to decline - both indicating that this rally is running out of steam internally. I’m split on whether we’ll see the S&P drop tomorrow, there is a chance we might retest the 1320 zone once more. As mentioned previously, a strong indicator that wave 2 has topped will be in the form of the lower triangle support line being breached with confidence.
Since this market continues to be fractured I thought it necessary to show similar charts and possible trajectories for two more averages.
NQ ready for another (hopefully final) re-test.

The Nasdaq futures have obviously been leading this market and have shown remarkable strength and resilience. I actually expect to see continued strength here for the remainder of the week and a push towards the 1995 -2005 zone is possible. The target for the Composite is 2469-2483 and 1982-1992 in the 100 index. If we happen to break today’s 2404 low, that would be great news for a bearish scenario.
Sell Signal on the Composite?

While we’re talking about the Nasdaq, let me explain the COMPQ chart above. My evil genius-in-crime Berk mentioned this yesterday:
“Another interesting clue is the action around the bollinger bands. Indexes seldom push far outside of the 2.0 Bollinger band, however almost every market reversal is accompanied by a spike of that level.”
Exactly right, and we just happened to close inside the Bollinger today, which very often signals a sell signal. Are they always on the money and would I bet my first born on it? No, but only because I lost the damn kid last week in card game already. Hey, three years of coal mining in South-East China can’t be that tough, can it?
Moving on to the Dow futures:
Dow ready to roll over.

Being the evil speculator that I am, I greatly enjoyed the weakness in the Dow today. It touched the lower triangle line raising my hopes of a push through, but then was brisk to burst that bubble by retracing back about 40%. It seems that this lower support line is being taken seriously by the market and it might continue to test our patience for a few more days. We shall see - I am showing the two scenarios that have the highest probability as of now.
Small Caps pushing hard.

What’s really making me nervous is the strength in the small caps. Quite frankly, we can’t have much more of this, as we are close to our early June peak. I choose to view this scenario as a great entry point for bears with large cohones - Tim Knight seemingly being a man equipped with canon ball size specimen.
Gold getting ready for another spanking.

If you have stuck it out all the way to here, I’m throwing in a free towel and the chart above. Yes, Gold is going to tank even further - have no fear. If you were foolish enough to ignore my ’short gold now’ signal from about a month ago, here is your chance to redeem yourself. I expect the (now less) precious metal to make a brave push up to around the 850 area in a desperate attempt to regain former glory, but then start tanking from there. Next stop somewhere around 720 - yes, you heard me right. Actually in the longer term I expect Gold to traverse all the way back down to 600, but that’s a story for another day.
My plan for the next two days: Staying in cash! Not only are we in a whipsaw market, but we are also in the final two days of expiration week. Not much is going to transpire from here (I know I’m going to regret having said that). If gold marks my entry, I’ll pick up a few contracts for sure, otherwise I’m officially on a high protein/low option diet.
金币:
奖励:
热心:
注册时间:
2006-7-3

回复 使用道具 举报

您需要登录后才可以回帖 登录 | 立即注册

本版积分规则

本站声明:MACD仅提供交流平台,请交流人员遵守法律法规。
值班电话:18209240771   微信:35550268

举报|意见反馈|手机版|MACD俱乐部

GMT+8, 2025-7-27 20:17 , Processed in 0.055567 second(s), 9 queries , MemCached On.

Powered by Discuz! X3.4

© 2001-2017 Comsenz Inc.

快速回复 返回顶部 返回列表