- 金币:
-
- 奖励:
-
- 热心:
-
- 注册时间:
- 2006-7-3
|
|

楼主 |
发表于 2009-3-22 16:12
|
显示全部楼层
Monday, July 23, 2007A Different View
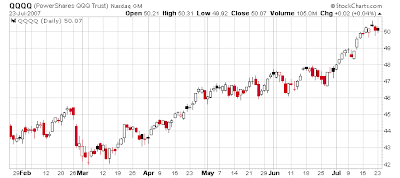
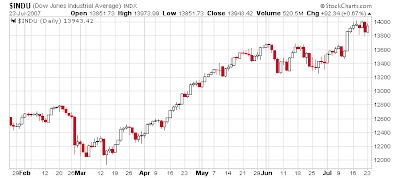
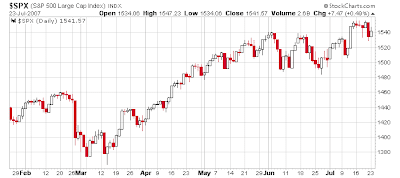 Sometimes we get so caught up in the daily action and TA indicators that we can't see what's actually unfolding right in front of us. When I find myself getting caught in this vicious loop I eliminate all the indicators and moving averages etc., etc. Take a look at these three charts and you tell me what direction the markets are moving. Sometimes you can't see the forest for all the trees. Sometimes we get so caught up in the daily action and TA indicators that we can't see what's actually unfolding right in front of us. When I find myself getting caught in this vicious loop I eliminate all the indicators and moving averages etc., etc. Take a look at these three charts and you tell me what direction the markets are moving. Sometimes you can't see the forest for all the trees.
Posted by Gary at 3:43 PM
22 comments Links to this post 
Gaps
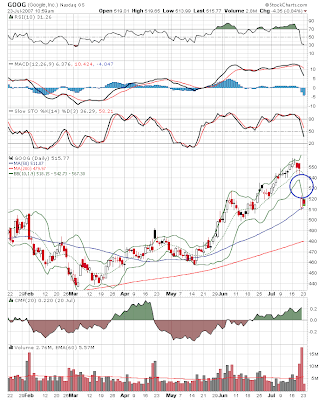
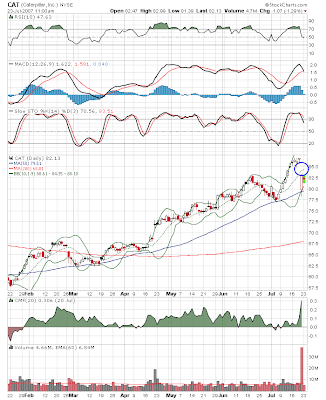
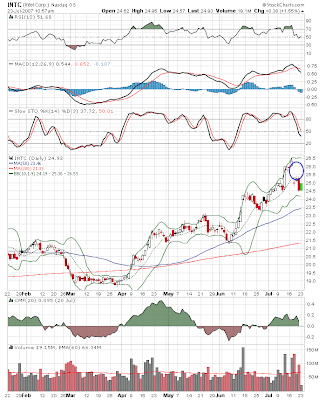
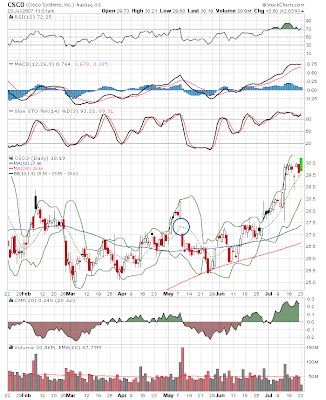 Notice the gaps on GOOG, CAT and INTC. These gaps normally get filled especially in a bull market. Take a look at the CSCO chart. Sometimes they take a bit but they almost always get filled. I'm wondering how we could put together a profitable trading system around these gaps. Let me do some thinking on that one. If anyone already has a proven system feel free to post. I already know of one very profitable system that buys whenever a stock drops 10% or more. Those occurrences are rare though and usually take a while to fill. I'm guessing we could put together something to take advantage of these little earnings miss drops. Especially when the miss has nothing really to do with the overall viability of the company. Notice the gaps on GOOG, CAT and INTC. These gaps normally get filled especially in a bull market. Take a look at the CSCO chart. Sometimes they take a bit but they almost always get filled. I'm wondering how we could put together a profitable trading system around these gaps. Let me do some thinking on that one. If anyone already has a proven system feel free to post. I already know of one very profitable system that buys whenever a stock drops 10% or more. Those occurrences are rare though and usually take a while to fill. I'm guessing we could put together something to take advantage of these little earnings miss drops. Especially when the miss has nothing really to do with the overall viability of the company.
Posted by Gary at 8:01 AM
9 comments Links to this post
Sunday, July 22, 2007Here is your bear market.
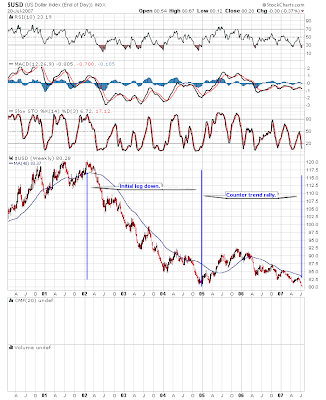 This is for all the bears out there. I'm going to show you where the bear market is. A few days ago a subscriber asked me if I keep track of money supply. He was wondering if the Fed was printing money. I said heck I don't need to find money supply figures all I have to do is look at a chart of the US Dollar. At the end of 01 it became very apparent that the bubble had burst. Normally after a bubble of this magnitude bursts many bad things are going to happen. However the Fed had no intention of letting that happen without putting up a fight. So what did they do? Well obviously they started cranking up the printing press. As you can see they've been going pretty much full blast ever since. So far this bear has unfolded just about how most bear markets unfold. The first leg down usually lasts about 2 1/2 years. This one was a little long at 3 years. Then the counter trend rally over the last 2 years. We should be set up for another leg down now. Notice what happened though. As the Fed cranked up the money supply the stock market decline was halted and the recession in 01 was very mild. The Fed just decided to sacrifice the dollar to keep the economy rolling and to halt the blood letting in the markets. Low and behold its worked...so far. Like I've said many times before though all this excess money will eventually find its way into undervalued assets. That means commodities. This is one of the reasons we have $75 oil and almost $4.00 copper. This is why the nickel in a nickel is worth more than 5 cents. There is no free lunch in this world. Sooner or later the quick fix the fed instigated is going to come back to bite them in the ass. It's going to start IMO with an oil spike. That will set the stage for the first of probably several recessions. For now though the COT says keep riding the money train. This is for all the bears out there. I'm going to show you where the bear market is. A few days ago a subscriber asked me if I keep track of money supply. He was wondering if the Fed was printing money. I said heck I don't need to find money supply figures all I have to do is look at a chart of the US Dollar. At the end of 01 it became very apparent that the bubble had burst. Normally after a bubble of this magnitude bursts many bad things are going to happen. However the Fed had no intention of letting that happen without putting up a fight. So what did they do? Well obviously they started cranking up the printing press. As you can see they've been going pretty much full blast ever since. So far this bear has unfolded just about how most bear markets unfold. The first leg down usually lasts about 2 1/2 years. This one was a little long at 3 years. Then the counter trend rally over the last 2 years. We should be set up for another leg down now. Notice what happened though. As the Fed cranked up the money supply the stock market decline was halted and the recession in 01 was very mild. The Fed just decided to sacrifice the dollar to keep the economy rolling and to halt the blood letting in the markets. Low and behold its worked...so far. Like I've said many times before though all this excess money will eventually find its way into undervalued assets. That means commodities. This is one of the reasons we have $75 oil and almost $4.00 copper. This is why the nickel in a nickel is worth more than 5 cents. There is no free lunch in this world. Sooner or later the quick fix the fed instigated is going to come back to bite them in the ass. It's going to start IMO with an oil spike. That will set the stage for the first of probably several recessions. For now though the COT says keep riding the money train.
Posted by Gary at 2:33 PM
18 comments Links to this post
Saturday, July 21, 2007Buying Opportunity or Selling Opportunity
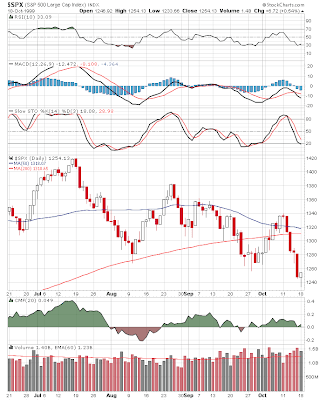
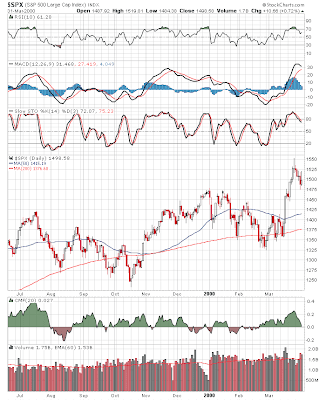
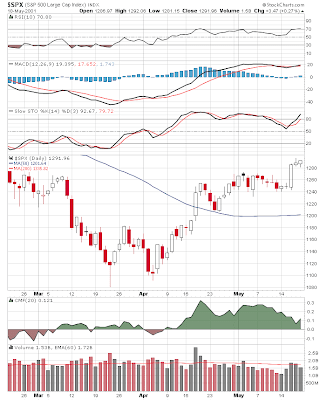
 When is a pullback a buying opportunity and when is a rally a selling opportunity? I've got news for you, as long as you live every pullback is going to look like a sell signal at the time and every rally is going to look like a buy signal. That's just the way human nature works. We require positive feedback and we are very short term oriented. Look at the first chart. The market is obviously topped out and heading down right? Well look at the second chart for your answer. This decline was a buying opportunity. Now look at the 3rd chart. The bottom is in and the market is moving on to new highs. Well not so fast look what followed. This is a case of the rally being a selling opportunity. So how do we know when a decline is a buy and a rally is a sell. TA is not much better than flipping a coin IMO. For me the COT tells me whether the big money is buying or selling. If they are buying then I want to buy the dips and if they are selling I want to short the rallies. The COT has produced much, much better results over the last 20+ years than TA alone. When is a pullback a buying opportunity and when is a rally a selling opportunity? I've got news for you, as long as you live every pullback is going to look like a sell signal at the time and every rally is going to look like a buy signal. That's just the way human nature works. We require positive feedback and we are very short term oriented. Look at the first chart. The market is obviously topped out and heading down right? Well look at the second chart for your answer. This decline was a buying opportunity. Now look at the 3rd chart. The bottom is in and the market is moving on to new highs. Well not so fast look what followed. This is a case of the rally being a selling opportunity. So how do we know when a decline is a buy and a rally is a sell. TA is not much better than flipping a coin IMO. For me the COT tells me whether the big money is buying or selling. If they are buying then I want to buy the dips and if they are selling I want to short the rallies. The COT has produced much, much better results over the last 20+ years than TA alone.
How many of us started out investing and were soon churning our accounts and gradually giving all our hard earned cash to the pros or to the brokerage firms in the form of commissions? I'm going to guess a very large percentage. Granted there are some who manage to survive the learning process and can be profitable short term trading even after you factor in heavy yearly fees. Sadly most of us won't. Quite a few will just continue to day trade to satisfy their desire for excitement. All the while refusing to accept the fact that their trading habits are costing them money. They rationalize that they will soon get in a groove and make it all back. I've got news for you until you change something don't expect any different results. Let me point out the cold hard facts. If you are stuck in this vicious circle you are in fact not investing you are gambling. On top of that you are gambling against people that are much smarter, better capitalized and more disciplined than you. Basically you are easy pickins for them. The only way you are going to beat these people is to use a system that gives you an edge in the market and then have the discipline to stick with it. Otherwise these sharks are going to eventually get all of your money. At some point you have to decide whether it is more important to be excited or whether it is more important to make money, hopefully before you've lost all your capital.
Posted by Gary at 1:55 PM
12 comments Links to this post
Friday, July 20, 2007COT report for July 20th
Still bullish. Even more than last week. The big boys believe in this rally even if nobody else does. So far they've been on the right side of the trade.
Posted by Gary at 7:11 PM
12 comments Links to this post
DOW:Gold Ratio
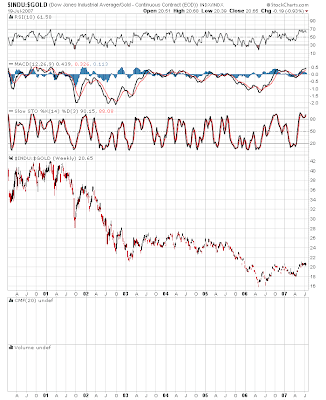 I'm going to show everyone what I consider the most important chart in the world. The ratio of gold to the Dow. A little history lesson. This ratio runs in very long cycles. In 2001 it took roughly 42 oz. of gold to purchase one share of the Dow. Even though the stock market has been in a 5 year bull market and is at new all time highs it now only takes about 20 oz. of gold to buy one share of the Dow. The take away is that gold (real stuff) has been vastly outperforming the Dow (paper assets). You would have been vastly better off to have owned gold than stocks over the last 6 years. This cycle normally runs until the ratio gets to or very close to 1:1. It briefly touched 1:1 in 1980. What I'm trying to say is that in inflation adjusted terms the Dow is a long way from making new highs. Does that mean one should short the market? Of course not. It just means we are in a secular period where real stuff is going to tremendously outperform paper assets. BTW you will get this same looking chart if you compare the Dow to oil, copper, nickel, zinc, cotton, soybeans, etc. You get the picture. This is what happens when the fed embarks on a money printing binge trying to inflate away unpayable debts and pay for expensive wars. Now do you see why I buy silver? I don't want the Fed to inflate away my purchasing power. I'm going to show everyone what I consider the most important chart in the world. The ratio of gold to the Dow. A little history lesson. This ratio runs in very long cycles. In 2001 it took roughly 42 oz. of gold to purchase one share of the Dow. Even though the stock market has been in a 5 year bull market and is at new all time highs it now only takes about 20 oz. of gold to buy one share of the Dow. The take away is that gold (real stuff) has been vastly outperforming the Dow (paper assets). You would have been vastly better off to have owned gold than stocks over the last 6 years. This cycle normally runs until the ratio gets to or very close to 1:1. It briefly touched 1:1 in 1980. What I'm trying to say is that in inflation adjusted terms the Dow is a long way from making new highs. Does that mean one should short the market? Of course not. It just means we are in a secular period where real stuff is going to tremendously outperform paper assets. BTW you will get this same looking chart if you compare the Dow to oil, copper, nickel, zinc, cotton, soybeans, etc. You get the picture. This is what happens when the fed embarks on a money printing binge trying to inflate away unpayable debts and pay for expensive wars. Now do you see why I buy silver? I don't want the Fed to inflate away my purchasing power.
At some point in the future we will see a 1:1 ratio again. I have no idea if that will be at 36,000 or 3,000 but I guarantee we will see it because politicians will always opt for the easy way out. What they never seem to learn is that there is no easy way out.
Posted by Gary at 5:51 AM
33 comments Links to this post
Wednesday, July 18, 2007Leverage
This is going to tie in with the position sizing post the other day. I see this quite often on the blogs how such and such has increased their portfolio 100% in the last month or they added 20% a one day. Sounds impressive...unless you're an experienced trader. If you've been around for a while you know that when you hear someone bragging about those kind of gains you will in the not to distant future hear them say they blew out their account or probably you just won't hear from them any more. Let me say right up front that every system will have periods when it incurs multiple losses in a row. Let me show you what happens to a portfolio when someone is playing with options and leveraging up only 5:1. Lets say you start with $100,000. Now lets assume you give the underlying asset a 2% move before you're stopped out. I'll quickly add that a 2% stop is going to mean you will most probably get stopped out quite often. You're not giving your position enough room to work. Back to the example. Your first losing trade costs you $10,000 ( 2% x 5 = 10%) Now you've just reduced your overall portfolio to $90,000. Not the end of the world by any means and definitely recoverable. However now you take another trade using the same leverage and you lose again. Now your portfolio is down to $89,000. Your down almost 20% with only 2 losing trades. 20% is starting to get serious. The next trade if its another loss brings you down to 72,900. Next $65610 and then $59049. Its not hard to have five losing trades in a row. If you hit that kind of losing streak while using 5:1 leverage you will cut your account almost in half. Now you are in the position of having to make almost 100% on the remaining capital just to get back to even. Now let me give you the sequence at 10x leverage, which by the way is what the more conservative Bear Stearns fund was trading. $100,000-$80,000-$64,000-$51,200-$40,960-$32768. By using 10x leverage 5 losses will cost you 2/3 of your portfolio. But here is the real pitfall. If you get lucky and score a winning trade on your first try then most likely human nature takes over and you say to hell with 5 or 10x leverage I'm going all in, this is easy. 1 loss at 20x leverage will cost you almost half your account. Holy s**t that wasn't supposed to happen. Now I'm down big so I guess I better go all in again and make it back quick. So you take another 20:1 trade again with a 2% stop which already most likely reduces your odds of a winning trade to under 50:50. That means you are staking the remaining $60,000 on less than a coin flip. End result of two losing trades at 20:1 leverage, $36,000. You've lost twice and cut your account by 2/3. Now you have to make almost 300% to get back to even. Do you see now why it is so important not to lose money. If you do lose it better be small. The way to do this is obviously keep your position sizes small enough so that you don't get hurt when you lose.
Posted by Gary at 4:11 PM
26 comments Links to this post
Newer Posts Older Posts Home |
|
|
 [复制链接]


 [/url] [url=http://www.321gold.com/banner_redirect.php?url=http%3A%2F%2F
 [/url]
 [/url] [size=-1]Mar 13 --> Steal Me Bob Moriarty
  [/url]
 [/url] $$$ Fed Temp Bank Reserves added today
  [/url] [size=-1]CHARTS --> The $US 2 x 3 Gold
 [/url]

