搜索
楼主: hefeiddd

一个笨蛋的股指交易记录-------地狱级炒手

  [复制链接]
 楼主| 发表于 2009-3-22 15:22 | 显示全部楼层
Tuesday, August 12, 2008Commodities are now in a cyclical bear market

About a month ago oil pushed up into the largest parabola of the entire bull market. At the time many commodity bulls were finding an unending list of fundamental reasons for why the price was going to continue up for the foreseeable future. This is what happens at the top of parabolic spikes.

Let me first say that we aren't even close to the ultimate top of the commodity bull. We are however entering a global recession. As such I wouldn't expect rising commodity prices for the next couple of years. Once we get through this recession though the commodity bull will resume.

However at some point years into the future we will see the final top in commodities and it will end in another one of these parabolic spikes. At that point the bulls will need to have the discipline to exit when things look the brightest. If they don't they will run the risk of giving back many years of gains very quickly. So far I see very little ability to do this by most of the bulls.

I suggest we start practicing now before that final top comes.

Now we should see a bounce soon in oil, probably at the $110 level. Gold is also showing a long tail down. Which is a signal of a very oversold market. I expect gold to bounce along with oil. I would suggest using that bounce to exit any remaining long positions. The longer term trend is now broken in commodities. At this point I would have to say that commodities have now joined the rest of the market and are in bear mode. If that's the case rallies should be sold instead of buying the dips.

Posted by Gary at 5:56 AM

34 comments Links to this post


Saturday, August 9, 2008weekend report
I'm going to make the weekend report free again this week. Send a request to you made a request and didn't recieve the report check your spam filters. Sometimes I've found the emails get flagged as spam.

Posted by Gary at 11:19 AM

42 comments Links to this post


Friday, August 8, 2008Buying opportunity
The trading cycle averages 28 to 43 days in length. Normally we see a half cycle low somewhere around day 18/19. Yesterday was day 17. I still think this rally has more to go. Mostly because I don't think oil is done going down yet. This pullback is most likely the half cycle low and probably a buying opportunity. In an uptrending market two days down in a row greatly increases the odds of the next day being positive. If I remember correctly 3 down days in a row has odds over 90% of being positive the next day.


Posted by Gary at 6:06 AM

24 comments Links to this post


Wednesday, August 6, 2008Investing vs. trading
Yesterday I posted the virtues of risk management and compounding. For traders that is the safest way to amass and keep long term gains in the market. It's how a trader can grow his capital over time. I showed what the power of compounding over a modest 20 year period would do for an original $100,000 nest egg.

There is another way to get rich. That is to get in a secular bull market early and hold on. This is how many billionaires are created. Warren Buffett bought the bottom of the bear market in 74 and held on. Jim Rogers and T. Boone Pickens spotted the bottom of the commodity cycle and both have made fortunes.

Many in the media are trying to call the current rise in commodities a bubble. Ridiculous. You need oversupply and massive public participation for a bubble to form. Commodities are simply deflating because of demand destruction brought on by the global recession. Once the recession ends demand will return and commodities will turn around and move higher. They will continue this trend until enough supply is brought on line to swamp demand.

We are going to get another great buying opportunity sometime in the future probably at the bottom of the current recession, when things look bleakest, to get back on the commodity bull. Those that can buy and hold will make tremendous returns probably far in excess of what is possible compounding over a 20 year period. They will do it in a much shorter period of time also.

Posted by Gary at 8:46 AM

31 comments Links to this post


Tuesday, August 5, 2008The Key to Making Money in the Market
Today I'm going to let you in on a secret, the holy grail of investing if you will. The key to making and holding on to long term gains in the market has nothing to do with how much you make on your winning positions. Never has never will. The key to making money is in how much you lose when you miss.

As anyone who's read the comments on the blog or any blog for that matter knows there is a never ending line of people who claim to make outrageous gains in the market or they claim to never or rarely ever miss a call.

I can tell you when I see these amazing claims I just have to shake my head. Anyone who claims to make 100% in the market is also going to be the one who loses 100% in the market. If there is anything that history has shown it's that no one and I mean no one can produce much more than 20% annually over any significant period of time. Buffett is one of the best and his 30 year average annual return is in the neighborhood of 25%.

What most investors don't realize is that you can get filthy rich in 15 -20 years by compounding 20% a year. Hell you can get rich by compounding 12-15% a year. All you need is a little patience and good risk management skills to assure your future.

After 20 years compounding at 15% a year you would turn $100,000 into $1,636629.
That same $100,000 compounded at 20% would have you retiring with $9,584,383.


The only way to achieve these kind of long term results by trading is to control risk.
Investing on the other hand is a different ball game. Maybe I'll do a post on that one tomorrow.

Unfortunately most investors can't be satisfied with 10-20% so they take on too much leverage trying to make outlandish gains. Sooner or later this leverage always comes back to bite you in the ass. The bottom line is by trying to maximize your gains you end up guaranteeing your failure.

This is probably the hardest thing for novice investors to accept. We all start investing because we see it as an easy way to get rich. I mean seriously how hard is it to click a mouse? The answer of course is it's about the hardest damn thing in the world to do successfully. In this business you are competing against the smartest people in the world. Does anyone really think it's going to be easy to part them from their money?

My advice to any beginning investor is to keep your positions tiny for the first 5 years. Concentrate on not losing money and forget about trying to make any. That part will take care of itself in time as long as you don't lose your wad. The smartest thing you can do as a beginning investor is make it as hard as possible for the pros to get your money.

Posted by Gary at 8:18 AM

24 comments Links to this post


Monday, August 4, 2008XAU character change
The behavior of the mining stocks has been pretty consistent throughout this bull market. Every new upleg has resulted in a higher consolidation zone. Today we may being seeing a significant character change in the mining stocks. Unless the XAU can regain the $160 level quickly we will have a breakdown of the consolidation zone that hasn't happened at any other time during the PM bull. Considering that gold is quite a bit above the recent lows of $850 it would seem that the miners are saying gold is going lower.

I still think commodities are trying to tell us that the world is slipping into a serious recession.

Posted by Gary at 9:01 AM

13 comments Links to this post


Friday, August 1, 2008Bear market COT's
One of the things that characterized the last bear market was a persistently net short COT in the S&P futures. The commercials have been net short for three weeks now. I'm starting to think we are going to see the same action this time.

We also likely have a very left translated 4 year cycle. The last cycle that topped out in such a short time span was the 1930 cycle. The following two years took the market down into the most vicious bear market in US history.

Granted I doubt we are going into the depths of a deflationary depression like we saw in the 30's. But a 4 year cycle that tops out this quickly is anything but good.

Posted by Gary at 6:51 PM

18 comments Links to this post


Newer Posts Older Posts Home
金币:
奖励:
热心:
注册时间:
2006-7-3

回复 使用道具 举报

 楼主| 发表于 2009-3-22 15:23 | 显示全部楼层
Thursday, July 31, 2008CRB break
The CRB has now broken a long term trend line. It is oversold and probably due a temporary bounce but the odds are that the bounce will be of the dead cat variety. The spike in energy along with the ongoing problems in housing and the credit markets are most likely going to send the global economies into the worst recession in 25 years. That is going to cause demand destruction in the commodity complex.

Will it signal the end of the commodity bull? Not a chance! Once the recession ends, as they all do, demand will surge again and we'll go through another round of escalating commodity prices. I expect this whole cycle to be exacerbated by central banks who will turn to the printing presses to "halt" the recession.

I wouldn't be surprised to see this whole cycle of inflation and deflation cycle two to three times before enough production is brought on line to end the commodity bull and start the next great bull market in stocks.

Posted by Gary at 3:10 AM

19 comments Links to this post


Wednesday, July 30, 2008Another 1-2-3 reversal in the making
Now it's oils turn to track a 1-2-3 reversal. This time the trend will be down however. The S&P confirmed the trend reversal today BTW by closing above the intial reaction.

Oil should now test the highs. I have my doubts as to whether it will be able to push above the 50 DMA before rolling over again though. Notice the 3 day RSI is already close to pushing into overbought. In a declining trend overbought levels get sold fairly quickly. We'll just have to see how this one plays out. Needless to say I'm not ready to buy oil yet.


Posted by Gary at 5:17 PM

0 comments Links to this post


Tuesday, July 29, 20081-2-3 reversal
I've been pointing out in the daily updates for a couple of weeks that we probably put in the 22 week cycle low on the 15th. The market is now in the process of completing the 1-2-3 reversal to confirm that low. A close above 1282 will skew the odds highly in favor of the trend now being up for a while.

The transports and the Russel have already completed 1-2-3 reversals suggesting that the rest of the market would eventually follow. Until the selling pressure in oil eases we can probably expect the market to trend higher. Well until the market finally recognizes the fact that collapsing oil is actually a bad sign. Which it will do at some point. Falling energy prices = falling demand which = recession deepening. This all leads to much lower stock markets in the future. Which is exactly what Lowry's selling pressure is and has been telling us all along.


Posted by Gary at 3:52 PM

16 comments Links to this post


Sunday, July 27, 2008Is it time for the dollar to rally?


When everyone starts thinking the same thing then usually no one is thinking. The dollar has gotten pummeled over the last 2 1/2 years. The Fed debasing the currency has led to the dollars decline and commodity prices skyrocketing.

Now don't get me wrong I'm still a long term bear on the dollar but I think too many investors are short the dollar at this point. Everyone has been thinking the same thing for a while now. It's probably time for the second counter trend rally. Note the 3 month basing action that we've been in similar to how the first counter trend rally started. This is probably a sign that the market is running out of sellers. If there's no one left to sell then the direction of least resistance is going to be up.

The first rally lasted a year. There's no reason why it can't do so this time also. As a matter of fact I suspect it will. The FED has to have noted the explosion in commodity prices as a result of their last attempt at devaluing the dollar. I think they are going to be a bit reluctant to expand money supply for a while. Of course if money supply is not expanding we probably can't expect too much out of the stock market. The S&P was up a grand total of 3% in 05 as the dollar rallied.

Since we are in a bear market now I expect the market to gradually work lower as liquidity contracts. At some point probably by the middle of next year the FED will start to panic again as the recession doesn't improve and most likely continues to deepen. Falling commodity prices should at that time give them the cover they need to start cutting rates again and expanding the money supply.

Until that happens I don't expect too much out of the precious metal or any commodity sector for that matter. Looking at the weekly charts of GLD and the GDX it's obvious that money flows have been diverging for a while.

Another clue is our strong partner Platinum is now breaking down. Platinum has been the leader during this bull market. It's now leading the metals lower.

I don't think for a minute that the dollar bear is over or the precious metal bull for that matter. We are just going through the normal counter trend moves that happen in all bull & bear markets.

Luckily for us, all we have to do is watch the gold and silver COT for signs that the commercials are covering their huge short positions. Once we get the big money back on our side it will be time to buy the metals aggressively again and short the dollar. Until that time we'll just have to be patient.


Posted by Gary at 2:15 PM

13 comments Links to this post


Saturday, July 26, 2008The next "big" thing
I've thought for several years that the catalyst for the next great bull market will come out of the biotech sector. Don't get me wrong we aren't finished with the secular bear market yet and probably won't be for a while. We may be taking the first baby steps toward the biotech revolution though. The BBh just broke out of a 2 1/2 year consolidation. I've shown here and here in the past that the size of the consolidation is often a sign to how large the rally will be. Usually the break out will be tested soon after the intial break. That test will be an excellent time to take long positions in this sector.


Posted by Gary at 4:38 PM

8 comments Links to this post


Wednesday, July 23, 2008CRB trend is broken
In Jan. when Ben cut big to "save" the markets it turned on the afterburners in the commodity complex. At that point the trend in the CRB started to accelerate. Oil had already spiked more than 100% by then anyway giving us the makings of the next recession. The Fed just made things worse. Well that trend is probably over. Counter intuitively spiking inflation is ultimately deflationary. Oil along with the credit and housing debacles have forced the global economies into recession. Recessions are deflationary. Obviously in a deflationary environment demand drops so prices retreat.

It certainly looks like commodities are signaling deflation in the future. I wouldn't worry though the Fed will ultimately be true to tenet #1. No way Bernanke is going to let deflation set in as long as he has access to the printing presses. I fully expect Bernanke to use the same cure as Greenspan did during the 2000-2002 bear market. Print, Print, Print!


Posted by Gary at 4:23 PM

18 comments Links to this post


Tuesday, July 22, 2008Has oil topped?

Despite yesterdays weak rally I do think oil has topped. Every single time oil has spiked more than 100% with in a year it has led to a recession. I think it's safe to say that this time has been no different. Oil actually rose almost 200% trough to peak.

Now let me say that every recession has crushed demand and eventually brought prices back down. It will be no different this time. This time we have a global recession and it's going to be severe. To think that somehow demand is going to increase or even stay the same in a severe worldwide recession is simply absurd.

Often after a long intermediate move the first counter day after at least 4 days in a row in the direction of the trend will signal a trend change. (The four day corollary).

Also after a long intermediate move four days in a row counter to the trend will often confirm the trend change (The four day rule).

You will notice that we have both on the oil chart. Oil is short term oversold so a bounce could be expected but the odds are now in favor of oil trending down.

Looking at the weekly chart it becomes apparent just how far the parabolic rally went and how overbought it became. I really don't think this is going to be corrected by four down days. I fully expect oil to correct back to the consolidation zone of the T1 pattern (the technical rules are at listed on the lower right side of the home page). That should take oil back to the $85-$100 level before this correction is over.

Investors looking to hide from the bear in the energy sector are going to be disappointed I'm afraid.

Posted by Gary at 5:49 AM

12 comments Links to this post


Newer Posts Older Posts Home
金币:
奖励:
热心:
注册时间:
2006-7-3

回复 使用道具 举报

 楼主| 发表于 2009-3-22 15:24 | 显示全部楼层
Friday, July 18, 2008Oils T1 and Golds A wave

Sounds like a 60's psychedelic rock band doesn't it?

Oil appears to be in the beginning stages of correcting the large T1 move out of the 07 lows. You can find all the technical rules on the lower right side of the home page. We should now see oil test the consolidation zone. I see where the media is already labeling this a bubble. Baloney! Bubbles form when the public piles in. Bubbles form when supply swamps demand but price still rises. Neither one of those has happened yet.

All that happened is human emotion got a little carried away and too many people jumped on the energy complex in a market where nothing else was working. Now that bullish sentiment needs to be corrected to set up the next leg of the bull. I suspect this correction will take some time. We're not going to wipe out the extreme bullishness in only a month or two. Oil is probably going to have to trade sideways to down for a year or more. Makes sense as we are now in a rescession and demand destruction is occuring.

The second chart shows Golds 4 wave pattern. We are currently in the A wave that may or may not top out as oil rolls over. I suspect that gold will follow oil down. I also suspect that Gold is going to resist oils pull. It's already happening as the gold:oil ratio is starting to trend in favor of gold. During the first phase of the commodity bull oil outperformed gold. During the second phase gold should significantly outperform oil. So far oil has increased over 1300% and gold about 300%. During the second phase expect gold to fill that gap.

Once Gold's B wave finishes it will be time to get long precious metals in a big way. It will also be time to concentrate on the metals and forget about oil. That's not to say oil won't go higher, it will. Just that the big % gains are now over in the energy markets. The real opportunity now lies in the precious metals sector for years to come.

I'm watching for the first sign the the FED is ready to panic again. Oil breaking is just the out the FED needs to start cutting, which is going to be necessary in order to save the banking system and Bernanke has made it abundantly clear that this is priority #1 and to hell with what happens to the rest of us. Once we smell the cuts are coming it will be time to load up on the metals.

Posted by Gary at 4:18 AM

9 comments Links to this post


Thursday, July 17, 2008Is the bear dead?

The big question in every one's mind is did yesterday mark the end of the bear or at least the end of this leg down?

I can assure you that every hedge fund manager in the world looked at that first chart on Monday night and came to work Tuesday ready to buy stocks, especially financials since they have been beaten up the most. There have only been a few times in history when new lows have expanded to the levels seen on Monday. Every one of those times the market was within a day of an important low.

Looking at the next chart we see that so far the S&P hasn't even broken the trend line or penetrated the 10 DMA. Unlike other bottoms we haven't seen the index accelerate away from the 10 DMA as investors panic. There never was any panic during this decline just steady selling.

So did we see the bottom yesterday? Most of the signs are suggesting we did. However I'm worried that everyone now thinks the bottom is in and it's safe to jump back into the pool. When everyone starts thinking the same thing then no one is thinking. This bear may just have another trick up his sleeve. I'm going to wait until we at least break the trend before jumping on the long side.

The weekly chart gives us an idea where we might want to exit those longs and start selling again. The first level of serious resistance if the S&P can make it past 1255 (the Mar. intraday lows) would be at the 200 WMA. In bear markets this level is rarely recovered once it's breached.

Posted by Gary at 4:00 AM

23 comments Links to this post


Tuesday, July 15, 2008July 15th update
Today’s action was very telling. When oil broke it set up the potential for a strong snapback rally. That rally materialized within minutes as expected. However by the end of the day most of the rally faded away. Today’s action is suggesting that the bear just took a bite out of another sector with no benefit to the rest of the market. Thinking logically, just because oil breaks it’s not going to cure any of the problems in the banking sector. It’s also not going to turn the recession around in its tracks. What I didn’t know was whether the market would respond logically or irrationally. I think the time of irrational actions is probably over. I think we are now fully into the period where we are going to have to pay for the excesses that have built up since 1987.

I'll have a lot more to say in tonight's update.

Posted by Gary at 1:43 PM

25 comments Links to this post


Oil glut
Everyone knows by now that I'm a commodity bull. That being said I can still spot when commodities have gotten ahead of themselves. This has been the case in oil for a while now. Parabolic moves are rarely justified by the fundamentals. We repeatedly hear that emerging markets are driving demand despite the fact that the US is in recession. Baloney! There is always a lag effect and decoupling is a myth. There's just no way the emerging markets are going to hold up without the US. According to the WSJ we are already seeing some gulf states storing oil in tankers in the gulf because they can't find buyers for it. The IMF's forecast for global demand has plummeted this year. Every recession in history has cut demand and this one will be no different.

We are now at an interesting juncture on the oil chart. The first down day will complete a 4 day Corollary possible trend change. All that means is that long intermediate trends often end when optimism gets extreme enough to put in 4 or more rally days in a row. The first down day will often mark the intermediate top. As always nothing is 100% but since this is occurring right at the top of the T1 pattern this may be a signal we want to watch.

Posted by Gary at 4:08 AM

12 comments Links to this post


Sunday, July 13, 2008Leaks are sprouting everywhere
First it was BSC and Northern Rock. Now it's FNM & FRE. F and LEH are probably hanging on by a thread. I'm not even sure how many airlines have gone belly up in the last year. We've already seen one casino here in Vegas fall. Does this remind anyone else of the story about the little Dutch boy with his fingers in the dam?

When the Fed rescued BSC anyone with any common sense knew this wasn't going to be the end. As a matter of fact any rational person knew this was only the beginning. Obviously the market isn't rational because it rallied on the BSC bailout. Not for long though when reality finally returned.

Now I see that the government is going to nationalize FRE & FNM. Will the market irrationally rally off this news? Who knows, it's possible. Will that be the bottom? Hardly! Does anyone seriously think this is even close to being done. People we are just getting started. The bankruptcies are just now starting to snowball. We saw three last week. How many will pop up this week I wonder.

First legs down in secular bear markets usually shed anywhere from 60 to 75%. The financials are now in a secular bear market. The BKX needs to go to at least 45 before we can reasonably expect a counter trend bounce of any significance.

The market may be devoid of common sense but that doesn't mean that we have to be.

Posted by Gary at 6:58 PM

13 comments Links to this post


Saturday, July 12, 20083 day bottom rule


While this doesn't apply 100% of the time (nothing does) an intermediate low rarely forms without seeing at least 3 down days in a row. Other than the Nov. low every intermediate decline during this bull market hasn't ended until we got at least 3 down days in a row. The same held for all the intermediate declines during the last bear market in 01 & 02. The exception was the final low in Oct. 02.

As long as we continue to see the market bounce every couple of days the odds of a bottom forming are slim.


Posted by Gary at 2:26 PM

14 comments Links to this post


Newer Posts Older Posts Home
金币:
奖励:
热心:
注册时间:
2006-7-3

回复 使用道具 举报

 楼主| 发表于 2009-3-22 15:25 | 显示全部楼层
Thursday, July 10, 2008Europe


I thought tonight it would be a good idea to see how the rest of the world is doing.

All three of the big European Bourses appear to be in midpoint consolidations. Well except the FTSE which appears, with my limited TA acumen, to be forming a bear flag.
Even more concerning is the rapid implosion of the European financial system. The 50 week moving average is headed sharply lower and is nearing a cross below the 200 WMA. It certainly looks like the mess that Greenspan & Bernanke created is going to take down not only the US financial system but a good portion of the rest of the world along with it.
Again one might want to think twice before selling the farm to go long here.
One thing that is kind of scary is the magnitude of the first leg down. If the global markets are consolidating for another bear move and the next move is roughly equal to the first leg we could see some very hefty declines in the weeks or months ahead. Something along the lines of what we are now seeing in the financial sector.
Just be cautious. If the market does break down into that kind of sell off I can guarantee you that nothing is going to be safe.


Posted by Gary at 6:08 PM

17 comments Links to this post


Wednesday, July 9, 2008Bottom or midpoint consolidation


I've noted in the past that waterfall declines often have a midpoint consolidation before the final quick plunge. Of course not being able to see the future I really have no idea if we are trying to put in a bottom here or just putting in the midpoint consolidation which will be followed by 3 to 10 days of sickening declines. Just something to think about if you are listening to CNBC and contemplating going all in on the long side.


Posted by Gary at 2:21 PM

10 comments Links to this post


The oil stocks now join the party


I've been warning that the next sector to fall to the bear would be the energy stocks and sure enough the XOI has now moved into a down trend. The oil service stocks are showing a double bottom breakdown. My guess is they will be following the rest of the energy sector soon.

The third chart is the US coal index. This is what a parabolic collapse looks like.

While everything else is breaking down the PM and mining stocks are both entering uptrends. The XAU is currently sitting right on support. Now would be a low risk entry for miners with a stop two boxes down on the XAU chart.

Coincidentally gold is right in the middle of a timing band for a trading cycle low. I doubt that gold has too much downside from here.

Posted by Gary at 5:55 AM

9 comments Links to this post


Tuesday, July 8, 2008Remember the fundamentals
There seems to be a lot of uncertainty about Gold and the dollar lately. I've pointed out in the past that trying to time the metals is pretty difficult. These are thin markets, especially silver. If you are someone that freaks out if they don't spot the exact bottom then you are going to probably lose money during Golds bull market.

At times like this I always return to the fundamentals. First: is there anyway way the US can possibly pay for two wars?

Is there any way the US can pay for Social security as the baby boomers start to retire in force?

Is there any way the US can pay for Medicare?

There is no way for the US to "grow" its way out of these problems. As long as this fundamental truth remains the dollar is going to remain in a long term bear market and gold is going to remain in a long term bull market.

Where ever you decide to take your position the bull will eventually cure any timing mistakes you make.

When the Dow:Gold ratio approaches 1:1 then it will be time to get nervous on the long side of Gold.

Posted by Gary at 4:55 AM

17 comments Links to this post


Sunday, July 6, 2008It's all about the global expansion

I must say the global growth story is starting to get pretty thin. I'm constantly hearing how the US recession won't affect profits because growth in the emerging markets will support international companies. I'm not buying it.

I don't believe for a second that the rest of the world is just going to go on about it's merry way as the US sinks into a severe recession. For the most part every stock market in the world is agreeing with me.

So is the Baltic Dry Index. After a brief breakout to new highs this index has rolled over and is heading down again.

The materials sector is also breaking down. If the world were still expanding then why are the material stocks on the retreat? The expansion in China for the Olympics is now finished. The Shanghai exchange and the XLB are both saying that the demand is over for now.

Folks bear market rules now apply. You don't trade from the long side anymore. You wait for the rallies and sell into them. That's how you make money in a bear market.

Posted by Gary at 4:19 AM

14 comments Links to this post


Saturday, July 5, 2008The warning shot has been fired
The warning shot over the bow has now been fired. As you probably remember I've been watching the coal stocks has an indication that energy is about to break. On Wednesday that warning came as the coal index plunged almost 14%. The parabolic trend has now been broken. If this plays out like 99% of parabola's play out then we should see a fast and spectacular collapse of the coal stocks as it becomes apparent to the market that the fundamental premises of this incredible rally proves false. Namely that demand is collapsing as the world continues into the global recession.

It shouldn't be too long before oil rolls over and follows coal. At the moment oil is struggling to complete the T1 move that started in the depths of the 5th year decline back in the 1st quarter of 07.

Almost every stock market in the world is telling us that the world is entering a severe recession. A recession causes demand destruction. A severe recession causes massive demand destruction. If the world goes from using 87 million barrels a day to only 82 or 83 million then we no longer have a supply shortage. As a matter of fact we will then have a demand shortage. To little demand and too much supply equals lower prices.

I've been pointing out for weeks now that the energy stocks have not been confirming oils move higher. That continued the last two days as the XOI and the OIH both moved lower. This despite the market rallying on Thursday and oil moving higher both days.

There will be a time to buy energy stocks but I don't think that time is now.

Now I think the market has gotten it into it's head that when energy breaks the all clear signal will be given. I do think we will get a relief rally. But no way is that going to be the end of the bear market. As subscribers know I've been watching Lowry's buying and selling pressure. As of Wednesday the spread between the two is the widest in 75 years.

Never in history has a bull market started with buying pressure at new lows 6 weeks into the rally. That's what we were seeing in May as the market rallied. This was never a new bull market it was always a bear market rally. The market didn't roll over in May because oil rallied. No, oil had been rallying all along. The market rolled over because sentiment finally got too bullish and there was never any institutional support behind this market.

As many of you know I think the Fed engineered a false bottom in Mar. with the bailout of BSC.
The market wasn't allowed to move to attractive levels. Levels that would have brought in the big value players. We need their money behind the market if we are going to have a sustainable bottom. We didn't get it.

Now we are seeing the COT reports roll over just like we did in the fall of 2000. So while we may get a relief rally when oil breaks don't expect it to last long. Unless the market were to fall 20% below the 200 DMA (subscribers know what I'm talking about) playing the long side in a bear market is a risky trade. Just like buying the dips in a bull market is the safe way to invest, selling the rallies is the correct way to trade bear markets.

Trying to catch rallies is going to be difficult in this environment. If you do manage to time the rally correctly it's then very difficult to time the top of the rally. In a bear market oversold levels don't mean the same thing as they did in a bull market. Oversold levels can become very oversold in bear markets.

Trading bear markets is difficult and it requires a 180 degree shift in strategies from what worked in the bull market. I will be looking to sell into the relief rally when oil breaks.

What few people realize is that when oil breaks it's not going to do anything to stop the recession or cure the woes in housing. It won't have any effect at all on the credit bubble bursting. All it's going to do in the long run is take out the one sector of the market that was still working.

Posted by Gary at 3:17 PM

0 comments Links to this post


Thursday, July 3, 2008Financial bear market
As everyone knows by now I think we are in a secular bear market for paper assets. Look at the chart above. This is the financial sector. It also is now in a secular bear market. I can tell you without a shadow of a doubt that when something like this happens it's not going to get "fixed" quickly. This is going to be a multi year process. I can also tell you that the Fed and government will only prolong the process by trying to band aid over the problems.

The financials are trying to cleanse themselves right now. Unfortunately cleansing is going to require that a lot of banks go bankrupt. The powers that be should just resign themselves to the fact that its going to happen no matter what and get it over with. If they do we will get through this much faster and come out the other side much stronger.

Now do I think they are going to do that? No way in hell. We're going to do the exact same thing Japan did when their banking system imploded. We're going to do everything possible to try to "repair" the problem. We're also going to end up with the same result as Japan. A long drawn out bear market. Only this time its much worse than what Japan had to go through because we've entered a commodity bull market. Trying to repair the problem entails printing money. The ole something for nothing cure. For the next 5-10 years that cure just isn't going to work. We've just witnessed the end result of the initial attempts to fix the banking system. A 200% spike in energy prices and an economy that got pushed over the edge into recession by the energy shock.

Don't underestimate the governments penchant for stupidity though. I can almost guarantee they will continue down this same path like a rat stuck in a maze for years to come yet. The question is whether this just leads to a series of vicious recessions or a hyper inflationary depression.

Posted by Gary at 9:26 AM

12 comments Links to this post


Newer Posts Older Posts Home
金币:
奖励:
热心:
注册时间:
2006-7-3

回复 使用道具 举报

 楼主| 发表于 2009-3-22 15:26 | 显示全部楼层
Saturday, June 28, 2008Watching Coal
I'm currently watching the coal stocks as a sign for when energy is going to succumb to the bite of the bear. Once the coal index breaks the trend line then I suspect the party will be over in the energy sector.

At the recent high the coal index was 76% above the 200 DMA. It's pretty rare that an index can push more than 60% above the 200 DMA. In 2000 the Nasdaq only managed to move 57% above the 200 DMA. That was during the greatest bubble in history. Just goes to show you how incredibly stretched the move in the coal stocks has become. These kind of moves occur when dumb retail money finally moves into the sector.

As most of you know I've pointed out many times in the past that a spike of 100% or more in oil prices within a years time has led to a recession 100% of the time.

Let me also point out that the recession has crushed demand and led to falling oil prices 100% of the time. This never fails and I guarantee it's not going to fail this time either. This is not going to be the one time in history where "it's different this time".

I know the energy bulls will point out that the fundamentals are supporting this parabolic rise in oil. While I am in the peak oil camp I also know that there are two components to a supply and demand imbalance.

As long as the world is growing then yes we are using more oil than the world can produce. What the bulls want to ignore is a worsening global recession. Almost every stock market in the world is telling us this is a fact.

Unless someone can explain to me how failing economies can somehow continue to increase energy demand then I'm going to have to be in the camp that thinks that the parabolic spike in energy prices is going to end like all parabolic spikes end...in collapse.

Keep in mind that parabolic moves are a sign of irrational human emotions. Fundamentals just don't ever change rapidly enough to justify vertical moves barring a war in the Middle East. The last time I checked there weren't any new wars brewing. Now if I saw a US military build up on the Iran border like we saw in 02 in Iraq then I might change my mind about oils sustainability.

Until that time I think I'll separate myself from the herd piling into the energy stocks.

Here's one of the few truths that you can take to the bank. "When everybody's thinking the same thing then no one is thinking"

Posted by Gary at 9:14 PM

14 comments Links to this post


Friday, June 27, 2008COT surprise
There are some very interesting developments in the COT report this week. I'll go over all this in the weekend report which should be out tomorrow sometime.

Posted by Gary at 7:02 PM

6 comments Links to this post


Thursday, June 26, 2008Short, intermediate and long term outlook
In tonight's update I'm going to go over where I think we are headed in all three time frames.

I'm also going to take a look at the energy and precious metals sectors.

Posted by Gary at 10:50 AM

6 comments Links to this post


Wednesday, June 25, 2008Credit cards the next shoe to drop

Today American Express revealed that they had underestimated the rate of credit card delinquencies. I suspect this will be the next shoe to drop as embattled consumers start to default on their credit card payments.

From the look of the AXP chart I'd say it has already started. A break below the $40 support would not be good for the consumer outlook. I think it's safe to say that Discover is having trouble with defaults and delinquencies also.

Folks I think we have tough times ahead. I also think the current four year cycle has already topped out. If the market manages to trade below the Jan & Mar. lows before this 22 week cycle bottoms then we can add in not only a failed seasonal cycle but one that is left translated. The average decline for a failed seasonal cycle is -30+%.

This is not a pretty picture brewing here


Posted by Gary at 4:32 PM

26 comments Links to this post


Tuesday, June 24, 2008There goes the Nasdaq

The Nasdaq and the NDX have now followed the rest of the market into a down trend on the point and figure charts.

The Transports, Russell and Midcaps as of today all completed 1-2-3 reversals.

I'm still half heartedly expecting a bounce soon as this 22 week cycle bottoms sometime in the coming week or weeks. However events are coming into play that may not be pretty for the markets. I'll elaborate in tonights update.

Posted by Gary at 4:50 PM

16 comments Links to this post


Saturday, June 21, 2008Financials
I would have posted this to the blog except I can only include 5 charts. So I'm going to offer one more time a free update. This isn't the weekend report just my thoughts on the financial sector.

Send request to

After browsing the update how many still don't want to own gold and silver?

Posted by Gary at 4:19 PM

27 comments Links to this post


Newer Posts Older Posts Home
金币:
奖励:
热心:
注册时间:
2006-7-3

回复 使用道具 举报

 楼主| 发表于 2009-3-22 15:28 | 显示全部楼层
Thursday, June 19, 2008It's time to buy gold
Gold finally broke through the down trend today. It also appears the recent gold trading cycle bottomed on June 16th.

After the massive run we saw last year into Mar. this has been a very mild correction. That alone speaks for golds strength or should I say Bernankes penchant to print dollars. The A wave should now be starting. Remember A waves rarely make new highs so don't get discouraged if gold doesn't shoot straight up like it did last fall. As I said in today's update I expect the Fed to continue cutting as the market weakens. They just need to bring down the energy markets first. Perhaps this will happen naturally as the parabolic price structure finally collapses. If not then I expect we will see intervention in the oil markets. One way or another in an election year the powers that be are going to bring down oil prices. Of course this will just make the problem that much worse in the end but hey what's more important doing the right thing or getting re-elected?


Posted by Gary at 9:10 PM

15 comments Links to this post


Wednesday, June 18, 2008June 18th update
Tonight I'm going to put on my contrarian hat and go over the "what if's". There are several areas that I think investors in general expect to happen in the coming weeks and months. What if what's expected to happen doesn't. I'm also pretty confident the retail investor is being handed the bag just like he was in 2000. Only this bag isn't on anyone's radar.

The full report will be available to subscribers later this evening.

Posted by Gary at 6:12 AM

37 comments Links to this post


Tuesday, June 17, 2008weekly charts

I hope everyone that took advantage of this weeks offer of the weekend report enjoyed perusing my thoughts on the market. The response to the weekly report was surprising to say the least.

I want to start off with a very long term chart of the S&P. What I want to concentrate on is the 75 week moving average. During secular bull markets this average tends to act as impenetrable support. Take notice that during the entire secular bull market. This average only turned down briefly in 87 and very slightly in 90. It turned down and stayed down for over two years once the secular bear market started it turned in 2001. Now notice that the 75 week moving average has again turned down for only the 4th time in 28 years. Even more concerning is the fact that the market has penetrated the 200 week moving average. That has only happened one other time in the last 28 years. I don't think there is any doubt that we are in a long term secular bear market and that the bear is waking up again after a Fed liquidity induced hibernation of 5 years.


Now lets take a look at the weekly chart. As everyone knows by now I like the weekly charts as they eliminate the daily noise and give one a clearer picture of what's happening in the market.

Anyone who got this weeks report knows I think we are moving down into the coming 22 week cycle low soon. I've pointed out on the chart that almost all 22 week cycle lows don't end until the market gets oversold on a weekly basis. You can see the market isn't really close to being oversold yet. I also pointed out this week that we should expect the half trading cycle bounce and I think we are in it now or perhaps it is already rolling over. Once this bounce fails we should get another leg down into the final low. At this point I still expect the Mar. lows to hold. However if they don't then it is very possible that we have already put in the top for the next 4 year cycle. A top after only 5 months would be incredibly bearish for stocks.

Regardless even if this doesn't end up being the top I do think this cycle will be a left translated cycle. The 1998-2002 cycle was a left translated cycle. Left translated cycles are very bearish for the market. The worst declines in history have come from left translated cycles. The 32 cycle was left translated. So was 74. Obviously we'll just have to see how things play out but I really don't have a lot of optimism for the next 3 years.


Posted by Gary at 3:40 PM

7 comments Links to this post


Saturday, June 14, 2008Weekend report
The market is now entering a very dangerous period IMO. I'm going to make the weekend report available to anyone who wants it free of charge this one time. Minus the COT spreadsheets of course :) Just send a request to The report will be available Saturday evening

Posted by Gary at 5:46 AM

20 comments Links to this post


Tuesday, June 10, 2008spike in oil = recession
I've shown in the past how a spike of 100% or more within a year has always caused a recession. This time obviously is no different. We can probably thank the Fed for our current situation. I argued months ago that the massive monetary inflation to save the banks and housing market would ultimately make matters worse and not cure any of the problems in the financial or housing sectors.

We are seeing that in fact that is exactly what is happening.

Now I'm going to dispel another myth that seems to be brewing. The more I listen to the media the more it appears that everyone is convinced that because of supply and demand fundamentals the price of oil is going to continue higher and higher.

Just like the theory that monetary inflation would fix the banks this theory is completely ridiculous. Just like a spike creates a recession the recession creates demand destruction. It does it every time and I guarantee it is going to do it this time too. When you take down the demand side of the equation until supply is adequate then price drops.

All this talk of skyrocketing prices for the foreseeable future is as usual complete crap. The parabolic nature of this rally suggests that when the market finally catches on to the fact that demand is collapsing the price of oil will fall rapidly.

Posted by Gary at 6:20 AM

41 comments Links to this post


Sunday, June 8, 200810 stock market lessons
10 great common sense lessons from Bob Farrell. Pay particular attention to rules 1,2, 4 & 9. Read the whole story here.

Posted by Gary at 7:01 PM

5 comments Links to this post


Newer Posts Older Posts Home
金币:
奖励:
热心:
注册时间:
2006-7-3

回复 使用道具 举报

 楼主| 发表于 2009-3-22 15:28 | 显示全部楼层
Friday, June 6, 2008Parabolic spike


The current sentiment seems to be that oil is a sure thing. Yesterday we saw oil surge almost $6. That was the largest one day rise in history if I'm not mistaken. If we look at a long term weekly chart it's easy to see the parabolic nature of this current rally. At the peak a couple of weeks ago oil was stretched 46% above the 50 WMA that has acted as support during the first phase of the bull. This is by far the most oil has risen above the mean during the entire bull market. We are starting to hear way to many calls for $200 oil.

Don't get me wrong I'm still a commodity bull but I'll be the first to admit that parabolic spikes don't end well. The effect of this spike has been to put the economy into a recession. Recessions cause demand to fall. Falling demand equals lower prices. I'll also note that this is an election year and everyone is screaming at the politicians to do something about oil prices. I have no doubt that the powers that be will do something. Whether it be raising margin limits or reweighting indexes, etc. This is going to end just like all parabolic spikes end, in a swift collapse. This is not a place where I want to chase oil stocks.

When this pulls back to the average then oil will be a strong buy again for the next leg up in the second phase of the bull. Of course at that point everyone will be telling you that oil was in a bubble and it has popped. Nothing will be further from the truth.

Posted by Gary at 3:29 AM

21 comments Links to this post


Tuesday, June 3, 2008Where is the bottom?


There seems to be a preoccupation with trying to pick the bottom in the housing and financial sectors lately. I guess I can understand the reasoning since I don't really expect the market to enter into a significant new bull market until these two sectors especially the banks bottom.

Let's look at a broken sector and two previous bubbles to see if we can find any clues to what we should look for to spot the bottom.

The airline sector took a huge hit on 911 that continued as oil started to climb. The Fed is virtually crushing any hope for the recovery of this industry with their inflationary policies. It's been 7 years and no sign of a bottom yet.

Next we see the collapse of the tech bubble. It's been 5 years and still no sign of a major recovery to new highs.

The Nikkei bubble popped in 1990. it's now been 18 years and again because of the Japanese unwillingness to let segments of the financial system fail we see no sign of the Nikkei pulling out of the secular bear market.

Now look at the housing index. Only 2 1/2 years have passed. Inventory is still building. We have another wave of foreclosures yet to come this year. They haven't even started yet much less hit the banking system.

The BKX is down a little over a year. The Fed is following the same course as Japan and trying to prop up the financial system.

After looking at the other three charts does anyone really think that we are even remotely close to seeing the final bottom in these two sectors?

Posted by Gary at 11:16 AM

21 comments Links to this post


The Fed's inflation conundrum
Remember long term tenet #1? If given the choice between inflation and deflation the Fed will inflate.

The Fed is now between a rock and a hard place. The deflation in the real estate and credit bubbles requires inflation of the money supply or the masses are going to feel pain. Lot's of pain. This kind of pain isn't good during election years. The Fed has faithfully responded by following rule #1 to a tee. Keep in mind it's not really going to stop the deflation in either of those markets. It may prolong and probably intensify the pain but it's not going to stop the process from unwinding. Both bubbles will continue to deflate. As a matter of fact they are going to decline much more than is necessary. That's just how human nature works. They will likely drop to the same degree of undervaluation as they rose to overvaluation.

Real estate just went through the largest bubble in history. Much larger than the tech bubble. This doesn't bode well for the final bottom in the housing market. I seriously doubt this deflation will stop before housing loses at least 50% of it's value from the 05/06 highs. Does anyone seriously think the banks are going to bottom as long as this process continues?

So now we have the Fed desperately trying to stop deflation in the real estate and financial sectors but what they are actually doing is again creating a much much bigger problem. I think it's safe to say the the inflation genie is out of the bottle. Once he's out he's very tough to get back in.

Here's what is going to have to happen. First off enough time is going to have to pass for the supply and demand imbalances to be overcome in the commodity markets. Second the Fed is going to have to raise rates aggressively and create a severe recession or depression. How many think that the Fed will be willing to do that?

The easiest time to do it would be right now as it's just getting started. The problem is we are already in a recession. As I've said before the fun part of monetary inflation is now over. We are most likely going to be in a period of either very sluggish growth or recession for several years to come. How does the Fed do what they need to do in that kind of environment? I don't think they can and I don't think they will. The deficits in the US are so huge they will never be paid unless the currency is debased. Just another strike against the Fed tightening.

All this talk about the Fed tightening rates soon is ridiculous. It ain't going to happen. No the Fed is going to continue to inflate and we are going to continue to suffer the consequences of that inflation.

The only way to protect ones wealth during this period is to invest in commodities or be one heck of a market timer. Since probably less than 10% (I'm being generous) of investors are going to be able to time the markets successfully your best bet is to buy commodities.

All this talk of gold collapsing is just ignorant IMO. Keep your eye on the ball and you will come out of this period in fine shape.

I'm waiting for one of two things to happen before loading up on PM again. Either we move into the latter part of the summer or the market declines and I see the Fed panic again and turn up the money supply even more, which ever comes first.

Posted by Gary at 5:32 AM

1 comments Links to this post


Sunday, June 1, 2008CRB inflection point


[size=130%]I think [size=130%]commodities are now at an inflection point. I'll explain why. Let's start with the first chart.

[size=130%]What we are looking at is the first phase of the commodity bull market which ended in what I call the fifth year decline. Secular bull markets tend to all have this major counter trend correction around year five. Apparently it takes five years for enough people to get sucked in before a large correction wipes them all out and resets the bullish sentiment low enough for the next phase to begin. Black Monday in 1987 was just such a decline.


[size=130%]
[size=130%]
[size=130%]
[size=130%]
[size=130%]
[size=130%]
[size=130%]We've obviously started the second phase of the bull market. This phase often drags on for years. It lasted from 1987 to 98 for stocks. I doubt the commodity bull will be any different. During this time we will see many scary corrections. Every one of them will bring out the doubters. Every rally will bring out the calls of a bubble from the media. The swings will likely be larger in each direction during this period as more and more investors jump on the bull.


[size=130%]
[size=130%]Each new leg up will draw in enough new investors to push commodities to new highs probably often stretching the averages quite far above the 200 DMA's. Each correction will fall hard as these stretched levels collapse under the forces of gravity.
[size=130%]


[size=130%]During this time infrastructure will start to expand. It will take time. You just can't find a giant oil field and bring it into production quickly. It will take many years to bring this online. Probably 5-10.


[size=130%]
[size=130%]Somewhere in the future we will see another correction that will be completely out of character to what has transpired during the second phase. Again the calls will surface about bubbles and commodity bull being finished, etc., etc. This time it will be close to being true. By then enough supply will likely have come on line to meet demand and quell prices. However that won't be the end of the bull.


[size=130%]
[size=130%]That's not how human nature works. At the bottom of this correction a strong rally will take hold. By now the public will have watched for 10+ years as the commodity bull roared ahead. They will take this rally as a sign of a sure thing. You won't be hearing anything about bubbles at this point. The media will be full of stories about paradigm shifts and rising commodity prices for the foreseeable future. People will by buying gold and silver and hoarding food to protect against inflation.


[size=130%]
[size=130%]The problem is that it actually will be a bubble at that point. Supply will now be more than enough to meet demand. The only thing pushing commodities higher at this point will be human greed and our inability to see change coming. We are forever stuck projecting the past into the future. People are doing it right now with the real estate market. Despite 2 years of losses they continue to try and call a bottom in housing. Don't even get me started on the financial sector. (One year does not a bottom make.) Investors are still trying to project the remembered gains in real estate into the future. I've got news for everyone there won't be a bottom in housing until everyone becomes convinced that real estate is the worst investment ever.


[size=130%]
[size=130%]The final phase will last about 1 to 1 1/2 years as the general public piles into a "sure thing" Then and only then will we get the final blow off top in the commodity market. That's when we will likely see the Dow:gold ratio approach 1:1.


[size=130%]
[size=130%]Now take a look at the second chart. The inflection point IMO is the $420 support level. The CRB has consolidated for a couple of months and broken above $420. It is now testing that breakout. If this breakout holds and commodities begin to move higher from here then we are all in for some serious inflation in the coming months and probably the next year.


[size=130%]
[size=130%]The question comes down to will the Fed let the banks pay for their mistakes and start targeting inflation by raising rates or will they continue to throw money at the financial system and rescue their buddies at the rest of our expense.


[size=130%]
[size=130%]The BKX is very close to breaking down to new lows at the moment. I'm going to say right now that it is important for the BKX to break down. We have to cleanse the system. The only way for this to happen is for the banks to suffer the consequences of their greed. As long as the Fed continues to prop up the financial system our future is not going to be very bright. Granted things are going to be in a shambles for a while as multiple banks go bankrupt. That is the price that has to be paid for the spectacular misallocations that were seen in recent years.


[size=130%]
[size=130%]I will be watching the CRB and the BKX closely in the coming weeks.


Posted by Gary at 10:07 AM

10 comments Links to this post


Thursday, May 29, 2008Are patterns becoming too popular?


Tonight I received an e-mail from Ameritrade informing me that they now have pattern recognition software for retail traders. As soon as I saw this I got to wondering if trading patterns has become too popular.

Almost every night on Fast Money they have a chartist on the show. When they started the show the only one using charts to any extent was Eric Bolling. The other traders would basically roll their eyes when he pulled up charts during the show. Not so anymore. Almost every blog I visit is loaded with charts full of patterns, trend lines, support and resistance, etc. etc. Mine included.

While I was reluctant to come around to trading patterns I have to admit that they often worked probably more than 50% of the time. More than 50% defines an edge. If you have an edge you can probably make money in the market.

Now one thing I can tell you is that when something works for very long the market will eventually discount it and your edge will disappear. The three charts are examples of widely recognised patterns that did not "work" as expected.

Somebody once said that speculating in the market comes down to anticipating the anticipators.

When I received tonights update it started to dawn on me that the smart money is probably starting to anticipate the pattern traders. I expect the more obvious patterns are going to work out less and less frequently.

Posted by Gary at 6:22 PM

15 comments Links to this post


Wednesday, May 28, 2008Is the bear market rally over?

As always when the markets get confusing I go to the weekly charts to get a better idea of what's really happening. Yesterday I noted that the S&P had broken the trend line from the Mar. lows. By looking at the weekly charts it becomes apparent that the market rallied back to the 75 week moving average that acted as support during the bull market. As of last week it is now acting as resistance.

The Transports have been much stronger than the rest of the market despite high oil prices but looking at a weekly chart (or daily for that matter) the 2b reversal becomes very apparent.

I know the argument that if oil backs off it will rescue the market and the economy. I'm just not sure I buy it. The damage has already been done. Oil will back off during a recession because demand will drop. I think the Fed's liquidity pump over the last 5 months just made sure oil went to $135 instead of $100.

Economies don't turn on a dime. Just because oil is backing off it doesn't mean the economy is all of a sudden going to rebound strongly. As the economy continues to sink from the duel effect of the real estate bubble bursting and energy spiking the stock market will likely again try to price in the recession. I still don't buy the whole market discounting theory. The market wasn't discounting anything over the last two months other than the fact that the Fed created a lot of paper. At some point the market will wake up to the fact that the economy is faltering and there likely won't be a quick rebound no matter how much money the Fed throws at it.

When it does I fully expect Bernanke to again turn on the money spigots. If he does he may keep the market from falling below the Mar. lows but he will also just continue to stoke the fires of inflation.

I'll be watching oil closely during this period. If it bottoms around $100/$110 and then heads north again I think 09 could be a very rough year.

I wanted to add this link for what to look for at bear market bottoms. As I've said repeatedly we are in a long term secular bear market.

Posted by Gary at 4:37 AM

15 comments Links to this post


Newer Posts Older Posts Home
金币:
奖励:
热心:
注册时间:
2006-7-3

回复 使用道具 举报

 楼主| 发表于 2009-3-22 15:29 | 显示全部楼层
Tuesday, May 27, 2008Possible trend change
I've noted in the daily updates for a while the build in negative sentiment levels and now the S&P has broken the uptrend line. It has also tested the consolidation zone from the T1 move and failed. I think the odds are now in favor of a continuation of the bear market. I do think the market is going to bounce into the end of the month but I suspect that is just going to allow the shorts in at a better level. I also have a feeling that when and if the market approaches the Mar. lows Bernanke is going to flood the market with even more liquidity and put a floor under the market.


Posted by Gary at 6:10 AM

26 comments Links to this post


Thursday, May 22, 2008Leaving town
I'm off to Joshua tree for the long weekend. I'll be back Monday. Have a great holiday weekend, I plan to.

Posted by Gary at 4:12 PM

15 comments Links to this post


Wednesday, May 21, 2008Runaway move in the energy markets


The massive amount of liquidity the Fed has created as they try to prevent a recession before elections has now created a runaway move in the energy markets. So far each correction in oil has been slight, in the range of $11 to $7. Make no mistake when this parabolic move collapses it's going to be spectacular.

That being said no one in their right mind should be shorting this thing yet. A good rule of thumb is to be on the look out for a correction that exceeds the previous corrections by 20% before trying to call the top. That would work out to be roughly $13.50. Once oil corrects by at least that amount then we might be looking at the end of this move. Until that happens your odds of trying to pick the top of this move are not good.

I've also included the charts of gold and silver. The Fed has flooded the world with so much liquidity that for the first time in this bull market a D wave decline was unable to push gold or silver back to the 200 DMA.

Posted by Gary at 10:04 AM

32 comments Links to this post


Tuesday, May 20, 2008The Fed is still hard at work
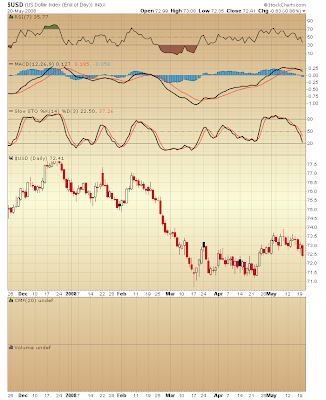
A month ago I was under the impression that the dollar was ready for the next counter trend rally in the ongoing bear market. It's definitely time. It's been over two years since the peak of the last rally. In that time the Fed has cost us 23% off the value of the dollar peak to trough.

Unfortunately the dollar is starting to look like it's ready to roll over again. It seems the Fed is still hard at work devaluing our currency. The actions of this Fed are really starting to worry me. They apparently have no concern for inflation.

Obviously all that matters is to rescue the financial system no matter what the cost to the rest of us. If the dollar breaks to new lows I hate to think what commodity prices are going to do, especially oil and gasoline.

Posted by Gary at 5:56 PM

7 comments Links to this post


Monday, May 19, 2008Has Gold's A wave begun?
I've mentioned in the past that I think the fun part of the Fed's monetary inflation is now over. The US is entering the time when the Fed's loose monetary policies are going to start causing pain. Probably a lot of pain.

We've hit the point in the road where the fundamentals are going to take over and move markets where they must go.

Over the last two months we've been privileged to be schooled by countless anonymous posters who are sure that gold and commodities in general are going to collapse. They've repeatedly pointed to the bear market of the 80's and 90's as proof that this is so. Most think commodities are in a bubble. I guess after watching the last three bubbles the Fed has created it's understandable. However just because prices are rising doesn't imply a bubble. For a bubble to form you must have oversupply.

I've occasionally tried to explain that markets work in cycles and that commodities, because of supply and demand fundamentals, are no longer in a long term bear market with as you might guess little success.

Now I think there's a very good chance that Gold's A wave has started. Look at the chart and you will get a picture of the last complete cycle in gold. A waves rarely take gold to new highs. So I expect gold to test the lows again later in the summer. That will be the next great buying opportunity in the PM.

A waves can be explosive but investors probably shouldn't get married to the idea that gold is going straight to $1500.

Posted by Gary at 6:29 AM

56 comments Links to this post


Friday, May 16, 2008Those darn funnymentals
As I write this gold is up another $14 and oil is up $3. Many technicians will of course tell us the fundamentals don't matter. Personally I pay attention to both the fundamentals and the charts. In the short term fundamentals aren't going to influence day to day movements. The fundamentals however over the longer term are going to move the market in the direction it has to go. Case in point the commodity bull market since 2001. Fundamentals are more like a rising tide. You can swim against it for a while but you can't prevent it from coming in.

My theory is that this rally is nothing more than a blizzard of paper being created by the Fed to keep the markets levitated until the elections, which seems to be working BTW.

Unfortunately this is also preventing over stretched commodity markets from correcting.

I'm watching the dollar closely now. We are in the window of time when we could and probably should see the second counter trend rally in the dollar bear market. However if the Fed is creating too much liquidity for this to happen then the risk of the dollar rally failing is high. The fundamentals will eventually take the market were it has to go regardless of what the charts say.

Fundamentally, if there are just too many dollars floating around then the rally is doomed to failure. If this does unfold I hate to think where commodity prices are going.

Expect to see more media hype about evil oil companies and hedge fund speculation. I also expect to see margin requirements increased in the futures markets and perhaps we will see another round of index reweightings similar to the Goldman gasoline reweighting in 06.

I expect the powers that be will try any and everything to abort the stagflation outcome of the 70's from repeating. Heck they already measure inflation by removing everything that's inflating. It's a good start unfortunately it doesn't jive with reality.

Following down the same monetary inflation path as the 70's is going to ultimately lead to the same outcome as before no matter what new tricks and gimmicks the Fed tries.

Posted by Gary at 5:34 AM

49 comments Links to this post


Thursday, May 15, 2008Will a recession mark the end of the commodity bull?
Seems like the current thought amongst most investors is that a recession will put an end to the commodity bull market. Seems reasonable doesn't it? If the economy slows or shrinks commodity demand will contract. Falling demand equals lower prices right?

Now let's look a little deeper into that theory shall we.

First off let me clear up one critical point. Commodities have been in a secular bull market for the last 7 years for one reason and one reason only. Supply and demand imbalance. This goes back to our original question of will a recession cure the commodity price explosion.

Let me point out another important fact. Recessions don't last forever.

Now let's examine what is going to happen if the recession worsens and commodity prices fall.

If prices are falling rapidly does anyone seriously think oil companies, copper miners, gold and silver miners, farmers, etc. etc. are going to continue to rapidly expand production or exploration?

I can guarantee you they won't. They all remember the bear market years from 80-2000. Heck anons come on this blog daily to remind us of those times. No what's going to happen is commodity companies are going to start tightening their belts again and put expansion projects on hold waiting to see what unfolds.

The end result is as the economy comes out of recession and commodity demand surges again new supply will not be coming online. As a matter of fact new supply would now have been delayed even further down the line.

Now do you see why commodity bull markets last so long. Rising commodity prices tend to slow or stagnate economies. When this happens it just serves to slow the production of desperately needed new supply.

A serious recession will only guarantee much higher commodity prices in the future.

Posted by Gary at 6:29 AM

13 comments Links to this post


Newer Posts Older Posts Home

Subscribe to: Posts (Atom)
金币:
奖励:
热心:
注册时间:
2006-7-3

回复 使用道具 举报

 楼主| 发表于 2009-3-22 15:30 | 显示全部楼层
Tuesday, May 13, 2008Oil COT's
I've been calling attention to this to subscribers for a while now. The COT report for the crude oil market has been getting more and more bullish since the beginning of Mar. Notice the net short position has gone from -102835 to -24109 during this time. That's bullish enough by itself but this has happened while oil has rallied almost $22.00 or over 20% if you prefer. Seems like the commercial traders knew something was up with oil. That's pretty unusual for the commercials to buy into strength. The last time it happened was in the gold market in early 06. For the time being I think the energy markets are the lowest risk commodity investment. At least until we see the smart money starting to sell heavily.


Posted by Gary at 4:33 PM

20 comments Links to this post


Monday, May 12, 2008Platinum & Silver

I've pointed out in the past that the strong partner during the precious metals bull has been Platinum. A few weeks ago I noted that I was worried about the "crawling" action as Platinum hugged the 50 DMA. This often results in a break down. Well Platinum did break down. Except instead of following thru and correcting hard it's recovered and is again back above the 50 DMA and back to making higher highs.

Silver has now closed above the $17 resistance level. Silver is also not acting like it has in the past during D wave corrections. Silver should be in a waterfall decline by now. It's not happening.

When the Fed didn't reassure the market they were done cutting rates at the last meeting I think it didn't take commodities in general and oil and PM in particular, long to figure out the Fed isn't going to be withdrawing liquidity anytime soon. As a matter of fact it took two days before the commodity markets caught on.

Posted by Gary at 7:28 PM

24 comments Links to this post


Friday, May 9, 2008Weekend climbing trip
I'll be out of town this weekend. Back Sunday night or Monday morning.

Posted by Gary at 2:32 PM

25 comments Links to this post


Has Gold bottomed?


When everyone can see something I tend to become skeptical that it will happen. Remember the market likes to take away the most money from the maximum amount of people. Everyone and their cousins can see that head and shoulders pattern in gold. I've got to wonder if the bull is using another trick to keep the fewest investors on board.


While everyone can see the H&S pattern no one is commenting on the successful test of the T1 move. No one is noticing that gold stopped dead in it's tracks at the old high of $850. The Hulbert goldtimers sentiment index is gloomy at -10.7%. That means the average goldtimer is short the gold market by 10.7%. This reading is in the lowest decile over the last 20 years. Historically readings this low have led to one month returns of over 14% on average.

Notice that silver has also tested the T1 consolidation zone.


I think there's a good chance gold has now started the A wave rally. This rally rarely takes gold to new highs but it would be a confirmation that the D wave decline is over. Once the B wave decline is over and it should hold above the $850 low the next C wave will begin. Since gold is now in the second phase of the bull market these rallies are normally very powerful.

I'm adding some physical silver now and I will add the rest once the B wave decline is over.


If I'm wrong I don't worry because as Old Turkey says "After all it is a bull market". Bull markets eventually correct any timing mistakes and hey I'm getting silver $4 cheaper than 2 months ago. In my book that's a bargain.


Posted by Gary at 5:54 AM

6 comments Links to this post


Thursday, May 8, 2008The Five stages of the housing bust
I'm sure most people know the five stages of grieving. Denial, Anger, Bargaining, Depression and Acceptance.

Let's apply this to a bear market shall we.

Remember late 06 and early 07? Remember the repeated calls of a bottom in the housing market? DENIAL

Now let's fast forward to summer and fall of 07. The market makes it's initial decline as the bear market gets underway. At this point no one could deny that housing had been in a bubble and that bubble had burst. Now the world started looking for a scapegoat to focus it's wrath on. Predatory lending seemed to be the convenient target. It was the mortgage lenders fault. Definitely not the fault of all these people buying multiple homes and lying about their incomes. Definitely not the fault of home owners extracting equity out of those homes to buy cars, big screen TV's and go on vacations. ANGER

Now the government has jumped into the fray with plans to fix these problems. First off lets just let the Fed monetize bad debt. Maybe banks will forgive part of the loans. Or the government will give the states money to prop up prices so people that made bad decisions won't have to pay for their mistake. Hell they bailed out Bear Stearns. BARGAINING

There are two stages still missing. We need to move on to depression. At some point the world will realize that these problems can't be quickly fixed. It's going to eventually dawn on investors that in the end these people are going to have to face up to the fact that this bear market is going to play out till the end no matter what the government does. People are going to have to suffer the consequences of their actions. DEPRESSION

Finally the market will realize that there's no way around this and it will accept the fact that the cleansing process is necessary and once it's over the world can start fresh again. ACCEPTANCE

Then and only then will the secular bear market be over. We are just now transitioning from anger into bargaining. Despite the 3 month rally the housing collapse and credit bubble deflation is no where near done yet.

Posted by Gary at 7:12 AM

14 comments Links to this post


Tuesday, May 6, 2008Purchasing power is the only thing that matters
I repeatedly see comments that the market is irrational, that there's no fundamental reason for it to be this high, etc. etc.

Let me say this again. The market responds to liquidity and emotion. That's it! Quit worrying about whether the fundamentals support where the market is at.

That being said the fundamentals most definitely do matter. As some one once said in the short run the stock market is a voting machine but in the long run it's a weighing machine.

The next basic truth is that you can't get something for nothing. If that were possible we would never have bear markets because the Fed could just forever print away any declines.

I got news for you every nation and empire the world has ever seen tries to go down this path. The Fed is most definitely firmly on this path. I also have news for you it has never once worked. Nada! It won't work this time either. Inflating the money supply always leads to inflation, especially if you happen to be in a commodity bull cycle. Guess what? We are in a commodity bull cycle.

Now the Fed can throws billions or even trillions of dollars at the market and levitate it but sooner or later that liquidity always leaks into the commodity markets. When it leaks into energy you end up with $122 oil. Oil is the life blood of any economy. If the price of that lifeblood starts to spike it puts a crimp in economic expansion. There's just no way around it. If the Fed continues down this path they will avoid a deflationary depression like we saw in the 30's however they may very well put us in a hyper inflationary depression like Wiemar Germany.

I've pointed this out before but here goes again. Notice that the S&P is up 145 points from the bottom. That's 11%. That's not bad right? However in that same time oil is up 44%. Everything food, gas, copper, steel, etc. etc. is rising much faster than the stock market. Folks it's hard to see but the Fed is stealing your purchasing power right in front of your eyes and the sad thing is we're happy about it because the stock market is going up.

If this keeps up the market is going to rally us right into the poor house.

Posted by Gary at 6:19 PM

30 comments Links to this post


Oil

Oil has now completed the test of the consolidation zone of a T1 move. I've been noting in the weekend updates for several weeks that the commercials have been reducing shorts into strength in the oil contracts. This is usually a very bullish sign if the big money has to cover into a rising market. It's sort of like throwing gasoline on the fire. That last time we saw something like this happen was in the gold market in late 05 and early 06.

Energy inflation is the fly in the ointment of the Fed's reflation attempt. As long as liquidity keeps leaking into the energy markets it's going to be tough for the markets to rally to new highs. On top of that it's just plain bad for the economy. If the rising price of energy continues to weigh on the economy eventually the stock market is going to have to price in the worsening economic conditions no matter how much liquidity the Fed continues to throw at it.


Posted by Gary at 7:30 AM

21 comments Links to this post


Newer Posts Older Posts Home
金币:
奖励:
热心:
注册时间:
2006-7-3

回复 使用道具 举报

 楼主| 发表于 2009-3-22 15:31 | 显示全部楼层
Sunday, May 4, 2008The battle begins


The S&P recovered the 1400 level last week and that's a plus. Now however the real battle begins. 1425 is a major line of resistance as you can see. It acted as support from Aug. till Jan. Once the bulls finally gave up it has acted as resistance. This is going to be the least risky area for the bears to defend as stops are very close. Vice versa this is going to be the toughest area for the bulls to break through as risk is much greater. I suspect part of the reason volume has been so light is many institutions are not willing to get aggressively long into this line of resistance. This would explain the lack of buying pressure on the Lowry's studies.

I'm going to be watching the TOMO, TIO and TAF auctions in the coming weeks. Since Oct. the level of temporary loans has risen from 40 billion to almost 300 billion. The Fed is flooding money into the system. Will this be enough to push the market thru resistance? I don't know. It appears that they are willing to print how ever much money it takes though to accomplish the job. With oil bouncing off $110 support they still have an inflation problem though. So do they risk spiking oil even higher to inflate the market? Long term tenet #1 says that yes they will.


Posted by Gary at 7:24 AM

25 comments Links to this post


Saturday, May 3, 2008Patience
The longer I do this the more apparent it becomes to me that patience is one of the keys to success in the field of investing. Warren Buffett likens it to a batter standing at the plate waiting for that perfect pitch. The thing is he can take as many strikes as he wants. There are no strike outs in investing just because you aren't ready to swing.

The patience to wait for that perfect pitch is often the difference between getting stopped out or taking a severe drawdown and hitting a home run. The patience to hold on to your position once you have it is usually the difference between getting thrown out at second base and winning the seris. All great investors that I know of exhibt this trait in spades.

It's tough for precious metals investors to sit on their hands and wait for that sweet pitch right down the middle of the plate. After what the metals have just done it's hard to sit still and wait for the correction to finish. The fear of missing another big move can conjure up all kinds of bottoming scenarios. Luckily for us we have a pretty darn good indicator to tell us when to reenter in the COT reports. What better time to start buying than when the big money is also buying.

So for now I know it's tough but the best course of action is to sit still or look some place else where the pitcher is throwing that slow ball over the plate. Right now in the gold sector we're trying to face down Nolan Ryan.

Posted by Gary at 9:32 AM

17 comments Links to this post


Wednesday, April 30, 2008China opportunity
China is one of the few places I'm seeing significant potential on the long side at the moment. While commodities are obviously still in a secular bull market almost all of them have gotten extended above their moving averages and need to correct or at least trade sideways for a while. Add in the fact that the dollar may be setting up for a major rally and I don't see huge upside potential there yet.

The US markets seem to be mired in a trading range. Even if they did break out I don't see the stock market surging to huge new highs anytime soon. For that to happen the Fed would have to flood the world with more liquidity. That strategy has already ignited inflation. No I just don't see huge upside in the US markets at this time.

I've said before that bear markets create opportunity. One of the worst has been in the Shanghai stock exchange. The SSEC lost over 50% of of it's value during the recent 4 year cycle low. In my opinion that created one heck of an opportunity for those willing to see it.

I don't believe for one minute that China is in a bubble. China is expanding rapidly. For a communist country China has some of the best capitalists in the world. This growth is not going to go away. I'll tell you what else I like about China. The central bank is tightening interest rates trying to control inflation. That's a plus. While the US is busy squandering billions to police the world, ostensibly from weapons of mass destruction, China is busy buying the natural resources they need. It's much cheaper to just buy what you need than to try and take it by force.

The Shanghai index is one of the few markets that look primed for major moves up along with India and a few other emerging markets. Until the commodity markets are done correcting I think this is probably one of the markets with the most potential on the long side.

Posted by Gary at 7:32 PM

53 comments Links to this post


2nd counter trend rally
I think it may be time for the 2nd counter trend rally in the dollar. The first rally came after 3 years of decline. The current decline lasted almost 2 1/2 years. I was expecting new lows in the neighborhood of 15% below the 04 bottom. The dollar dropped 12.5% below the previous low. That's probably close enough. The last bounce took the dollar above the 40 week moving average and tacked on 15%. If this shapes up to be another counter trend move, 15% would take the dollar back up to resistance in the 80 range.

During the last counter trend move the stock market was range bound for the most part of 05. In a secular bear market stocks are going to need bigger and bigger infusions of liquidity to maintain the upward trend. If the Fed is going to try to drain liquidity from the markets I would expect more of the same sideways trading. This may accomplish the goal of bringing down commodity prices temporarily. However once they start inflating again commodities are going to bounce right back.

Posted by Gary at 6:28 AM

36 comments Links to this post


Monday, April 28, 2008In good company
Jim Rogers is the kind of company I like to have in my investments. He's also buying China.

Posted by Gary at 4:44 PM

38 comments Links to this post


Friday, April 25, 2008Gold's monthly chart
Unless something drastic happens in the next week gold is going to complete a monthly swing high. Every other correction during Gold's bull market has seen one of these monthly swing highs. Also notice that gold has corrected back to the 12 month moving average on every correction. Depending on how long this correction lasts that could come in at anywhere from $790 to $850.

So is the bull market over? Doubtful. Once we finish this move and the commercials cover their shorts I will be looking to get back in at much lower prices for the next leg up. I don't know whether that will be in a couple days, a couple of months or next year. Will I sell my core position? What are you crazy? Where would I be if gold decides to end the correction tomorrow and I had no position?

At some point in this bull market there will likely be a down year. Maybe it will be this year I don't know. This is just how bull markets work. They make it as hard as possible to stay onboard.

I do think the COT report should get us back in pretty close to the bottom so I'll just bide my time until I get the green light.

Posted by Gary at 8:14 AM

10 comments Links to this post


Thursday, April 24, 2008Global warming???
As anyone can tell you the use of fossil fuels and the rise in CO2 emissions is the main cause of global warming...or is it? The truth that none of the environmental groups want you to know is that there is no actual scientific evidence of global warming. That's not to say it isn't happening just that there is no hard proof. As a matter of fact nothing is happening today that hasn't happened many times in the past. The Earth just naturally goes through periods of rising and falling temperatures.

Several years ago NASA launched a series of weather satellites that have been taking very accurate measurements. NASA recently released that data and it actually showed global temperatures stopped increasing in 1998. The big warming that everyone has been worried about since the 70's is a whopping .7 degrees. Actually since 2002 temperatures have been trending downward by .4 degrees. This despite CO2 levels that are still increasing. Here is the in depth story if you want to read the whole thing.

I'm going to guess that funding for the environmental groups is probably better if they conveniently leave out the truth about global warming.

Posted by Gary at 9:58 PM

22 comments Links to this post


Newer Posts Older Posts Home
金币:
奖励:
热心:
注册时间:
2006-7-3

回复 使用道具 举报

 楼主| 发表于 2009-3-22 15:32 | 显示全部楼层
Sunday, May 4, 2008The battle begins


The S&P recovered the 1400 level last week and that's a plus. Now however the real battle begins. 1425 is a major line of resistance as you can see. It acted as support from Aug. till Jan. Once the bulls finally gave up it has acted as resistance. This is going to be the least risky area for the bears to defend as stops are very close. Vice versa this is going to be the toughest area for the bulls to break through as risk is much greater. I suspect part of the reason volume has been so light is many institutions are not willing to get aggressively long into this line of resistance. This would explain the lack of buying pressure on the Lowry's studies.

I'm going to be watching the TOMO, TIO and TAF auctions in the coming weeks. Since Oct. the level of temporary loans has risen from 40 billion to almost 300 billion. The Fed is flooding money into the system. Will this be enough to push the market thru resistance? I don't know. It appears that they are willing to print how ever much money it takes though to accomplish the job. With oil bouncing off $110 support they still have an inflation problem though. So do they risk spiking oil even higher to inflate the market? Long term tenet #1 says that yes they will.


Posted by Gary at 7:24 AM

25 comments Links to this post


Saturday, May 3, 2008Patience
The longer I do this the more apparent it becomes to me that patience is one of the keys to success in the field of investing. Warren Buffett likens it to a batter standing at the plate waiting for that perfect pitch. The thing is he can take as many strikes as he wants. There are no strike outs in investing just because you aren't ready to swing.

The patience to wait for that perfect pitch is often the difference between getting stopped out or taking a severe drawdown and hitting a home run. The patience to hold on to your position once you have it is usually the difference between getting thrown out at second base and winning the seris. All great investors that I know of exhibt this trait in spades.

It's tough for precious metals investors to sit on their hands and wait for that sweet pitch right down the middle of the plate. After what the metals have just done it's hard to sit still and wait for the correction to finish. The fear of missing another big move can conjure up all kinds of bottoming scenarios. Luckily for us we have a pretty darn good indicator to tell us when to reenter in the COT reports. What better time to start buying than when the big money is also buying.

So for now I know it's tough but the best course of action is to sit still or look some place else where the pitcher is throwing that slow ball over the plate. Right now in the gold sector we're trying to face down Nolan Ryan.

Posted by Gary at 9:32 AM

17 comments Links to this post


Wednesday, April 30, 2008China opportunity
China is one of the few places I'm seeing significant potential on the long side at the moment. While commodities are obviously still in a secular bull market almost all of them have gotten extended above their moving averages and need to correct or at least trade sideways for a while. Add in the fact that the dollar may be setting up for a major rally and I don't see huge upside potential there yet.

The US markets seem to be mired in a trading range. Even if they did break out I don't see the stock market surging to huge new highs anytime soon. For that to happen the Fed would have to flood the world with more liquidity. That strategy has already ignited inflation. No I just don't see huge upside in the US markets at this time.

I've said before that bear markets create opportunity. One of the worst has been in the Shanghai stock exchange. The SSEC lost over 50% of of it's value during the recent 4 year cycle low. In my opinion that created one heck of an opportunity for those willing to see it.

I don't believe for one minute that China is in a bubble. China is expanding rapidly. For a communist country China has some of the best capitalists in the world. This growth is not going to go away. I'll tell you what else I like about China. The central bank is tightening interest rates trying to control inflation. That's a plus. While the US is busy squandering billions to police the world, ostensibly from weapons of mass destruction, China is busy buying the natural resources they need. It's much cheaper to just buy what you need than to try and take it by force.

The Shanghai index is one of the few markets that look primed for major moves up along with India and a few other emerging markets. Until the commodity markets are done correcting I think this is probably one of the markets with the most potential on the long side.

Posted by Gary at 7:32 PM

53 comments Links to this post


2nd counter trend rally
I think it may be time for the 2nd counter trend rally in the dollar. The first rally came after 3 years of decline. The current decline lasted almost 2 1/2 years. I was expecting new lows in the neighborhood of 15% below the 04 bottom. The dollar dropped 12.5% below the previous low. That's probably close enough. The last bounce took the dollar above the 40 week moving average and tacked on 15%. If this shapes up to be another counter trend move, 15% would take the dollar back up to resistance in the 80 range.

During the last counter trend move the stock market was range bound for the most part of 05. In a secular bear market stocks are going to need bigger and bigger infusions of liquidity to maintain the upward trend. If the Fed is going to try to drain liquidity from the markets I would expect more of the same sideways trading. This may accomplish the goal of bringing down commodity prices temporarily. However once they start inflating again commodities are going to bounce right back.

Posted by Gary at 6:28 AM

36 comments Links to this post


Monday, April 28, 2008In good company
Jim Rogers is the kind of company I like to have in my investments. He's also buying China.

Posted by Gary at 4:44 PM

38 comments Links to this post


Friday, April 25, 2008Gold's monthly chart
Unless something drastic happens in the next week gold is going to complete a monthly swing high. Every other correction during Gold's bull market has seen one of these monthly swing highs. Also notice that gold has corrected back to the 12 month moving average on every correction. Depending on how long this correction lasts that could come in at anywhere from $790 to $850.

So is the bull market over? Doubtful. Once we finish this move and the commercials cover their shorts I will be looking to get back in at much lower prices for the next leg up. I don't know whether that will be in a couple days, a couple of months or next year. Will I sell my core position? What are you crazy? Where would I be if gold decides to end the correction tomorrow and I had no position?

At some point in this bull market there will likely be a down year. Maybe it will be this year I don't know. This is just how bull markets work. They make it as hard as possible to stay onboard.

I do think the COT report should get us back in pretty close to the bottom so I'll just bide my time until I get the green light.

Posted by Gary at 8:14 AM

10 comments Links to this post


Thursday, April 24, 2008Global warming???
As anyone can tell you the use of fossil fuels and the rise in CO2 emissions is the main cause of global warming...or is it? The truth that none of the environmental groups want you to know is that there is no actual scientific evidence of global warming. That's not to say it isn't happening just that there is no hard proof. As a matter of fact nothing is happening today that hasn't happened many times in the past. The Earth just naturally goes through periods of rising and falling temperatures.

Several years ago NASA launched a series of weather satellites that have been taking very accurate measurements. NASA recently released that data and it actually showed global temperatures stopped increasing in 1998. The big warming that everyone has been worried about since the 70's is a whopping .7 degrees. Actually since 2002 temperatures have been trending downward by .4 degrees. This despite CO2 levels that are still increasing.in depth story if you want to read the whole thing.

I'm going to guess that funding for the environmental groups is probably better if they conveniently leave out the truth about global warming.

Posted by Gary at 9:58 PM

22 comments Links to this post


Newer Posts Older Posts Home
金币:
奖励:
热心:
注册时间:
2006-7-3

回复 使用道具 举报

 楼主| 发表于 2009-3-22 15:33 | 显示全部楼层
Saturday, April 19, 2008Overbought, up against resistance in a down trending market

I have a feeling the market may be setting up for another test of the lows soon. Notice in Feb. the S&P pushed back up to the consolidation zone of the T1 move and backed off. The Nasdaq however didn't even come close to testing the midway consolidation. Now it's a different story. Both indexes are pushing up into this resistance level. Now on top of that both indexes are about as overbought as they have gotten short term during this entire decline. Add in the fact that the selling into strength as of the close friday was the highest ever seen in the SPY ETF and I think we have the setup for another test of the Mar. lows. At the very least the NDX needs to fill at least a couple of the gaps. Notice the low volume on the recent moves in the cubes. In the past the odds have not been good when the cubes have gapped up by large amounts on low volume. I think we need to see some kind of test on the NDX if this rally is going to be sustainable. I will be watching the money flows buying into weakness as a signal to cover shorts. At the moment I'm still of the opinion that we have seen the 4 year cycle low but that may change if the market violates the Mar. lows by any significant amount.

BTW you can find the technical rules on the lower right side of the home page.


Posted by Gary at 4:20 PM

50 comments Links to this post


Thursday, April 17, 2008Debasing the dollar


This post is for all the bears out there (and I know there are a lot of you). Many of you are wondering if all of a sudden the collapse of the housing market is finished, if the banks are all of a sudden out of hot water, etc. I'll be the first to sound off with a resounding NO. No way in hell are we even close to being out of this mess. We had the largest real estate and credit bubble the world has ever seen. That doesn't get cleaned up in 6 months. No this will be a multi year process. It's been 8 years since the tech bubble burst. Thousands of companies have gone out of business and we still aren't even close to making new highs yet in the Nasdaq.

So far we haven't even seen one of the big home builders go out of business, although I suspect we will.

So far we've only seen one big bank go down (well it would of except the Fed bailed out BSC)

No this has several years yet to play out. It all depends on if the Fed let's the market do it's job and clean out the excesses or if they continue to try and prop things up as to how long this will last.

So if this still has years to go how come the market is rallying like it has already discounted the worst? I think it's for the same reason the last bear market ended. The Fed is again flooding the world with liquidity. Notice in 2001-03 how much the dollar declined. It took that kind of debasement of our currency to halt the bear market. It took a continued debasement to sustain the rally until 07. The reason it worked is because commodity prices at that time where just entering into a long term bull market and were still very depressed.

Now the Fed is applying the same cure to the present ills. However the environment is hardly the same as it was in 01. Commodity prices are now skyrocketing from 7 years of monetary inflation along with the problem of good ole supply and demand. So for the Fed to try and halt this bear in the same fashion as it did in 01 they will be throwing gasoline on the fire of commodity prices. Doesn't make sense does it but I think they are doing that very thing.

Look at the first chart of the dollar. Every time in the past that the dollar has gotten stretched 8-10% below the 200 DMA it has either bounced or traded sideways back to the 20 week moving average before resuming the primary downward trend. However now look at the last chart. After having gotten stretched almost 10% below the 200 DMA the dollar has now closed below the recent low without ever having come close to bouncing back up to the 20 WMA. If this continues and we see another leg down it will be unprecedented. It will also be a sign that Bernanke and co. have pulled out all the stops in an attempt to halt the bear market and have decided to sacrifice our currency to that end.

So while I think the fundamentals for the bear market are hardly over I also think the Fed is going to print however many dollars it takes to keep this market levitated for as long as possible.

How long this continues is just a matter of how long the economy can hold together with inflation spiralling out of control.

Posted by Gary at 6:58 AM

42 comments Links to this post


Tuesday, April 15, 2008Follow the money
I'm putting up the chart of the CRB again, this time with an S&P overlay. Since Oct. the general stock market has been in a bear market and during this time the Fed has been furiously slashing rates and pumping liquidity into the system. So over all what has been the effect?

Well they've managed to stem the decline in the stock market but in the meantime commodities have been in anything but a bear market. As a matter of fact it looks like commodities have been on a diet of nitro the last 5 months. All bull markets have corrections. It's just natural because all bull markets get ahead of themselves from time to time. That's just human nature at work. So we got a correction in the commodity markets recently. Of course all the doubting Thomas's of the world immediately came out to let us know the commodity bubble was finished.

So what really happened? We got 4 down days. That's right 4. Somehow 4 down days equates into the end of a 7 year bull market. A bull market which BTW is now only about 1% from making new highs. You want to know why the commodity markets are resisting any decline? Because commodities are still not expensive. The fundamentals still haven't changed.

You want to know why stocks aren't rocketing to the moon after this decline? Because stocks are expensive. At 20 times trailing earnings stocks are at levels that have capped many bull markets. Never in history have stocks shown great long term returns or even good long term returns at these valuations. Now when stocks get cheap and by cheap I mean P/E's in the single digits, then I will be selling my commodities as fast as I can to buy stocks. Probably biotechs as I think that will be the next major growth area like the Internet was in the 90's.

Posted by Gary at 5:39 PM

52 comments Links to this post


Saturday, April 12, 2008Is the commodity bull finished?

I've been told in no uncertain terms recently and over the last 3-4 years that commodities have topped out every time we get a correction. That commodities are in a bubble. That commodities will now enter a long term bear market. Etc. etc. etc.

Let's take a look at commodities shall we?

In the first chart we see that the CRB has now completed a 1-2-3 reversal. We also see the commodity index that is 2.8% below all time highs. Can someone tell me how this implies that the commodity bull market is finished? I'm not saying the correction can't continue. I just don't see how anyone can infer at this time that the commodity bull market is finished.

Now lets look at the second chart. We see the fifth year correction in 06 which is typical of secular bull markets. We also see a recovery and breakout to new highs. Note the size of the consolidation. I've pointed out before the correlation between the the size of the consolidation and the length and magnitude of the following rally. So far this rally is rather small considering the size of the consolidation. This would suggest that this rally isn't done yet.

Now let's address the bubble sentiment. Again let me remind everyone that you just don't get a bubble until two things happen. First off the general public has to embrace the asset hook line and sinker. We saw this public participation in both the tech bubble and the real estate bubble. Thus they qualified as a bubble. We are not seeing any public participation in the commodity sector yet to any significant degree. The other condition for a bubble is massive oversupply. Again we saw oversupply in both the tech bubble with incredible numbers of nonprofitable companies going public on the hype of how many eyeballs they were attracting to their web sites and in the real estate bubble with massive overbuilding most of which was bought by speculators. Now that the speculators are now longer buying we see many many months of supply in the real estate sector.

We have no oversupply in the commodity sector yet. The world is currently struggling to meet demand even as it enters a recession. As a matter of fact we probably need a world wide recession for the oil markets to just barely keep up with demand.

Even though we've been in a secular bear market since 2000 there are still 40,000 funds that one can choose from to invest in stocks and bonds. Anyone want to take a guess how many natural resource funds are available now that commodities are supposedly in a bubble?

Less than 500.

Posted by Gary at 9:04 PM

29 comments Links to this post


Thursday, April 10, 2008Gold sentiment too bearish
Mark Hulbert says gold sentiment is too bearish. I mentioned before that I love it when the blog is filled with investors telling me that gold and silver are finished. That they are in a bubble. That adjusted for inflation they are a terrible investment. These comments are music to my ears. This is not how bull markets end. Bull markets end when everyone thinks gold will continue to rise forever. Just like real estate never goes down or tech has entered a new era where profits don't matter. All that matters is how many eyeballs look at your site. No my friends the bull market is quite intact and looking as healthy as ever if sentiment is any indication.

Posted by Gary at 2:45 PM

19 comments Links to this post


Newer Posts Older Posts Home
金币:
奖励:
热心:
注册时间:
2006-7-3

回复 使用道具 举报

 楼主| 发表于 2009-3-22 15:34 | 显示全部楼层
Computer Problems
My computer crashed this morning and I can't get anyone out to fix it till tomorrow. I'm using a friends computer to post this. I don't have access to my e-mail so there will be no update tonight. If anything important happens I'll just post it on the blog.

Posted by Gary at 10:00 AM

10 comments Links to this post


Tuesday, April 8, 2008QQQQ:Silver ratio


I'm responding to Tom's assertion that the Q's have been a better investment than silver. Since 02 silver has appreciated 4 times as much as than the NDX. Even if you pick the exact bottom in 02 silver has appreciated almost twice as much as the NDX. In 02 it took 10 oz. of silver to buy one share of the cubes. It now takes 2.5 oz. I don't know about anyone else but I think I'll keep holding my silver. Now you really don't want me to put up a chart starting in 2000 when the secular bear market started because it will be much worse. Likewise you don't want me to compare the Q's to oil or base metals as it will also be much worse. It's not what you know that hurts you. It's what you think you know that just ain't so.

I've added a long term chart starting at the end of the last commodity bull cycle. We can see that stocks clearly outperformed silver until 2000. At that point stocks became grossly overvalued and silver terribly undervalued. Now the trend has clearly changed in favor of silver. Does anyone see anything that would suggest that this trend has changed? Is silver grossly overvalued yet? I'll point out again that human emotions don't swing to the average. We always go to extremes. That's just how fear and greed work. It's never changed in all of recorded history as far as I know and I seriously doubt that it's changed now. As a matter of fact looking at the tech and real estate bubbles I would say it's operating as strong as ever. No this trend won't change until we've taken it to the bubble phase. That's still many years away yet.


Posted by Gary at 5:35 PM

26 comments Links to this post


Monday, April 7, 2008What DOES the future hold?

Here are two of the last great bear markets. The first one is the US markets between 66 and 82. The next one is the Japanese Nikkei since 1990. You want to know what was similar about both of them? Yep the government tried to prop everything up. The natural forces of the market weren't allowed to play out. In Japans case the financial system was not allowed to cleanse itself. (sound familiar? Think BSC) The end result in Japans case is an ongoing 18 year bear market. The US fared a bit better but not much. When we got entangled in Vietnam the country started printing money to pay for that war. Alas human nature will never change. We will always try to get something for nothing. The final stage of a bubble is caused by investors desire to get rich without having to actually do anything. (all one has to do is by tech and retire or housing only appreciates).

In the 80's we got lucky with Volker. He was willing to take the necessary painful steps required to clean out the system so the economy could start fresh.

Fast forward to today. So far I see no hint that Greenspan was or Bernanke is prepared to make the tough decisions necessary to cleanse the system of the excesses created in the last decade and to set the foundation for the next major bull market. As a matter of fact I see the exact same behavior that Japan has followed since 1990 and that the US followed in the 60's and 70's. Namely run the printing presses, try to inflate away debt and patch the problems.

Until the powers that be accept the fact that you can't get something for nothing I expect we will continue to be mired in a long term bear market similar to the last one with rising inflation and slow or stagnating growth.

In this type of investing climate you have two avenues to make money. You either have to be a great market timer or you have to stay invested in commodities.....The second one is easier.

P.S. I'm getting tons of e-mails questioning my call that the 4 year cycle low is in especially since I think we are still in a recession. I'll have my view of what is in store now that I think we've seen that low in tonight's update.

Posted by Gary at 9:32 AM

47 comments Links to this post


Saturday, April 5, 2008It's starting!!
Inflation is starting to take it's toll. Three airlines have now gone out of business in quick succession. ATA, aloha and now Skybus have filed for bankruptcy recently. One of the major causes in all three failures, high fuel prices. Who knew? Now we are seeing that many of the truckers around the country are contemplating striking in protest of high diesel costs. We've already seen the writers guild strike. Americans are having trouble paying the escalating costs of living. Does anyone realistically think this will be the end of this or is it more likely only the beginning? Since the Fed has shown no inclination to halt the cause of inflation, namely massive monetary expansion, then I'm guessing we're just entering the second inning. I fully expect congress to go down the price control avenue again. First it will be on oil pricing. I expect to hear rhetoric by this summer from politicians about how the evil oil companies are driving up the price of energy. In fact I'm already starting to hear this on some of the business channels. (funny how the media nevers talks about the evil government taxes on gasoline driving up prices.) Amazing since the XOM, CVX and COP of the world are only tiny players in the energy markets compared to the state owned companies. I wonder how the politicians plan on regulating Saudi Aramco. I fully expect legislation to prevent truckers from striking will come forward soon. For any of you who lived through the 70's does this sound familiar? While I expect the market has put in a bottom for a while probably at least till the elections, the Fed is laying the foundation for much more serious problems. Problems that can't be cured by flooding the world with money. In fact, problems that are caused by flooding the world with money. But hey when have politicians ever worried about the future?

Posted by Gary at 8:08 AM

25 comments Links to this post


Wednesday, April 2, 2008The big picture


Often when the daily noise gets confusing it's helpful to step back and look at the long term perspective. In the first chart we see the S&P. Notice that during the entire bull market the corrections were fairly uniform. 7-10% was the norm for every correction on the way up. Once this bull market became mature any correction that exceeded that norm would likely be a sign that the bull was done. We saw that correction in Jan. once the S&P dropped over 13%. Looking at the long term view of the general stock market one has to say we are in a bear market until proven otherwise.


Now let's look at gold over the same period. So far all corrections have been uniform in the 10-15% range except the 06 correction. That waterfall decline had to potential to begin a bear market in gold as it exceeded the "normal" correction up to that point. However gold didn't respond like it was in a bear market. Instead of the trend reversing gold preceded to chop back and forth gradually working higher and in the process building a large base. Not typical bear market action. The end result, we experienced another runaway leg up in the precious metals this year. About what should be expected as gold is in a secular bull market. Since I've been along for almost this entire ride I can tell you that every single one of these corrections has been accompanied by the Chicken Little's of the world coming out and telling us how the dollar is starting a multi year bull market and how gold is in a bubble and the run is over.


Moving on the the next chart I'm going to show you why I think the run is still in the early stages. I've pointed out in previous posts that the size of the consolidation is often a good measure of how large the rally will be once a breakout occurs. I've noted the consolidations so far in this bull on the chart. For the most part the rallies have roughly equalled the consolidations. But let's ignore these for now and again look at the big picture. What we see is a huge almost mind boggling 20 year consolidation in the gold market. We also see that gold has just now broken out of that consolidation. I have no doubt that before this bull is done we will ultimately see a rally of similar magnitude as this huge consolidation. Gold when it's all said and done is going to go higher than any of us can possibly foresee. That being said I think silver will end up putting gold to shame simply because the fundamentals are much stronger and it will be more affordable for the public when we finally do enter the final blow off stage.


While I'm at it take a look at the S&P:CRB ratio. When the trend is up stocks are outperforming commodities and when its heading down the opposite holds true. Now I have to ask, since the stock market is quite likely in a bear market and commodities are still showing no signs of a top why would anyone want to take a chance investing in stocks? This trend is only 8 years old. The average commodity cycle is 15-22 years. Trying to call the end of the commodity cycle at this point would seem to be a rather dangerous proposition.

Posted by Gary at 10:43 AM

53 comments Links to this post


Sunday, March 30, 2008Inflation is here to stay
Today I'm going to point out what I consider to be critical fundamental conditions that virtually guarantee the continuance of the bull market in commodities. Consider that the economy is now in recession. I don't think too many people will try to deny this fact. What is the only realistic response from the Fed to this? They have to print money. There's just no way they are going to drain liquidity during a recession. This is the road to deflation and depression. I just don't see any realistic possibility that the Fed would start to constrict money supply during a recession. So if the Fed is expanding money supply I just don't see any sensible reason for either the dollar to appreciate or commodities to fall other than for a short term correction of an overbought level. Next consider that we have unpayable debts in the form of Social Security and Medicare. Add to that two wars and again we have fundamental conditions that exclude the possibility of reducing the money supply. So even when we do come out of the recession these debts will still be there. Debts that are only payable by debasing the currency. So until I see a Fed raising rates aggressively to control inflation I just don't have any reason to expect a reversal of the long term trend of higher prices for commodities.

BTW does anyone find it funny that we are now giving the Fed responsibility for financial regulation when it was the Fed who caused all the problems in the first place by lowering rates to 1% and trying to avoid any pain when the tech bubble burst? The very same Fed who are now expanding money supply and again lowering rates as inflation is soaring. The very same Fed who are now laying the foundation for the next catastrophe.

Posted by Gary at 7:38 PM

62 comments Links to this post


Newer Posts Older Posts Home
金币:
奖励:
热心:
注册时间:
2006-7-3

回复 使用道具 举报

 楼主| 发表于 2009-3-22 15:35 | 显示全部楼层
Friday, March 28, 2008A Bull and a Bear


So far the bull market in commodities and the bear market in stocks are doing exactly what they should be doing. By that I mean the bear is in the process of taking stock valuations down to extremely depressed levels and the bull market in commodities is in the process of taking commodity prices to levels of ridiculous overvaluation.

Notice the trailing PE has gone from 45 (I think that's pretty close) in 2000 to 29 at the bottom of the last 4 year cycle low. BTW 29 is still ridiculously expensive. 29 is higher than almost every other bull market topped out at. That alone made it clear that the bear was hardly over in 2002. Now today the S&P has despite rallying for 5 years dropped to 18 times trailing earnings. PE ratios are compressing despite record earnings. Still 18 is hardly undervalued. As a matter of fact it's a little on the high side of average. No the bear still has a lot more work to do yet. It won't happen overnight especially with the Fed willing to debase the currency to any extent to keep the bear at bay. Unfortunately all this is going to do is make the process all that much longer and more painful.

Now let's look at the Dow:Gold ratio. Here we see the bull in the process of doing what he does, namely taking commodities to extreme overvaluation. At the top in 2000 it took 42 oz. of gold to buy one share of the Dow. That ratio is now down to 13. Again hardly ridiculous overvaluation yet. Seeing as how the last two commodity bulls took the Dow ratio to 2.5:1 and 1:1 we still have a long way to go here also.

Now look at the last chart specifically from 66-82. The Dow went nowhere. However in valuation terms it dropped sharply. The trailing PE in 74 was around 7 if I'm not mistaken. Also notice that the stock market was unable to make significant new highs during this entire 16 year period. Now look again at the first chart. See any similarities? Keep in mind that in inflation adjusted terms the S&P was still very far below the 2000 peak at it's high in Oct. of last year.

Posted by Gary at 6:59 AM

69 comments Links to this post


Wednesday, March 26, 2008Possible low pole reversal coming?
One more X and we will have a low pole warning on SLV. Notice the long tail down. Also notice that this occured above the rising trend line. A bullish configuration would form if SLV can recover at least half of that long tail down. About 20-30 cents on silver will do the trick.

There's been a lot of concern about the correction in PM lately. While it's never fun to watch your position go down I can assure you that the real worry is not having a position. Before this is over all these corrections are going to seem trivial. Just look at a 5 year chart of silver. The corrections back in 03 and 04 hardly show up on the chart. When I say that all timing mistakes are going to eventually be corrected by the bull I'm not kidding. So there's no need to beat yourself up if you happen to enter too late in a cycle. There is a need to beat yourself up if you don't get in and stay in. Well that is unless you want to miss the opportunity of a lifetime.


Posted by Gary at 1:59 PM

55 comments Links to this post


Tuesday, March 25, 2008Is the stock market a screaming buy?


When should you buy? The age old question. The old Wall street adage says "buy when there's blood in the street" There's a lot of truth in that one. Here's my signal for when to buy. When I'm scared to death I'm going to lose money. It's that simple. Look at the first chart of the S&P. I remember investors were sure we were headed for the end of the world at the time. Nobody was brave enough to buy back in Aug. However the COT's were wildly bullish. Result the market rallied back to new highs. Now look at silver during the same time. Again popular opinion was that silver was only headed lower as it had not confirmed the strength in gold. If you had bought then you surely would have lost money. I can tell you it was tough to make that phone call on the 17th and place a huge order for physical silver. I think my knees were actually weak. Now look at the stock market over the last 4 days. The sentiment has gone from bearish to wildly bullish in less than a week. The large contract in the S&P is negative and getting more so. Smart money unloaded a ton of stock into Thursday's rally. This rally is not investors buying because they are scared to death of losing money. This is investors buying because they are scared to miss a rally. I'm seeing some of the same sentiment in the PM from e-mails I'm receiving. Investors are worried about missing the next move in the PM. This in my opinion is not a good reason to buy stocks or PM either one. I want to wait until everyone is scared to death (including me) before I commit my capital.

Posted by Gary at 6:15 AM

54 comments Links to this post


Saturday, March 22, 2008The stock market as a discounting mechanism
Well sometimes anyway. Then again sometimes the Fed tries to interfere with the markets. I would have to say the Fed is desperately trying to tinker with the markets lately. In Aug. we had the big correction. The market was trying to discount a coming recession. However if you notice the dollar line on the chart this is where the Fed decided to debase the currency and prevent the market from doing it's job of discounting future earnings. This is the point at which the dollar was allowed to break below historical support. This is the point at which the Fed decided to run the printing presses full speed ahead. So what was the outcome of all this money printing? The market popped back up to nominal new highs. Yeah! But wait a minute the market quickly rolled over into a bear market. Despite the all the Fed's efforts they have not been able to stop the recession from happening. All they have succeeded in doing is making it worse by adding a growing inflation problem to the mix. Remember all the PPT proponents out there who would cry wolf every time the market rallied? As I said then and I'll say now the larger trend of the market can't be controlled for any length of time. Just look at the above chart and you will see that despite titanic efforts by the central banks of the world the recession came anyway. Has the Fed learned anything? Apparently not since they are still doing the same thing, namely debasing the currency. Now some free money might be good for a few investment banks that are about to go under but it is not good for the US economy that has to live with a growing inflation problem. The bottom line is that as inflation rises margins get squeezed and consumers get pinched. None of that is good for future earnings. If earnings are going to be declining then I really don't see the rational for paying up for those decreased earnings. So while we may or may not be in store for a bounce in the market because sentiment got a little too stretched on the bearish side I still don't see any fundamental change that would make me a buyer of anything other than commodities (once the correction is over).


Posted by Gary at 10:58 AM

56 comments Links to this post


Thursday, March 20, 2008Commodities correcting
I know there are many who don't see much value in the COT's. With the correction in commodities now upon us this is where the COT's will be worth their weight in gold (pun intended). As I noted last week I reduced my precious metal holdings back to my core position. Now I need some kind of signal to let me know when it's safe to get back in the water again. This is where the COT's come in handy. I don't want to start buying again until the commercials are doing the same. I don't want to stand on the tracks in front of the train just follow behind it. At some point in the next few weeks or months we will likely get a buy signal for the metals from the COT. Until that time I will patiently sit and twiddle my thumbs. I'm also looking at the T1 signal. A trade back to the consolidation area of $800-$850 would satisfy the second part of a T1 trade before going higher. I expect it won't be long now before we hear the commodity bears coming out in force and telling us the commodity bull is dead. (believe me they will be squealing for years yet) I'll tell you right now that nothing is happening that hasn't happened before. For those that bought late and pushed it a little too far and are now caught in the correction my advise to you is what are you worried about? This is a secular bull market. The bull will eventually correct all timing mistakes. Stick those gold coins or silver bars back in the vault and forget about them.

One side note Robert L pointed out in the last thread the huge selling on strength today similar to what we saw in late Dec. right before the waterfall decline. As I pointed out in tonight's update I have no desire to trade the market from the long side. The larger trend is now down and I don't trade against the larger trend. I would have no idea when to sell as the larger trend can reassert at any time. If I had to guess I would think that commodities and the market will probably bottom at the same time. That's just a guess though and I have no special insight as to whether we've seen the 4 year cycle low already or not. Let's just say I'm still skeptical that the greatest financial crisis in history along with a spike in energy can be sidestepped with a meager 19% decline no matter how much money the Fed throws at the market. More in tonight's update.

Posted by Gary at 7:16 PM

17 comments Links to this post


Sunday, March 16, 2008Money Supply
I'm again having trouble downloading charts from the road so no chart with this one. I'll add the chart when I get back in town.
There seems to be some debate about whether the Fed is increasing the money supply. IMO all one has to do is take look at a chart of the dollar from 01 to the present. The dollar responds to supply and demand just like anything else. Too many dollars and the value drops. It's pretty easy to see that the Fed is printing too many dollars. Notice that in Oct. when the Fed allowed the dollar to break long term support the stock market began to struggle. This is the point where I said that the fun part of monetary expansion was probably over. Recently the dollar had a chance to find support but with the recent trouble in the credit markets not to mention the swoon in the stock market the Fed has opted to again sacrifice our currency in the attempt to avoid a recession. The results so far have been the same rising commodities and fading stocks. I'm not sure if there is a point where this strategy will work or not. I suspect that stocks are going to have to get cheaper before the excess liquidity will stay in the stock market instead of draining into commodities.

There also seems to be some discussion about commodities rising solely on speculation. While commodities do from time to time get ahead of themselves the underlying reason for commodity price increase is simply supply and demand imbalance . The bear market from 1980 to 2000 made sure that the infrastructure in the commodity markets was unable to keep up with the demand from emerging markets including China & India. We still have years before the supply side of the equation catches up to the demand side. This bull market will continue until it does.

I also notice but can't get a chart up that the Yen has now broken out above long term resistance. The next level of resistance is 80. If this level is reached it will put a lot of pressure on the markets. As I stated in the previous thread we should be able to rally from the extreme sentiment readings we've seen in the past couple of weeks. I suspect there's a lot of big money betting on the market rally at this point. If this money has to now sell then it could get ugly quick. I don't think the BSC insolvency is the only broker/dealer in trouble just the first. There is never just one cockroach.

The XBD broke to new lows Friday. Not a good sign. Without the financials this market is going to have trouble sustaining any serious rally.


Posted by Gary at 12:36 PM

103 comments Links to this post


Monday, March 10, 2008Back to the core position
I'm using a friends computer in Kansas City and for some reason I can't get charts to upload to blogger. I'm going to sell back to my core position this morning in PM. As I've said before the final drop in the 4 year cycle low takes down everything and this will include the PM. I think we are now starting that leg down (we may even have a third leg). There where some topping signs in last weeks XAU action and the break lower from the pennant in GLD makes me think that the T1 move is over. We should get a test of the consolidation zone now before the next leg up. Hopefully I will be able to make the early flight this afternoon. If so I will have the charts in tonights update.

Posted by Gary at 8:51 AM

95 comments Links to this post


Newer Posts Older Posts Home
金币:
奖励:
热心:
注册时间:
2006-7-3

回复 使用道具 举报

 楼主| 发表于 2009-3-22 15:36 | 显示全部楼层
Thursday, March 6, 2008Commodities in a bubble? What a joke


Anyone who reads the blog by now knows the ongoing debate about whether commodities are in a bubble or not. I just have to laugh when I see these kind of comments. This is the bulls way of shaking off only the most determined riders.

Anyway I'm going to show you how long term secular bull markets work. First off they almost always have a very scary correction usually around the 5th year that kicks off only the most die hard bulls. We saw that correction in the stock market bull in 87 in the form of Black Monday. Now take a look at the last chart and we can see that despite that being the worst crash in history it was hardly the end of the bull market. As a matter of fact looking back over the whole bull from 82-2000 it's an almost insignificant blip. Now in 06 we saw that 5th year correction in the commodity markets. I remember at the time hearing countless analysts calling for oil to drop back down to $10-15 a barrel. I had to laugh then too. We simply had not found and brought online the oversupply needed to end the commodity bull market. No this was just the expected correction that bull markets go through around that time frame. We are now into the second phase of the commodity bull. Take a look at that long term chart of the Dow again and you will get an idea of how long the second phase can last. Folks the second phase of the commodity bull is just getting started. We will see another very scary correction sometime in the future and everyone will think the bull is dead. However it will recover quickly and then the public will start to come into the market in droves. This will be the 3rd and final phase of the bull. We saw this correction in 98 in the form of the LTCM crisis. As I've noted previously during this final phase you will have about 1 - 1 1/2 years as the markets turn parabolic. After that it will be time to get out and go looking for the next bull which will of course be in paper assets again. This is just how the cycles work. At the moment commodities are so undervalued it's ridiculous. They only seem expensive because we are comparing them to the last 25 years of bear market pricing. Bull markets tend to increase values whether they be stocks or commodities by 1000-2000%. the stock market went from 600 to 11750 during the last bull. That's almost 2000%. Gold is only up a little over 300%. We haven't seen anything yet. So you can decide to take this once in a lifetime opportunity and get rich or you can listen to that little negative voice in your head and blow the greatest chance at financial freedom that many of us will ever see. It's your choice.

Posted by Gary at 5:56 PM

68 comments Links to this post


Wednesday, March 5, 2008Bonds overvalued

Read the whole story here. I suspect we are going to see a repricing in the bond market sooner rather than later.

As a matter of fact it may have already started.

Posted by Gary at 6:28 PM

70 comments Links to this post


Monday, March 3, 2008Another leg down for the dollar
As I write this I'm listening to Larry Kudlow complain about a weak dollar and gold heading towards $1000 an oz. Now correct me if I'm wrong but wasn't it Larry Kudlow, Jim Cramer and the media in general that were screaming for rate cuts in Jan. as the market was falling? I said at the time they should be careful what they wish for as they might get it. Well we did get the "Shock and Awe" rate cuts and now we are paying the price. People just can't accept the fact that there is no free lunch in this world. The consequences of cutting rates is a weak dollar. Did these people really think there would be no after effects of slashing interest rates? That all the Fed had to do to fix all our problems was to cut rates and expand the money supply? Do these people really believe this nonsense they spout? Ahh if it was only that easy to avoid recessions. Let's just keep interest rates under 1% and print all the money we'll ever need and we'll never have bad times again. Wait a minute hasn't Japan been using this solution now for 17 years? If I remember correctly the Japanese economy has been in and out of recession during this entire time and it apears they are headed back in at the moment.

If the dollar is starting another leg down then we probably have more room on the upside for the precious metals. Major lows in the dollar haven't occurred until the dollar has dropped 7.5-9% below the 200 DMA. The dollar is currently only 6.2% below the 200 DMA. We have plenty of room on the downside for the dollar to drop before it gets oversold enough to trigger a bounce. More in tonight's update.


Posted by Gary at 4:33 PM

94 comments Links to this post


Sunday, March 2, 2008I'm back on line
Finally I'm back on line and the old e-mail address is working again. gsavage4997@cox.net

Posted by Gary at 4:50 PM

15 comments Links to this post


Friday, February 29, 2008Gap through the trend

Last month I pointed out the gap through the trend on the financial ETF. This often signals a fundamental change in the market. Now a month later we can see that the financials are still locked in a downtrend. Today we have the potential for the SPY to gap through the trend line. If the gap holds and we close below the trend line today then the odds are probably on the side that this intermediate rally is done. This rally was born from the Fed cutting rates 125 basis points. So far no cuts have worked to support the market. Pure and simple we have two problems. The first one is spiking inflation especially energy costs. The rate cuts are just making this problem worse not better. The second problem is foreclosures in the real estate market are hurting the financial system. I think that in order to put in a bottom the market is going to have to see some kind of end in sight for this bleeding in the housing market. Unfortunately I don't think we are there yet. With a large supply of ARMs adjusting this year we could see another wave of stress in the real estate market. At this point it's probably to early to have an idea how big this foreclosure cycle is going to be. Until this uncertainty is clarified I believe we are still going to see stress in the financial sector.


Posted by Gary at 5:34 AM

52 comments Links to this post


Wednesday, February 27, 2008Hyperinflation here we come
Subconsciously I knew the Fed was going to opt for this since they have been going down this road for 7 years but I still find it hard to believe. The dollar has now broken to new lows. In an attempt to save the markets and wall street banks the Fed has now opted for hyperinflation. The process of devaluing the dollar to inflate the markets that has been in cruise control since 01 has now gone into overdrive. We now have a front row seat to a massive explosion in inflation coming down the road. The question is simply how fast the liquidity is going to leak into commodities. We've already seen the CPI and PPI show the largest jumps in years and that's the governments version of inflation. The question as to how fast this will crush the economy is how fast and far the price of oil rises. It has already broken out of a very large consolidation and closed over $101. Platinum, Palladium and now silver are all trading parabolic. Copper is trading parabolic and most of the softs are moving up in parabolas. Gasoline has jumped 20 cents at the pump in the last 2 weeks. The Fed is now guaranteeing that the slowing economy is going to be pushed into a very severe recession.

Now how can we have a rising stock market if the economy is going into a recession? Why are stocks moving up on bad news? The answer is right there in the chart. The Fed is creating artificial demand by pumping the money supply. We aren't at the bottom of a recession yet. That's when stocks are cheap and represent good value. That's the time when real demand will come in. The current rally is soley due to massive amounts of currency being injected into the markets. It is now a race between how much money the Fed can print and how fast it will leak into hard assets.

Think of it this way. Let's say instead of paper dollars the medium for currency was sand. Well sand is pretty abundant right. You can just go out and scoop up a bucket full of it. Well if anyone can obtain as much as they want why would you sell your products at a fixed price? The answer is of course you wouldn't. If everyone has access to the beach then you are going to start raising your prices. Well in the world we live in we don't all have access to the beach but the governments do. Believe me they are scooping sand like crazy right now. The laws of supply and demand will still apply. If the Fed wants to flood the world with money then people are going to want more and more of those dollars for their real products. Here's an example that I already find myself doing. The price of gas as everyone has probably noticed is rising. I now find myself stopping even if I don't need to fill up at a station that hasn't raised prices yet. All that means is that station will run out of gas faster and will quickly be raising prices since they can't keep the tanks full at these lower prices. We see the magic of inflation at work in real life. I do the same thing at the store. Anything on sale I buy it now instead of waiting till next week when the price has increased.

Posted by Gary at 3:23 AM

78 comments Links to this post


Newer Posts Older Posts Home
金币:
奖励:
热心:
注册时间:
2006-7-3

回复 使用道具 举报

 楼主| 发表于 2009-3-22 15:36 | 显示全部楼层
Thursday, March 6, 2008Commodities in a bubble? What a joke


Anyone who reads the blog by now knows the ongoing debate about whether commodities are in a bubble or not. I just have to laugh when I see these kind of comments. This is the bulls way of shaking off only the most determined riders.

Anyway I'm going to show you how long term secular bull markets work. First off they almost always have a very scary correction usually around the 5th year that kicks off only the most die hard bulls. We saw that correction in the stock market bull in 87 in the form of Black Monday. Now take a look at the last chart and we can see that despite that being the worst crash in history it was hardly the end of the bull market. As a matter of fact looking back over the whole bull from 82-2000 it's an almost insignificant blip. Now in 06 we saw that 5th year correction in the commodity markets. I remember at the time hearing countless analysts calling for oil to drop back down to $10-15 a barrel. I had to laugh then too. We simply had not found and brought online the oversupply needed to end the commodity bull market. No this was just the expected correction that bull markets go through around that time frame. We are now into the second phase of the commodity bull. Take a look at that long term chart of the Dow again and you will get an idea of how long the second phase can last. Folks the second phase of the commodity bull is just getting started. We will see another very scary correction sometime in the future and everyone will think the bull is dead. However it will recover quickly and then the public will start to come into the market in droves. This will be the 3rd and final phase of the bull. We saw this correction in 98 in the form of the LTCM crisis. As I've noted previously during this final phase you will have about 1 - 1 1/2 years as the markets turn parabolic. After that it will be time to get out and go looking for the next bull which will of course be in paper assets again. This is just how the cycles work. At the moment commodities are so undervalued it's ridiculous. They only seem expensive because we are comparing them to the last 25 years of bear market pricing. Bull markets tend to increase values whether they be stocks or commodities by 1000-2000%. the stock market went from 600 to 11750 during the last bull. That's almost 2000%. Gold is only up a little over 300%. We haven't seen anything yet. So you can decide to take this once in a lifetime opportunity and get rich or you can listen to that little negative voice in your head and blow the greatest chance at financial freedom that many of us will ever see. It's your choice.

Posted by Gary at 5:56 PM

68 comments Links to this post


Wednesday, March 5, 2008Bonds overvalued

Read the whole storysuspect we are going to see a repricing in the bond market sooner rather than later.

As a matter of fact it may have already started.

Posted by Gary at 6:28 PM

70 comments Links to this post


Monday, March 3, 2008Another leg down for the dollar
As I write this I'm listening to Larry Kudlow complain about a weak dollar and gold heading towards $1000 an oz. Now correct me if I'm wrong but wasn't it Larry Kudlow, Jim Cramer and the media in general that were screaming for rate cuts in Jan. as the market was falling? I said at the time they should be careful what they wish for as they might get it. Well we did get the "Shock and Awe" rate cuts and now we are paying the price. People just can't accept the fact that there is no free lunch in this world. The consequences of cutting rates is a weak dollar. Did these people really think there would be no after effects of slashing interest rates? That all the Fed had to do to fix all our problems was to cut rates and expand the money supply? Do these people really believe this nonsense they spout? Ahh if it was only that easy to avoid recessions. Let's just keep interest rates under 1% and print all the money we'll ever need and we'll never have bad times again. Wait a minute hasn't Japan been using this solution now for 17 years? If I remember correctly the Japanese economy has been in and out of recession during this entire time and it apears they are headed back in at the moment.

If the dollar is starting another leg down then we probably have more room on the upside for the precious metals. Major lows in the dollar haven't occurred until the dollar has dropped 7.5-9% below the 200 DMA. The dollar is currently only 6.2% below the 200 DMA. We have plenty of room on the downside for the dollar to drop before it gets oversold enough to trigger a bounce. More in tonight's update.


Posted by Gary at 4:33 PM

94 comments Links to this post


Sunday, March 2, 2008I'm back on line
Finally I'm back on line and the old e-mail address is working again.

Posted by Gary at 4:50 PM

15 comments Links to this post


Friday, February 29, 2008Gap through the trend

Last month I pointed out the gap through the trend on the financial ETF. This often signals a fundamental change in the market. Now a month later we can see that the financials are still locked in a downtrend. Today we have the potential for the SPY to gap through the trend line. If the gap holds and we close below the trend line today then the odds are probably on the side that this intermediate rally is done. This rally was born from the Fed cutting rates 125 basis points. So far no cuts have worked to support the market. Pure and simple we have two problems. The first one is spiking inflation especially energy costs. The rate cuts are just making this problem worse not better. The second problem is foreclosures in the real estate market are hurting the financial system. I think that in order to put in a bottom the market is going to have to see some kind of end in sight for this bleeding in the housing market. Unfortunately I don't think we are there yet. With a large supply of ARMs adjusting this year we could see another wave of stress in the real estate market. At this point it's probably to early to have an idea how big this foreclosure cycle is going to be. Until this uncertainty is clarified I believe we are still going to see stress in the financial sector.


Posted by Gary at 5:34 AM

52 comments Links to this post


Wednesday, February 27, 2008Hyperinflation here we come
Subconsciously I knew the Fed was going to opt for this since they have been going down this road for 7 years but I still find it hard to believe. The dollar has now broken to new lows. In an attempt to save the markets and wall street banks the Fed has now opted for hyperinflation. The process of devaluing the dollar to inflate the markets that has been in cruise control since 01 has now gone into overdrive. We now have a front row seat to a massive explosion in inflation coming down the road. The question is simply how fast the liquidity is going to leak into commodities. We've already seen the CPI and PPI show the largest jumps in years and that's the governments version of inflation. The question as to how fast this will crush the economy is how fast and far the price of oil rises. It has already broken out of a very large consolidation and closed over $101. Platinum, Palladium and now silver are all trading parabolic. Copper is trading parabolic and most of the softs are moving up in parabolas. Gasoline has jumped 20 cents at the pump in the last 2 weeks. The Fed is now guaranteeing that the slowing economy is going to be pushed into a very severe recession.

Now how can we have a rising stock market if the economy is going into a recession? Why are stocks moving up on bad news? The answer is right there in the chart. The Fed is creating artificial demand by pumping the money supply. We aren't at the bottom of a recession yet. That's when stocks are cheap and represent good value. That's the time when real demand will come in. The current rally is soley due to massive amounts of currency being injected into the markets. It is now a race between how much money the Fed can print and how fast it will leak into hard assets.

Think of it this way. Let's say instead of paper dollars the medium for currency was sand. Well sand is pretty abundant right. You can just go out and scoop up a bucket full of it. Well if anyone can obtain as much as they want why would you sell your products at a fixed price? The answer is of course you wouldn't. If everyone has access to the beach then you are going to start raising your prices. Well in the world we live in we don't all have access to the beach but the governments do. Believe me they are scooping sand like crazy right now. The laws of supply and demand will still apply. If the Fed wants to flood the world with money then people are going to want more and more of those dollars for their real products. Here's an example that I already find myself doing. The price of gas as everyone has probably noticed is rising. I now find myself stopping even if I don't need to fill up at a station that hasn't raised prices yet. All that means is that station will run out of gas faster and will quickly be raising prices since they can't keep the tanks full at these lower prices. We see the magic of inflation at work in real life. I do the same thing at the store. Anything on sale I buy it now instead of waiting till next week when the price has increased.

Posted by Gary at 3:23 AM

78 comments Links to this post


Newer Posts Older Posts Home
金币:
奖励:
热心:
注册时间:
2006-7-3

回复 使用道具 举报

 楼主| 发表于 2009-3-22 15:39 | 显示全部楼层
Sunday, February 24, 2008Historic bull market in commodites


We've got a 4 year cycle low coming sometime in the first half of this year I suspect. As I pointed out in the previous thread when this final low comes in it usually takes down everything and that includes commodities. I'll say right now that commodities are going to hold up better than the paper markets. They certainly have held up much better during the first leg down. The second leg is going to be when the real panic will be generated. This will probably play havoc with margin calls and everything is going to get hit including commodities. We'll see all the old familiar faces coming out and predicting the end of the commodity bull. The media will tell you that commodities were in a bubble and it's now bursting, yada, yada, yada. It will all be baloney and here's why.


Take a look at the first chart. This is the S&P/CRB ratio. What we see is a historic rise from 1980 to 99 in the price of paper assets compared to commodities. From 99 to the present we see a major trend change from paper to hard assets. Now let me digress for a second and remind everyone how human nature works. Our emotions take us from one extreme to another. The larger the extreme in one direction the larger will be the swing back the other way. We don't go from one extreme to average back to extreme. It would be much better if we did but that's just not how human emotions work. So now we are in the process of swinging back to extreme overvaluation in hard assets. Keep in mind the run from 1980 to 1999 was the biggest in history...by a long shot. So far we haven't even come close to approaching the level we saw in 1980. We're only half way there and 8 years have gone by. Now the average for a hard asset cycle is between 15 and 20 years. The shortest was 9 years from 71-80. At best we're likely only half way through this commodity cycle and if human nature unfolds like I'm sure it will, we will correct the historic undervaluation from 80-99 with a move to historic overvaluation before this is over. This bull should make the 71-80 commodity bull look like child's play. This makes sense as we are now seeing a huge segment of the global population expanding at a tremendous rate of growth. Fuel for this growth has to come from somewhere. It needs energy for one thing. Energy that hasn't expanded it's infrastructure or found a giant oilfield in 40 years. It needs basic materials. Again an area that has not expanded as the devastating bear market crushed prices for almost 20 years. If the price of what you sell is consistently going down I can tell you that you are probably not in a big hurry to find more of this cheap stuff. It costs a lot of time and money to bring more production online in the commodity bussiness. Not a big priority if you are barely hanging on to profitability.


Next take a look at the ratio of the S&P to commodity related equities. We see a steady move down as the S&P consistently under performs commodity based companies year after year.


In the last chart we see the Dow/Gold ratio for the last three great secular bull markets from 21-29 the gold ratio declined to almost 20/1. Meaning that it took 20 oz. of gold to buy 1 share of the Dow. When the trend changed that ratio declined to almost 2/1. Then the next great secular bull market from 32 till 66 took the Dow/Gold ratio back up to 28 oz. of gold for 1 share of the Dow. This was followed by another commodity bull cycle and a trip back down to 1:1 on the Dow/gold ratio. Then we have the greatest secular bull market of all from 82 to 2000. Gold was crushed to the point where it took 45 oz. to buy one share of Dow paper. Now we are in the process of correcting this gross undervaluation. I have no doubt that we will see the Dow/Gold ratio approach 1:1 again and if the extreme nature of the undervaluation is any indication then we could very easily see gold surpass the Dow this time.


Posted by Gary at 10:52 AM

45 comments Links to this post


Second legs down

Today I’m going to go over second legs down in bear markets. First off let’s go over the historic stats. The average gain for final legs up in bull markets is roughly 34% if my memory serves me right. As you can see from the chart we logged in a 29% gain which was pretty close. Something else that is important and that I’ve pointed out on the chart is the nominal new high in Oct. Remember me pointing out the huge net long position in the COT’s that kept getting bigger as the market dove into the Aug. lows. With hindsight we see that the long position was justified as the market hadn’t made that nominal new high yet. Now look at the 02 low and you will see the same pattern of nominal new lows that was the springboard for this cyclical bull market. These nominal new highs and new lows are pretty typical as investors become euphoric and buy the breakout or panic and sell the breakdown. Remember me pointing out the big reduction of longs in Sept. right before the final top? Some of that smart money was sneaking out the backdoor as the top was being put in.

Now we’ve had the first leg down in the bear market. The average decline for all bear market first legs down is 20% in about 4 months. The S&P logged in a 19% loss in 3 months. Pretty close. At the moment we are in the counter trend rally that should separate the first leg from the second leg down. The average decline for second legs down is roughly 19% in about 4 months.

I'll elaborate in today's update for subcribers with some historic charts and a look at some specific sectors.

Posted by Gary at 8:55 AM

26 comments Links to this post


Saturday, February 23, 2008NDX charts

I've been watching the charts of the cubes. I've noticed that the price pattern over the last month has been much weaker than the rest of the market. This is starting to look like a midpoint consolidation in a larger technical rule #1 move. Moving to the weekly chart we see the pennant pattern forming. Again these typically form about half way through a move. Also notice that the NDX didn't close below the 07 seasonal cycle low like the rest of the market. I suspect it eventually will, it's just a matter of time. The first half of the year has been a weak time for tech. We can see on the 5 year chart that the Jan. lows were never the final lows for any of the preceding 5 years of this bull. This has actually been the case for the last 7 years. Now that we are in a bear market I really doubt that the Jan. lows are going to hold on the tech stocks during a seasonally bad time of year, during a slowing economy and one that likely is already in a recession.


Posted by Gary at 9:31 AM

3 comments Links to this post


Wednesday, February 20, 2008Jim Rogers on commodities
I pay attention when Jim Rogers speaks. He has his own money and unlike many analysts or CNBC guests has no ulterior motives and no one he has to answer to. He tells it like it is. Here is his latest interview and his views on oil, gold and the commodity markets in general.

Posted by Gary at 7:56 PM

84 comments Links to this post


Yen still correcting
The breakdown out of the Pennant is still intact. IMO the strong Yen was the thorn in the Fed's side. No matter how much money they threw at the markets as long as the 1.2 trillion in carry trades were unwinding it wasn't going to do any good. Now the Yen is correcting the last advance. As long as this continues then I suspect the market should continue to drift upwards as the Fed unloads massive amounts of liquidity on to the markets. The key words here are "drift higher". The problem is that a great amount of this liquidity is leaking faster and faster into the commodity markets. When inflation starts to rear it's ugly head money will start to gravitate towards real things and away from paper assets. Sound familiar? Like maybe something we've been seeing for 6-7 years now. Only now it's starting to accelerate. ouch!

I will be watching for the Yen to approach that long term uptrend line and reverse as a sign to intiate shorts again.


Posted by Gary at 12:47 PM

12 comments Links to this post


Tuesday, February 19, 2008GLD gapping up
This morning Gld gapped above the upper trend line of the consolidation pennant. As I've mentioned before these often form at the midpoint of a move. Remember anything can happen and this mornings gap is no guarantee that the rally will continue. But it does push the odds a little more in favor of the rally continuing. The public is just starting to take notice of gold at this time. This is what's needed for a parabolic move to finish off this intermediate move, similar to what's happening in the Platinum and Palladium markets.


Posted by Gary at 8:07 AM

56 comments Links to this post


Saturday, February 16, 2008Silver COT
Today I'm going to point out something that I normally reserve for subscribers but I think it's important enough to put on the blog for everyone to see. So far the COT reports for gold and silver have continued to build larger net short positions as the price of gold and silver move up. That's about normal as miners use the futures market to lock in high prices. However there are also bullion banks that use the futures markets to suppress the precious metal prices. If gold was allowed to rise to $1000, $1200 or $1500 it would be readily apparent that we have an inflation problem. Rising oil can be written off as limited supply for the escalating price. Which to some extent is true. However all the gold ever mined is still around so it's not like we have a supply shortage. The major cause of the rise in gold is solely the fault of excess liquidity created by central banks around the world. I've stated many times that I'm not brave enough to short gold. If it corrects then I will be happy to buy more but no way will I short. It's just too risky. Now let me show you what I mean. I'm going to use Platinum and oil as an example. Both had extremely large short positions in the COT's at the beginning of Jan. For oil the commercials used any weakness to drastically reduce shorts. What has happened oil's decline was halted and it's now in a trading range and apparently back on its way to test $100 again. Keep in mind this is happening as the economy is at the minimum in a drastic slow down and likely in a recession. I don't buy the idea that commodities are going to take a huge hit in a recession. Nope not for one minute. The Fed is printing too much money to allow commodities to fall much. Now let's take a look at Platinum because I think it shows us extremely well the danger of being short when the commercials have a large short position. Since Jan. the price of Platinum has refused to drop no matter how much the commercials shorted it. Then the news about mining delays in South Africa surfaced. The price of Platinum started to move up even faster. What did the commercials do? They panicked and started to cover into strength. A short squeeze followed. What has happened to the price of Platinum? It has now gone parabolic which has caused the commercials to cover even more.The bullion banks are in the exact same situation in the gold and silver markets. They have a huge short position on. They have been losing billions as the price of the metals move up. If this continues they are going to panic also and have to cover into strength. If this happens we are going to see the same parabolic move in gold and silver as we've seen in Platinum.This is why it's so dangerous to try and short the metals at this time. If there is a pullback then use it to buy more but this thing is a ticking time bomb and I don't have any idea whether the powers that be will get it defused before it goes off or not. Let's just say I want to be in the rocket chair just in case it does.

I'll elaborate in this weekends update.

Posted by Gary at 7:55 AM

24 comments Links to this post


Newer Posts Older Posts Home
金币:
奖励:
热心:
注册时间:
2006-7-3

回复 使用道具 举报

 楼主| 发表于 2009-3-22 15:40 | 显示全部楼层
Thursday, February 14, 2008GLD
I'm watching the small pennant forming in GLD. Usually these occur about half way through a move. A break to the downside and I would expect a move back down to the consolidation area of Nov. and Dec. However if GLD breaks up I would expect a move of similar magnitude as the first leg from Dec. to Jan.


Posted by Gary at 6:50 AM

34 comments Links to this post


Tuesday, February 12, 2008Secular bear markets
We've had this discussion before as to whether stocks have been in a secular bear market since 2000. The recent market action over the last 4 months makes it a little easier to accept the fact that we are in fact in a long term bear market in paper assets. In 2000 the P/E on the S&P was over 40. Today it's down to the 14-15 area. 15 is about the long term average P/E for the market. So we aren't overvalued here by any stretch of the imagination. When the market bottomed in 02 the P/E for the S&P was roughly 27 if my memory serves me. So basically at the last 4 year cycle low the market was still extremely overvalued. What's happened? Well the Fed turned on the printing presses. That liquidity flowed not only into commodities but also into corporate earnings. So the E side of P/E's has increased. Unfortunately there has been a cost for those increased earnings. Of course one of the prices we are paying is higher inflation. However that's not the only price we are paying. It was easy money that created the tech bubble. In 2002 to 2007 easy money also created the real estate bubble and the credit bubble. Bubbles aren't sustainable. We've seen the real estate bubble collapse leave a swath of destruction in its path of falling home prices, foreclosures and home owners in dire straights. Following hard on the heels of the bursting housing market we are now watching the collapse of the credit bubble with the attendant collapse in the financial sectors. The lesson of course is that there is no free lunch. The Fed was unable to "cure" the fall of the tech bubble with easy money. All they did was create two larger bubbles that are now blowing up and in the process are affecting a lot more people than the stock market bubble popping did. We are getting a front row seat as to how secular bear markets work. There is no easy way around them. There's no quick fix. As a matter of fact all the efforts to side step the bear are just making the problems bigger and badder.One thing that you can count on from the markets is that they will swing from overvalued to undervalued over long periods of time. They don't swing from overvalued to fair value and then back to overvalued. Not once in history has this been the case. So far the market has moved from extreme overvaluation in 2000 to fair value. Mostly on the back of easy money. Now that policy is coming back to bite us in the ass. The Fed's response is more easy money. It has to go somewhere. I seriously doubt we are going to make the same mistake again so quickly and reflate either the real estate or credit bubbles. No this time the money is going to go into the commodity markets. The Fed is sowing the seeds for the next leg down in the bear. That of course will be soaring inflation. Make no mistake this bear isn't going to end until stocks become extremely undervalued, just like every other time in history. We are going to have rallies that will fool everyone into thinking that the bear has been conquered but I guarantee he won't be until his work is finished. For the last 7 years the Fed has just been feeding the bear more and more food.

Posted by Gary at 6:05 AM

50 comments Links to this post


Sunday, February 10, 2008Runaway move intact
It appears that the runaway move in gold is still intact. The corrections now fall in the $50-$60 range. The odds are now strong that the move will continue until we see a correction that exceeds this magnitude.


Posted by Gary at 9:07 AM

45 comments Links to this post


Friday, February 8, 2008currencies


Yesterday we got the answer to whether the Yen would break up or down out of the consolidation. We also saw the Euro dropping big yesterday. The pound has been going down for some time. This is one of the things I was looking for as a signal that the rest of the world was going to capitulate and join the inflation train. Britain has been on board for some time but I think the odds are now good that the Euro zone and Japan have finally panicked and turned on the printing presses. This may be a positve for the dollar but it's also going to be a positive for commodities in general. Yesterday we saw the unusal occurence of the dollar very strong and gold also moving higher. As long as the Central banks around the world are going to flood the globe with paper then commodites are going to continue to move higher in every currency.


Posted by Gary at 7:22 AM

59 comments Links to this post


Wednesday, February 6, 2008gap down
Yesterday something happened that doesn't bode well for the market. When the market gapped down through the trend line it was a signal that something fundamental had changed in the market. The obvious answer is the ISM report made it clear to everyone that we are in a recession. Here's the next thing that has me worried. It seems the media pundits have come the full spectrum from no way we are going to have a recession Goldilocks is alive and well. Then it progressed to only a very slim chance of a recession. Then: well maybe a 50/50 chance. Now it's: we are probably going to have a recession with the caveat that it will be mild. That caveat has me worried. Investors have been in denial the whole way. In secular bear markets recessions tend to be rather nasty. I don't know how many are old enough to remember but we had multiple recessions during the last secular bear market from 66-82. Most of them were not pleasant. The markets inability to rally today after yesterday's 90% down volume day also doesn't bode well.


Posted by Gary at 4:25 PM

45 comments Links to this post


Tuesday, February 5, 2008Yet again the Yen
At the moment I'm watching the pennant forming in the Yen. If this breaks to the upside it's going to put a lot of pressure on the markets as the carry trades begin to unwind again. If it breaks to the downside then there's probably a good chance the Jan. lows will hold. Usually these little triangle consolidations form about half way through a move which doesn't bode well for the market. The last explosive rally spawned the waterfall decline in the global markets. I suspect that another such rally would have similar effects. So far we've seen 200 basis points of cuts from the Fed with no effect. You have to wonder at what point do they finally figure out that you can't cure inflation with more inflation. Granted we are going to experience deflation if the economy slips into recession. The problem is that when we emerge from that recession we will have put into place all the ingredients for soaring inflation again which will most likely have the same effect next time that it did this time. That being spiking energy prices and constrained economic growth. The vicious cycle of stagflation then emerges. By trying to save the economy before the elections the Fed just guarantees that the problem gets bigger and bigger.


Posted by Gary at 6:51 PM

29 comments Links to this post


Monday, February 4, 2008Technical rule #1
I'm sure everyone knows by now I'm not a big pattern fan. There are two patterns that I do pay attention to. One is triangle patterns. These are almost always a consolidation or distribution pattern. The other is the technical rule #1 pattern. (The tech rules are on the lower right side of the home page). The more I see this pattern the more useful I find it. More on this pattern in tonights update for subscribers. Looking at the chart above we see the tech rule 1 pattern playing out to a tee. the first move down followed by a short consolidation and then a second leg down of similar magnitude. Then a retracement back to the consolidation area. I've also noted the resistance level from the Aug. & Nov. lows along with the declining trend line. I suspect somewhere around 1400-1425 the market is going to run into stiff resistance and we are going to break the rising trend out of the Jan. low for a retest of the lows and possibly another leg down.


Posted by Gary at 7:57 PM

38 comments Links to this post


Newer Posts Older Posts Home
金币:
奖励:
热心:
注册时间:
2006-7-3

回复 使用道具 举报

 楼主| 发表于 2009-3-22 15:41 | 显示全部楼层
Sunday, February 3, 2008Monthly chart
Despite the latest rally the monthly charts are showing a deteriorating picture. The 12 month moving average is now turning down. Something that hasn’t happened during this bull market. I would like to se a test of that moving average and failure before adding to any shorts. In the last 28 years any time Jan. has been a down month there has always been lower lows to follow later in the spring or summer. At this time I don’t think we’ve put in the final 4 year cycle low. I do think we most likely still have more upside to this rally though before the bear returns to finish his work. The COT’s showed a large increase in longs which would also suggest that there may be more upside yet to come.


Posted by Gary at 9:05 AM

17 comments Links to this post


Thursday, January 31, 2008Bulls and Bears


I think it was Ed Sekota who suggested this.

Do me a favor and click on the first chart. Now go to the other side of the room and see if you can tell which way this chart is going. To my view it's trending up. Now do the same thing for the last chart. It appears at least to me to be trending down. Now you can try to pick tops and bottoms all you want. As a matter of fact I used to try in my younger years :) .....it cost me money. I don't play that fools game anymore. If the larger trend is up then I invest from the long side. If it's down then I invest from the short side. The gains on the long side will always have the potential to be greater than the short side so if I have a choice I will tend to look for bull markets. Notice the huge consolidation in gold over the last year and a half. Consolidations tend to result in rallies of a similar magnitude. The bigger the consolidation often the bigger the rally. I don't know about you but I don't see anything in either of those first two charts that makes me want to try and pick a top.


Posted by Gary at 9:49 AM

95 comments Links to this post


Wednesday, January 30, 2008Inflation here we come
#1 long term tenet. "Given the choice between inflation and deflation the Fed will inflate."

I've said all along that the Fed would choose inflation over any kind of deflation especially during an election year. Today the Fed made that more clear than ever. After cutting 75 basis points just 7 days ago they tacked on another 50 today. The inflation genie is now about 90% out of the bottle. As expected we are heading down the exact same path as in the 70's. Make no mistake soaring inflation is in our future. Many think that because we aren't seeing double digit inflation right now that it won't happen this time. That this time is different. Hmm... didn't investors think that it was different this time in 2000. Didn't home owners think it was different this time in 05. Commodity prices especially gold is warning the folly of this misplaced hope. I've got news for you. It's never different. Human nature never changes....never!

Posted by Gary at 5:53 PM

51 comments Links to this post


Tuesday, January 29, 2008Gold breakout

In a previous post I pointed out that gold had broken out to new all time highs. I also quoted historic averages that once a commodity breaks out to new all time highs the average gain has been 180%. Tonight I'm going to show you what has transpired already in oil and what could be unfolding in the precious metals markets right now.

The first chart is a long term view of oil. Notice that once the all time highs of $40 were broken oil only dipped back below that level once and then only very briefly. After that it tested the $40 breakout once never to be seen again. At $100 oil has tacked on 150% above the old highs.

Moving to the next chart we see that gold has now also broken to new highs. It has also tested the breakout level. While anything is possible there is a strong probability that we will never see $850 again for years to come. Now is not the time to lose your position in gold. If we get lucky and it does pull back then buy more. I'm not very confident that we are going to get that option though. I'm definitely not willing to lose my position on the hopes that it will pullback below the breakout level. Even if it did how would you know when to buy? I dare say most people let their emotions control them when an asset is going down and is on sell they are to afraid to buy.

If gold was to only match oil and move up 150% that would give us a gold price of $2125. However I think it will move up much further than oil will because it's much easier for the public to buy into the gold market. When the public finally catches on and they will catch on eventually they are going to push gold prices into the stratosphere. A buy and hold strategy will guarantee you will capture all those gains. Trying to trade the PM bull will most likely guarantee you will miss most of those gains. If you want to become rich from this bull market then you have to be willing to do what it takes to ride this bull.

Posted by Gary at 8:21 PM

68 comments Links to this post


Monday, January 28, 2008point & figure charts

I see a lot of investors wondering if they should get ready to short the market. While I think that the bear most definitely isn't done yet I have no desire to concentrate on shorting stocks right now. Why you ask? Just look what's unfolding right before our eyes. One of the great bull markets of all time is going on. The potential profits from this bull are going to make any gains achieved on the short side look puny.


Posted by Gary at 6:15 PM

47 comments Links to this post


Saturday, January 26, 2008Looking for the next sector
I think we all realize we are in the grip of the bear at this point. Even Kudlow is starting to come to grips with the notion that we are going to experience a recession. What I don't see yet is despair. I see too many analysts trying to pick the bottom or the old "invest for the long term" crap being bandied about. We had a semi panic day on Tuesday but the Fed jumped in and saved the day. Actually they just made it worse. They are now guaranteeing that inflation is going to be spiking at the same time we are heading into an economic recession. What a wonderful combination! I'll be watching the COT's as usual for signs that the big money is buying. That will be our cue that it's time to jump back in the pool. In the meantime we need to be making plans for what we want to be buying when that bottom arrives. Well let's step back and look at what's going on. The Fed is now in panic mode just like I said they would be. The economy is slipping into recession and the politicians are freaking out. Incredible pressure is being brought on Ben to do something dammit. Well the only thing Ben can do is the wrong thing. Of course that doesn't matter to the politicians as long as it looks like something is being done. We need to be ready to take advantage of the Fed's actions. What's the one sector that is defying the bear? Precious metals of course. Gold and silver. Heck the precious metals are just about the only thing that's up so far this year. Now if they can hold up and actually rally while the rest of the market is failing can you imagine whats going to happen when this market bottoms and turns up?

I see quite a few analysts including Cramer beating the table on energy. I do think energy is going to perform well during the next bull but it's not going to be the leader anymore. Energy was the leader during the first phase of the commodity bull. We are now into the second phase. It's time for the laggards to catch up. Liquidity is going to flow into the undervalued sectors. That would be precious metals and agriculture. We are going to get the buying opportunity of a lifetime soon and you know what? Most investors are going to miss it. Not because they are afraid the bear isn't finished. No they are going to miss it because they will think that gold is too expensive or it's too overbought. Many will rationalize that they will be able to get in at a later date at better prices. I've got news for you in a raging bull market (make no mistake that is what's happening in the precious metals sector) the bull makes it very hard for investors to get back in if they lose their position. Anybody here lose their position in the Nasdaq in 99? This bull will end up going much farther than almost anyone can imagine including me.

Posted by Gary at 6:06 AM

67 comments Links to this post


Friday, January 25, 2008Gold breakout
I've said this before but I think it's time to point it out again because I see many investors wavering here. WD Gann pointed out that the longer it takes for a commodity to breakout to new highs the greater the rally tends to be. Take a look at that chart folks. That's a 27 year consolidation. Let me repeat myself: 27 YEAR CONSOLIDATION!!!!! Now let me point out again that the average rally after a break to new highs is roughly 180%. I'm going to put this as gently as I can. You have to be an IDIOT to lose your position now. The dumbest thing anyone can do at this point is to try and time these short term swings in the gold market. This is the time when gold can and will start moving $20, $30 maybe even $50 at a time. If you're not in you risk missing the move. So what if gold pulls back here? It just did pullback $40 bucks. How many were able to time the exact bottom of the correction? I dare say none of you did. I'm also going to say this as gently as I can. Take your damn position and quit worrying about these swings. After all it is a bull market.


Posted by Gary at 1:21 PM

15 comments Links to this post


Newer Posts Older Posts Home
金币:
奖励:
热心:
注册时间:
2006-7-3

回复 使用道具 举报

 楼主| 发表于 2009-3-22 15:42 | 显示全部楼层
Wednesday, January 23, 2008Yen pullback?
The Yen has now rallied to the 95 level which was about where I expected it could get to before a pullback. If the Yen pulls back it will take a tremendous amount of pressure off the carry trade and the general market. However don't be fooled even though the rally today was impressive we are still in a bear market and the longer term trend for the Yen is still up. As long as this continues the 1.2 trillion dollars in carry trades are going to continue to unwind on rallies. Once the Yen consolidates and then starts another leg up I would look for the bear to return and probably in an even fouler mood. Unless the BOJ decides to reverse policy and devalue their currency this will continue. Expect to see oil strengthen if the Yen pulls back for any appreciable time also.


Posted by Gary at 2:18 PM

54 comments Links to this post


Time for the baby to bounce?
We are getting an almost picture perfect tech rule #1 move (the technical rules are on the lower right hand side of the home page). First leg down, consolidation, 2nd leg down of roughly equal magnitude. The next significant move should be a bounce back up to the consolidation area. At this point I no longer want to press the short side. I'll elaborate in tonight's update.


Posted by Gary at 9:02 AM

27 comments Links to this post


Monday, January 21, 2008Recession is now in the cards


I think its safe to say that we are in a bear market and that the stock market is discounting a recession. The first chart is the last time a right translated cycle discounted a recession. The 90 recession started in July 1990. The market didn't predict this recession it reacted to it. Also notice the similar waterfall decline that we are now experiencing. This happens as the market is forced to accept the fact that the economy is already in a recession. This is what happens when the Fed tinkers with the markets by flooding the system with liquidity. The market is buoyed till it is no longer possible to remain in denial. Then everyone runs for the door at once. Take note that we just saw a short consolidation in the S&P. The 1990 drop had two of these weak consolidations and 5 waves down. Obviously there's no way to tell how far the market will drop this time. I will point out that in 1990 the market was in a secular bull market and this time we are in a secular bear market. The next two charts show the VIX during the last two 4 year lows. Both spiked to the 45 level. As of Friday the Vix was at 28. I see where some investors seem to believe that the inverse funds (QID, SDS) are now being used to hedge and that is why the VIX isn't spiking yet. I'm not sure that is the answer for the simple reason that the VIX spiked in Aug. and Nov. The inverse funds have been available for the last year and a half. It doesn't seem reasonable that investors just now discovered these funds during the last month. No I think we will most likely see the Vix spike to "normal" 4 year cycle low levels before this is over.

I think we are at a very critical level right now. The market is screaming for Bernanke to cut big. The problem is there is a 1.2 trillion dollar sword hanging over the market in the form of the carry trade. A big cut now might crash the dollar and spike the Yen. This could cause an avalanche of carry trades to unwind all at once. Let's just say I wouldn't want to be Bernanke right now.

Most importantly how do we spot the bottom? As you can see it would have been fairly difficult to spot the bottom in 1990 in real time with just TA. Personally I will be not only looking at the technicals but also watching the COT reports for signs the big money is buying.


Posted by Gary at 7:48 AM

116 comments Links to this post


Saturday, January 19, 2008Dow:Gold ratio
It's time to look at the most important chart in the world again. That's right the Dow:gold ratio. We see the 16 level has fallen and we are now down in the 13 range. That means that it takes 13 oz. of gold to buy one share of the Dow. In 2000 it took 42 oz. of gold to buy one share of the Dow. Anyone who thinks that we have been in a bull market for paper assets since 2002 is fooling themselves. We are and continue to be in a secular bear market for paper and a secular bull market for hard assets. Historically this trend will not change until the Dow and gold are selling close to parity. Gold just broke out to new highs. The average gain for a commodity after it breaks out to new all time highs is roughly 180%. That puts gold in the $2500 range. It won't get there over night and there will be scary shakeouts but I have no doubt that it will get there. As a matter of fact I suspect it will double that. At some point in the future we will most likely see gold and the Dow trading in the $5000 range. There are going to be millionaires made in the coming years for the investors that can ride this bull. Those that get repeatedly bucked off are going to miss the boat. Saddle up cowboys and cowgirls and prepare to hold on tight because you ain't seen nothing yet.

Posted by Gary at 10:14 AM

60 comments Links to this post


Friday, January 18, 2008At the whim of the Yen
This wicked sell off has been mirrored by the explosive gain in the Yen. The last peak to peak rally tallied up 5%. This rally is only up 1%. I think there's still more to go yet before the Yen pulls back. That pullback will most likely correspond to another bear market rally. I doubt this bear market will halt until the Fed convinces the BOJ to devalue their currency and support the dollar again. Back in July the BOJ changed policy to a strong Yen in an attempt to control spiking inflation. That has had a negative effect on both the Nikkei and the rest of the global markets. Have no fear though at some point public outcry will force the BOJ to reverse policy back to inflation from their current sensible one to protect their currency. Sadly if they could resist this demand to inflate they would emerge from the recession much stronger. Instead they will end up prolonging the pain and making it much worse in the long run.


Posted by Gary at 7:33 AM

39 comments Links to this post


Wednesday, January 16, 2008Year's ending in 7 can be rough.
Years ending in 6 and 7 have tended to be topping years in the market. 7 of the largest 15 declines in market history topped in years ending in 6 or 7. The long term trend is clearly broken. Markets can easily drop 30-40% when discounting a recession. A 30% decline would take the S&P back to the 04 lows. Considering that the market really didn't appreciate that much in inflation adjusted terms and a 30% decline would clearly suggest that we are in fact in a long term secular bear market. So far this is playing out almost exactly like the 66-82 bear market. We should now have several years of sharp moves up and down as the Fed continues to try and inflate away all the troubles but in fact just pushes inflation higher and higher. The 70's stagflation scenario is playing out right on cue. Does anyone remember where the money was made in the 66-82 bear market? That's right commodities. Specifically gold and silver should outperform as they have underperformed during the first phase of the bull.


Posted by Gary at 6:25 PM

55 comments Links to this post


Newer Posts Older Posts Home
金币:
奖励:
热心:
注册时间:
2006-7-3

回复 使用道具 举报

您需要登录后才可以回帖 登录 | 立即注册

本版积分规则

本站声明:MACD仅提供交流平台,请交流人员遵守法律法规。
值班电话:18209240771   微信:35550268

举报|意见反馈|手机版|MACD俱乐部

GMT+8, 2025-7-22 07:03 , Processed in 0.075941 second(s), 9 queries , MemCached On.

Powered by Discuz! X3.4

© 2001-2017 Comsenz Inc.

快速回复 返回顶部 返回列表