- 金币:
-
- 奖励:
-
- 热心:
-
- 注册时间:
- 2006-7-3
|
|

楼主 |
发表于 2009-3-22 16:01
|
显示全部楼层
Thursday, September 27, 2007Gold pennant
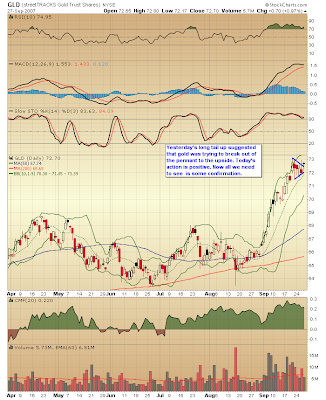 I've been pointing this out to subscribers for a couple of days now. GLD has formed a pennant pattern. Yes I'm showing you a pattern. I know shell shock right? :) The only reason I'm pointing it out is that I'm bullish on PM. Now that I've got the disclaimer in; I've noticed in the past that these continuation patterns often form about half way through a move. As of today GLD is looking like it wants to break out of the pennant to the upside. Many of the leading gold stocks were very strong today. Probably a good sign that gold will be moving higher in the coming days. If you are trying to trade gold be mindful of your position size as the sentiment in gold is getting quite bullish. However I think the rise was so swift that many investors missed this trade and even though they may be bullish I'm not sure they've actually committed cash. If not and gold continues to rally we may get investors eventually chasing GLD higher. Just remember the PM are volatile and it could just as easily take a dive. I've been pointing this out to subscribers for a couple of days now. GLD has formed a pennant pattern. Yes I'm showing you a pattern. I know shell shock right? :) The only reason I'm pointing it out is that I'm bullish on PM. Now that I've got the disclaimer in; I've noticed in the past that these continuation patterns often form about half way through a move. As of today GLD is looking like it wants to break out of the pennant to the upside. Many of the leading gold stocks were very strong today. Probably a good sign that gold will be moving higher in the coming days. If you are trying to trade gold be mindful of your position size as the sentiment in gold is getting quite bullish. However I think the rise was so swift that many investors missed this trade and even though they may be bullish I'm not sure they've actually committed cash. If not and gold continues to rally we may get investors eventually chasing GLD higher. Just remember the PM are volatile and it could just as easily take a dive.
Posted by Gary at 3:50 PM
75 comments Links to this post 
Wednesday, September 26, 2007Thanks Fed, Thanks a lot
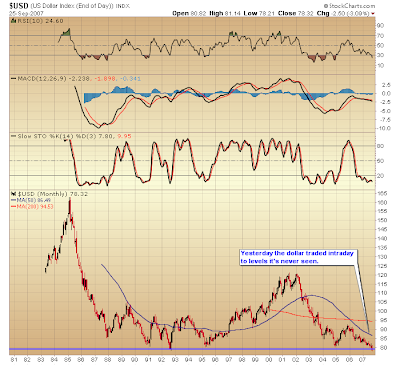 Yesterday the dollar traded intraday down to levels it has never been at before. I expect we could see an attempt at a rally here but it seems very unlikely that it will amount to much. Take a look at the long term chart of our currency and you can see what the Fed has done to the purchasing power of our money. Be thankful I can't show you a chart from 1913 when the Fed was created, you would freak out. Since 1913 the Fed has destroyed over 90% of the purchasing power of the dollar. Thanks Fed, thanks a lot. If the dollar does try and hold the line in the sand however temporary then Gold may hesitate here for a bit. However with all the recession talk I'm hearing on the media now days it seems like an almost sure bet the Fed is setting their cover for another rate cut next month. I highly suspect that the reaction of the dollar and gold is going to be the same as it was last week when they cut. Dollar down gold up. Yesterday the dollar traded intraday down to levels it has never been at before. I expect we could see an attempt at a rally here but it seems very unlikely that it will amount to much. Take a look at the long term chart of our currency and you can see what the Fed has done to the purchasing power of our money. Be thankful I can't show you a chart from 1913 when the Fed was created, you would freak out. Since 1913 the Fed has destroyed over 90% of the purchasing power of the dollar. Thanks Fed, thanks a lot. If the dollar does try and hold the line in the sand however temporary then Gold may hesitate here for a bit. However with all the recession talk I'm hearing on the media now days it seems like an almost sure bet the Fed is setting their cover for another rate cut next month. I highly suspect that the reaction of the dollar and gold is going to be the same as it was last week when they cut. Dollar down gold up.
Posted by Gary at 6:41 AM
44 comments Links to this post
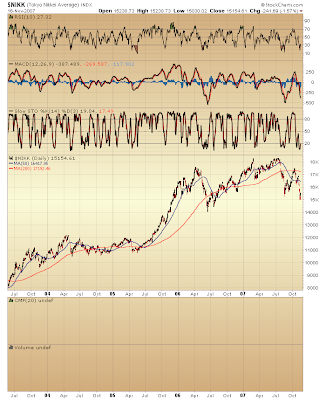
Monday, September 24, 2007Hope and Fear
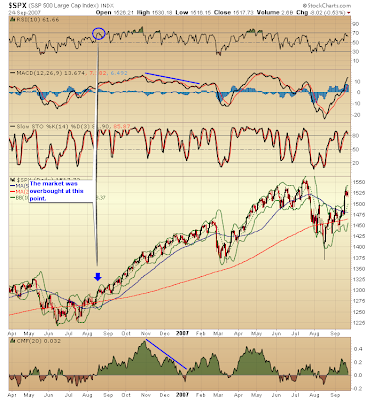
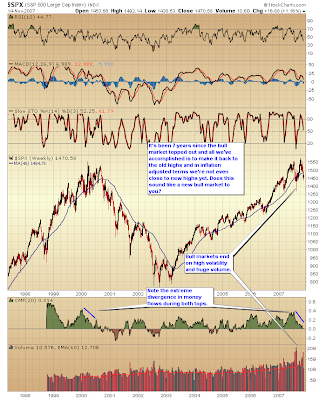
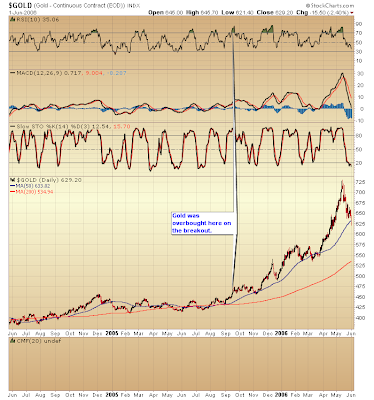 I see quite a few comments on the blogs that the markets are overbought and that's the reason that a correction is imminent. I've got news for you hope and fear operate differently. Which is to say that markets don't go up the same way they go down. Pretty much any breakout is going to be overbought. Just look at the two charts. The S&P was already overbought by the middle of Aug. in 06 but that didn't stop it from going up another 6 1/2 months. Same for gold only it was even more extreme. As markets continue to rise hope gradually brings more and more investors in as an increasing amount of people become confident in the move. Sometimes this becomes really heated and you get a parabolic rise. Fear is a different animal altogether. It doesn't take too much pain before everyone gives up all at the same time. When that happens there are no sellers left to sell and the market has no where to go but up. That's why the VTO and Bollinger band crash trades work during declines. If you tried to reverse the rules and apply them to tops they will fail miserably. I see quite a few comments on the blogs that the markets are overbought and that's the reason that a correction is imminent. I've got news for you hope and fear operate differently. Which is to say that markets don't go up the same way they go down. Pretty much any breakout is going to be overbought. Just look at the two charts. The S&P was already overbought by the middle of Aug. in 06 but that didn't stop it from going up another 6 1/2 months. Same for gold only it was even more extreme. As markets continue to rise hope gradually brings more and more investors in as an increasing amount of people become confident in the move. Sometimes this becomes really heated and you get a parabolic rise. Fear is a different animal altogether. It doesn't take too much pain before everyone gives up all at the same time. When that happens there are no sellers left to sell and the market has no where to go but up. That's why the VTO and Bollinger band crash trades work during declines. If you tried to reverse the rules and apply them to tops they will fail miserably.
Posted by Gary at 9:27 PM
30 comments Links to this post
Saturday, September 22, 2007GS a Guaranteed 30% Return revisited
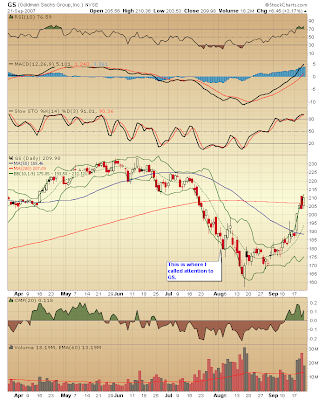
Remember this post GS A Guaranteed 30% return. I took a lot of heat on this one. But only a little more than one month later Goldman is up 20% already. Come to find out Goldman is a pretty good company. Even though the charts were telling us that Goldman's business was going to hell in a hand basket we now find out that Goldman's traders were a little more savvy than that. They had been shorting the real estate debacle. So instead of losing a ton of money they actually made a ton. Who knew? I only show this because it illustrates very well how panicking never made anybody any money.
Posted by Gary at 4:23 PM
54 comments Links to this post
Thursday, September 20, 2007"After all it is a bull market"
I love this story from Reminisces of a stock operator. It is so appropriate to the gold and silver market.
"Most let us call' em customers -- are alike. You find very few who can truthfully say that Wall Street doesn't owe them money. In Fullerton's there were the usual crowd. All grades!Well, there was one old chap who was not like the others. To begin with, he was a much older man. Another thing was that he never volunteered advice and never bragged of his winnings. He was a great hand for listening very attentively to the others.He did not seem very keen to get tips -- that is, he never asked the talkers what they'd heard or what they knew. But when somebody gave him one he always thanked the tipster very politely. Sometimes he thanked the tipster again -- when the tip turned out O.K. But if it went wrong he never whined, so that nobody could tell whether he followed it or let it slide by. It was a legend of the office that the old jigger was rich and could swing quite a line. But he wasn't donating much to the firm in the way of commissions; at least not that anyone could see. His name was Partridge, but they nicknamed him Turkey behind his back, because he was so thick-chested and had a habit of strutting about the various rooms, with the point of his chin resting on his breast.The customers, who were all eager to be shoved and forced into doing things so as to lay the blame for failure on others, used to go to old Partridge and tell him what some friend of a friend of an insider had advised them to do in a certain stock.They would tell him what they had not done with the tip so he would tell them what they ought to do. But whether the tip they had was to buy or to sell, the old chap's answer was always the same.The customer would finish the tale of his perplexity and then ask: "What do you think I ought to do?"Old Turkey would cock his head to one side, contemplate his fellow customer with a fatherly smile, and finally he would say very impressively, "You know, it's a bull market!"Time and again I heard him say, "Well, this is a bull market,you know!" as though he were giving to you a priceless talisman wrapped up in a million-dollar accident-insurance policy. And of course I did not get his meaning.One day a fellow named Elmer Harwood rushed into the office, wrote out an order and gave it to the clerk. Then he rushed over to where Mr. Partridge was listening politely to John Fanning's story of the time he overheard Keene give an order to one of his brokers and all that John made was a measly three points on a hundred shares and of course the stock had to go up twenty-four points in three days right after John sold out. It was at least the fourth time that John had told him that tale of woe, but old Turkey was smiling as sympathetically as if it was the first time he heard it. Well, Elmer made for the old man and, without a word of apology to John Fanning, told Turkey, "Mr. Partridge, I have just sold my Climax Motors. My people say the market is entitled to a reaction and that I'll be able to buy it back cheaper. So you'd better do likewise. That is, if you've still got yours."Elmer looked suspiciously at the man to whom he had given the original tip to buy. The amateur, or gratuitous, tipster always thinks he owns the receiver of his tip body and soul, even before he knows how the tip is going to turn out."Yes, Mr. Harwood, I still have it. Of course!" said Turkey gratefully. It was nice of Elmer to think of the old chap."Well, now is the time to take your profit and get in again on the next dip," said Elmer, as if he had just made out the deposit slip for the old man. Failing to perceive enthusiastic gratitude in the beneficiary's face Elmer went on: "I have just sold every share I owned!" From his voice and manner you would have conservatively estimated it at ten thousand shares.But Mr. Partridge shook his head regretfully and whined, "No!No! I can't do that!":'What?" yelled Elmer. "I simply can't!" said Mr. Partridge. He was in great trouble."Didn't I give you the tip to buy it?""You did, Mr. Harwood, and I am very grateful to you.Indeed, I am, sir. But --" "Hold on! Let me talk! And didn't that stock go up seven points in ten days? Didn't it?""It did, and I am much obliged to you, my dear boy. But I couldn't think of selling that stock." "You couldn't?" asked Elmer, beginning to look doubtful himself. It is a habit with most tip givers to be tip takers."No, I couldn't.""Why not?" And Elmer drew nearer."Why, this is a bull market!" The old fellow said it as though he had given a long and detailed explanation."That's all right," said Elmer, looking angry because of his disappointment. "I know this is a bull market as well as you do. But you'd better slip them that stock of yours and buy it back on the reaction. You might as well reduce the cost to yourself.""My dear boy," said old Partridge, in great distress "my dear boy, if I sold that stock now I'd lose my position; and then where would I be?"Elmer Harwood threw up his hands, shook his head and walked over to me to get sympathy: "Can you beat it?" he asked me in a stage whisper. "I ask you!"I didn't say anything. So he went on: "I give him a tip on Climax Motors. He buys five hundred shares. He's got seven points' profit and I advise him to get out and buy 'em back on the reaction that's overdue even now. And what does he say when I tell him? He says that if he sells he'll lose his job. What do you know about that?""I beg your pardon, Mr. Harwood; I didn't say I'd lose my job," cut in old Turkey. "I said I'd lose my position. And when you are as old as I am and you've been through as many booms and panics as I have, you'll know that to lose your position is something nobody can afford; not even John D. Rockefeller. I hope the stock reacts and that you will be able to repurchase your line at a substantial concession, sir. But I myself can only trade in accordance with the experience of many years. I paid a high price for it and I don't feel like throwing away a second tuition fee. But I am as much obliged to you as if I had the money in the bank. It's a bull market, you know." And he strutted away, leaving Elmer dazed. What old Mr. Partridge said did not mean much to me until I began to think about my own numerous failures to make as much money as I ought to when I was so right on the general market.The more I studied the more I realized how wise that old chap was. He had evidently suffered from the same defect in his young days and knew his own human weaknesses. He would not lay himself open to a temptation that experience had taught him was hard to resist and had always proved expensive to him, as it was to me.
Posted by Gary at 6:57 PM
22 comments Links to this post
Point and Figure charts
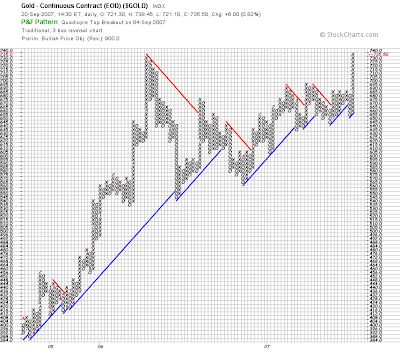
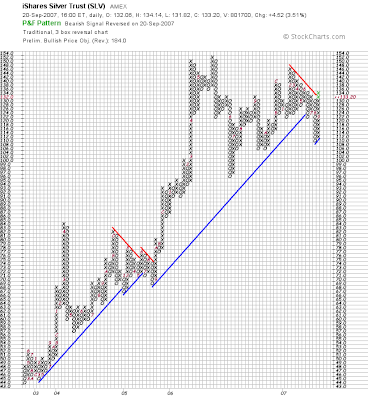
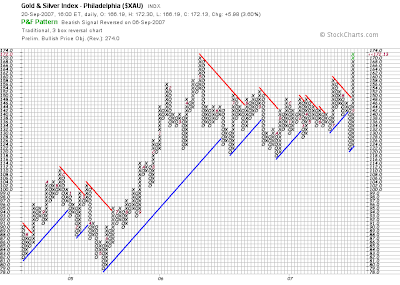 Since we were discussing the Point and figure charts in the last thread I thought I'd put them up. Breakouts in Gold and XAU. SLV has reversed the down trend. The bullish price objective on gold is $900. SLV is almost $190 which would be $19 silver and the XAU is coming in at $274. That would be pretty close to my observation that each major upleg has resulted in a 100% swing for the XAU and HUI from trough to peak. I wouldn't even think about trimming any of my PM positions until we get to those levels. Since we were discussing the Point and figure charts in the last thread I thought I'd put them up. Breakouts in Gold and XAU. SLV has reversed the down trend. The bullish price objective on gold is $900. SLV is almost $190 which would be $19 silver and the XAU is coming in at $274. That would be pretty close to my observation that each major upleg has resulted in a 100% swing for the XAU and HUI from trough to peak. I wouldn't even think about trimming any of my PM positions until we get to those levels.
Posted by Gary at 4:09 PM
13 comments Links to this post
Wednesday, September 19, 2007silver/gold ratio
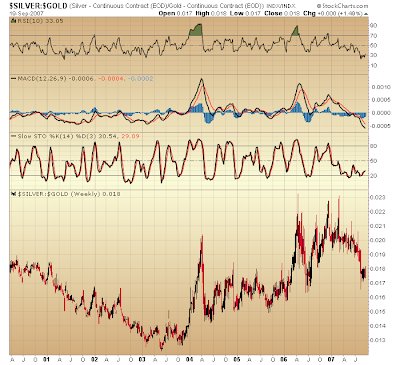 Since the middle of 03 silver has been outperforming gold. Notice how silver when it starts to move takes off like a rocket. That's what happens when a little bit of money moves into a very thin market. Silver took a beating on Aug. 16th. However look what has happened in the past after one of these washouts. I have a feeling it won't be too long before silver starts to make up for lost time. If there is anything in the investing world that is ridiculously cheap it's silver. The commercials seem to think so to as they have had over the last 4 weeks one of the smallest net short position since 03. Even more bullish in my opinion is the fact that as silver rose almost a dollar they got even more bullish. This my friends is one of those opportunities that only come around every once in a while. I've heard a bit of talk about gold in the media recently mostly as a signal of inflation rarely as an investment but I have yet to hear a single thing about silver. I just love it when that happens. It means silver has a long long ways to go. Since the middle of 03 silver has been outperforming gold. Notice how silver when it starts to move takes off like a rocket. That's what happens when a little bit of money moves into a very thin market. Silver took a beating on Aug. 16th. However look what has happened in the past after one of these washouts. I have a feeling it won't be too long before silver starts to make up for lost time. If there is anything in the investing world that is ridiculously cheap it's silver. The commercials seem to think so to as they have had over the last 4 weeks one of the smallest net short position since 03. Even more bullish in my opinion is the fact that as silver rose almost a dollar they got even more bullish. This my friends is one of those opportunities that only come around every once in a while. I've heard a bit of talk about gold in the media recently mostly as a signal of inflation rarely as an investment but I have yet to hear a single thing about silver. I just love it when that happens. It means silver has a long long ways to go.
Posted by Gary at 10:18 PM
27 comments Links to this post
Newer Posts Older Posts Home |
|
|
 [复制链接]


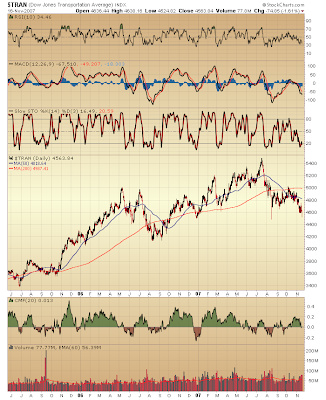
 I've included a few charts today of specific sectors that are already in a bear market or are dangerously close. Of course we all know the financials are in trouble. The thing that's troubling here is that they make up 20% of the S&P. Unless they can all of a sudden find new life and start rallying strongly I don't see how the general market is going to make a lot of headway. The other obvious one is housing. No need to elaborate there. Third on the list is retail. This one is concerning since we're in a time of year when retail should be moving up strong as it has every other year since 03. Instead it's dropping like a stone. Since the consumer is 70% of totally GDP this just doesn't bode well. The transports are also flirting with bear market status. I could have also included the semi's here. The SOX rolling over right before Christmas isn't a particularly bullish development either.